

Results of a Geant4 benchmarking study for bio-medical applications, performed with the G4-Med system
- PMID: 39981742
- PMCID: PMC12059550
- DOI: 10.1002/mp.17678
Results of a Geant4 benchmarking study for bio-medical applications, performed with the G4-Med system
Abstract
Background: Geant4, a Monte Carlo Simulation Toolkit extensively used in bio-medical physics, is in continuous evolution to include newest research findings to improve its accuracy and to respond to the evolving needs of a very diverse user community. In 2014, the G4-Med benchmarking system was born from the effort of the Geant4 Medical Simulation Benchmarking Group, to benchmark and monitor the evolution of Geant4 for medical physics applications. The G4-Med system was first described in our Medical Physics Special Report published in 2021. Results of the tests were reported for Geant4 10.5.
Purpose: In this work, we describe the evolution of the G4-Med benchmarking system.
Methods: The G4-Med benchmarking suite currently includes 23 tests, which benchmark Geant4 from the calculation of basic physical quantities to the simulation of more clinically relevant set-ups. New tests concern the benchmarking of Geant4-DNA physics and chemistry components for regression testing purposes, dosimetry for brachytherapy with a source, dosimetry for external x-ray and electron FLASH radiotherapy, experimental microdosimetry for proton therapy, and in vivo PET for carbon and oxygen beams. Regression testing has been performed between Geant4 10.5 and 11.1. Finally, a simple Geant4 simulation has been developed and used to compare Geant4 EM physics constructors and physics lists in terms of execution times.
Results: In summary, our EM tests show that the parameters of the multiple scattering in the Geant4 EM constructor G4EmStandardPhysics_option3 in Geant4 11.1, while improving the modeling of the electron backscattering in high atomic number targets, are not adequate for dosimetry for clinical x-ray and electron beams. Therefore, these parameters have been reverted back to those of Geant4 10.5 in Geant4 11.2.1. The x-ray radiotherapy test shows significant differences in the modeling of the bremsstrahlung process, especially between G4EmPenelopePhysics and the other constructors under study (G4EmLivermorePhysics, G4EmStandardPhysics_option3, and G4EmStandardPhysics_option4). These differences will be studied in an in-depth investigation within our Group. Improvement in Geant4 11.1 has been observed for the modeling of the proton and carbon ion Bragg peak with energies of clinical interest, thanks to the adoption of ICRU90 to calculate the low energy proton stopping powers in water and of the Linhard-Sorensen ion model, available in Geant4 since version 11.0. Nuclear fragmentation tests of interest for carbon ion therapy show differences between Geant4 10.5 and 11.1 in terms of fragment yields. In particular, a higher production of boron fragments is observed with Geant4 11.1, leading to a better agreement with reference data for this fragment.
Conclusions: Based on the overall results of our tests, we recommend to use G4EmStandardPhysics_option4 as EM constructor and QGSP_BIC_HP with G4EmStandardPhysics_option4, for hadrontherapy applications. The Geant4-DNA physics lists report differences in modeling electron interactions in water, however, the tests have a pure regression testing purpose so no recommendation can be formulated.
Keywords: Geant4; benchmarking; bio‐medical physics.
© 2025 The Author(s). Medical Physics published by Wiley Periodicals LLC on behalf of American Association of Physicists in Medicine.
Conflict of interest statement
The authors declare no conflicts of interest.
Figures


 OncuraTM 6711 source. When not visible, the error bars are within the symbols. The dashed line represents the inverse square law distribution as is the case for a non interacting isotropic point source. Right: Ratio of the simulation and experimental data (Dolan et al.
44
). The shadowed area represents an agreement within 5% with the reference data. Geant4 11.1 is used. To note, the two plots have different scales on the x‐axis.
OncuraTM 6711 source. When not visible, the error bars are within the symbols. The dashed line represents the inverse square law distribution as is the case for a non interacting isotropic point source. Right: Ratio of the simulation and experimental data (Dolan et al.
44
). The shadowed area represents an agreement within 5% with the reference data. Geant4 11.1 is used. To note, the two plots have different scales on the x‐axis.


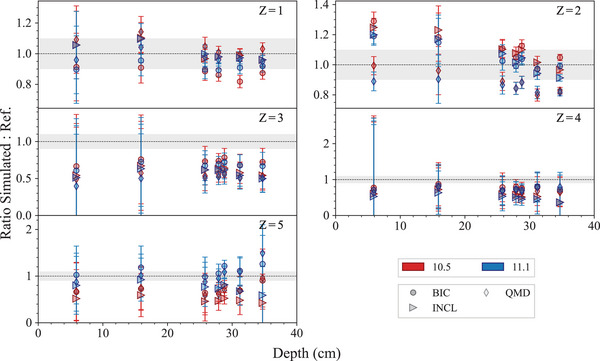
 production double‐differential cross sections, obtained with 62 MeV/u
  ions incident on a thin natural carbon target, calculated with Geant4 10.5 and 11.1. The simulation uncertainty is calculated, assuming a Poisson distribution, proportional to the square root of the number of events in each bin. Reference experimental measurements from De Napoli et al.
 production double‐differential cross sections, obtained with 62 MeV/u
  ions incident on a thin natural carbon target. The shadowed area represents a 10% agreement. Reference experimental measurements from De Napoli et al.
 total and partial charge‐changing cross sections. The energy of the incident
  ion beam is 300 MeV/u. The error bars of the simulation results are within the symbols. Bottom: ratio of simulated and reference data for Geant4 10.5 and 11.1. The shadowed area represents an agreement within 10%.
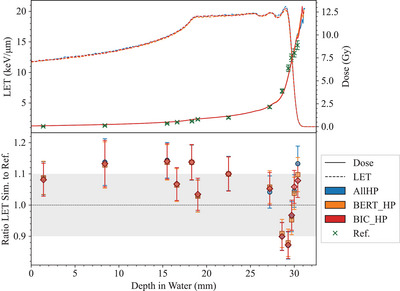
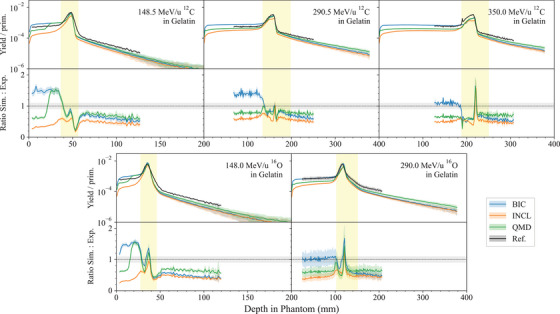
 ion, with energy 148.5 MeV/u (left), 290.5 MeV/u (middle), and 350 MeV/u (right). Bottom row:
  ion, with energy 148 MeV/u (left) and 290 MeV/u (right). The positron yield is plotted with respect to the depth in the gelatin phantom. The yellow areas indicate the Bragg peak regions. The bottom plots in each row show the ratio between simulated and experimental data. The shadowed area represents an agreement within 10%, while the uncertainties (2) affecting the simulation results are shown as a shade around the curve. Experimental measurements from Chacon et al.
 ion, with energy 148.5 MeV/u (left), 290.5 MeV/u (middle), and 350 MeV/u (right). Bottom row:
  ion, with energy 148 MeV/u (left) and 290 MeV/u (right). The positron yield is plotted with respect to the depth in the PMMA phantom. The yellow areas indicate the Bragg peak regions. The bottom plots in each row show the ratio between simulated and experimental data. The shadowed area represents an agreement within 10%, while the uncertainties (2) affecting the simulation results are shown as a shade around the curve. Experimental measurements from Chacon et al.
 ion, with energy 148.5 MeV/u (left), 290.5 MeV/u (middle), and 350 MeV/u (right). Bottom row:
  ion, with energy 148 MeV/u (left) and 290 MeV/u (right). The positron yield is plotted with respect to the depth in the polyethylene phantom. The yellow areas indicate the Bragg peak regions. The bottom plots in each row show the ratio between simulated and experimental data. The shadowed area represents an agreement within 10%, while the uncertainties (2) affecting the simulation results are shown as a shade around the curve. Experimental measurements from Chacon et al.

 ). The error bars are calculated at a 95% confidence level.


 species calculated with the chemistry test, using the SBS, IRT‐sync, and IRT models. Results obtained with Geant4 11.1. The error bars of the simulation results are within the symbols.

References
-
- Agostinelli S, Allison J, Amako K, et al. Geant4—a simulation toolkit. Nucl Instrum Methods Phys Res, Sect A. 2003;506(3):250‐303. ISSN 0168‐9002. doi:10.1016/S0168-9002(03)01368-8 - DOI
-
- Allison J, Amako K, Apostolakis J, et al. Geant4 developments and applications. IEEE Trans Nucl Sci. 2006;53(1):270‐278. doi:10.1109/TNS.2006.869826 - DOI
-
- Allison J, Amako K, Apostolakis J, et al. Recent developments in Geant4. Nucl Instrum Methods Phys Res, Sect A. 2016;835:186‐225. ISSN 0168‐9002. doi:10.1016/j.nima.2016.06.125 - DOI
-
- Geant4 Simulation Benchmarking Group . G4‐Med webpage. 2018. Accessed 24th July, 2024. https://twiki.cern.ch/twiki/bin/view/Geant4/G4MSBG
-
- United States National Institutes of Health's National Library of Medicine (NIH/NLM). PubMed Central® (PMC). Accessed 1st May, 2018. https://www.ncbi.nlm.nih.gov/pmc/about/intro/
MeSH terms
Grants and funding
LinkOut - more resources
Full Text Sources
Research Materials
Miscellaneous
