. 2025 Mar;19(3):913-936.
doi: 10.1002/1878-0261.13789. Epub 2025 Feb 21.

The polyamine transporter ATP13A3 mediates difluoromethylornithine-induced polyamine uptake in neuroblastoma

Affiliations

The polyamine transporter ATP13A3 mediates difluoromethylornithine-induced polyamine uptake in neuroblastoma

Mujahid Azfar et al. Mol Oncol. 2025 Mar.

Erratum in

Abstract

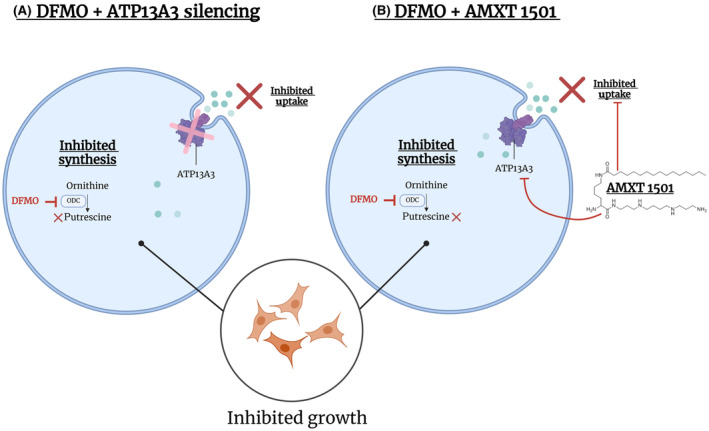
High-risk neuroblastomas, often associated with MYCN protooncogene amplification, are addicted to polyamines, small polycations vital for cellular functioning. We have previously shown that neuroblastoma cells increase polyamine uptake when exposed to the polyamine biosynthesis inhibitor difluoromethylornithine (DFMO), and this mechanism is thought to limit the efficacy of the drug in clinical trials. This finding resulted in the clinical development of polyamine transport inhibitors, including AMXT 1501, which is presently under clinical investigation in combination with DFMO. However, the mechanisms and transporters involved in DFMO-induced polyamine uptake are unknown. Here, we report that knockdown of ATPase 13A3 (ATP13A3), a member of the P5B-ATPase polyamine transporter family, limited basal and DFMO-induced polyamine uptake, attenuated MYCN-amplified and non-MYCN-amplified neuroblastoma cell growth, and potentiated the inhibitory effects of DFMO. Conversely, overexpression of ATP13A3 in neuroblastoma cells increased polyamine uptake, which was inhibited by AMXT 1501, highlighting ATP13A3 as a key target of the drug. An association between high ATP13A3 expression and poor survival in neuroblastoma further supports a role of this transporter in neuroblastoma progression. Thus, this study identified ATP13A3 as a critical regulator of basal and DFMO-induced polyamine uptake and a novel therapeutic target for neuroblastoma.

Keywords: AMXT 1501; ATP13A3; DFMO; neuroblastoma; polyamine depletion; polyamine transport inhibitor.


Conflict of interest statement

MRB is the Founder, President and CSO at Aminex Therapeutics where he is an employee and stock owner. PV is involved in polyamine transporter drug screening efforts for cancer and Parkinson's disease.

Figures

Fig. 1
Fig. 1
Polyamine homeostasis in cancer cells. (A) Cancer cells rely on an elevated polyamine pool to drive their hyperproliferative phenotypes. This resulted in efforts to reduce cancer cells' elevated polyamine pools by inhibiting synthesis using difluoromethylornithine (DFMO) to target the rate‐limiting biosynthetic enzyme ODC1. (B) Cancer cells rescue their polyamine levels by a compensatory increase in polyamine uptake, the mechanism of which is poorly understood. (C) Combined inhibition of both polyamine biosynthesis using DFMO and polyamine uptake using a polyamine transport inhibitor like AMXT 1501 reduces the intracellular polyamine pool in cancer cells, thereby inhibiting polyamine‐driven cancer pathways. Figure made using BioRender. DFMO, difluoromethylornithine; ODC1, ornithine decarboxylase; ORN, ornithine; PUT, putrescine; SPD, spermidine; SPM, spermine.
Fig. 2
Fig. 2
High expression of SLC3A2 or ATP13A3 is a prognostic predictor for inferior outcome in neuroblastoma. (A) mRNA expression (Transcripts Per Million, TPM) of polyamine transporters in the SEQC neuroblastoma database (n = 498). Graph represents the distribution of data density of gene expression in neuroblastoma patients, with the central line representing the median, and the upper and lower lines indicating the third (Q3) and first (Q1) quartiles. (B–G) Kaplan–Meier survival curves for SLC3A2 (B, C), ATP13A3 (D, E) and ATP13A2 (F, G) in the neuroblastoma SEQC cohort. Patients were dichotomized around the upper quartile (UQ) of gene expression. Log‐rank test was used to compare the survival curves of the high and low expression groups.
Fig. 3
Fig. 3
SLC3A2 silencing does not abrogate DFMO‐induced polyamine uptake in neuroblastoma cells. (A, B) Reduced SLC3A2 protein (left) and mRNA (right) levels after siRNA‐mediated silencing (for 48 h) in SH‐SY5Y (A) and KELLY (B) cells. One sample t‐test was used to assess the significance of silencing relative to scr‐ctrl transduced cells. Presented immunoblots are representative of results obtained in at least three independently performed experiments. Graphs depict mean ± SEM of at least three independent biological repeats (n = 4 for SH‐SY5Y ATP13A3 protein; n = 3 for SH‐SY5Y ATP13A3 mRNA and KELLY ATP13A3 protein and mRNA). (C, D) Measurement of radiolabeled putrescine (PUT) or spermidine (SPD) uptake after SLC3A2 silencing with two different siRNAs (siKD‐1, siKD‐2) versus a scrambled control siRNA (scr‐ctrl). One sample t‐test was used to assess the significance of the changes in polyamine uptake versus untreated cells transfected with scr‐ctrl (100%) which is indicated by the asterisks on top of the bars. Comparisons between the uptake % in all difluoromethylornithine (DFMO)‐treated groups were made by one‐way ANOVA, and represented by asterisks above connecting lines between bars. All comparisons between DFMO‐treated groups were found to be non‐significant (ns). Graphs depict mean ± SEM of at least five independent biological replicates (n = 6 for SH‐SY5Y PUT untreated; n = 5 for SH‐SY5Y PUT DFMO; n = 7 for SH‐SY5Y SPD untreated; n = 5 for SH‐SY5Y SPD untreated; n = 10 for KELLY PUT untreated; n = 7 for KELLY PUT DFMO; n = 9 for KELLY SPD untreated; n = 6 for KELLY SPD DFMO). Statistical significance was defined as *P < 0.05, **P < 0.01, ***P < 0.001 or ns (non‐significant). DFMO, difluoromethylornithine.
Fig. 4
Fig. 4
ATP13A3 mediates polyamine uptake in neuroblastoma cells. (A) Western blot showing ATP13A3 protein levels in the SH‐SY5Y ATP13A3 wild type overexpression (ATP13A3 WT O.E.) or ATP13A3 D498N overexpression (ATP13A3 D498N O.E.) models versus the nontransduced (NTS) control. Representative blots from three independent biological replicates are shown. (B) Mass spectrometry‐based measurement of metabolites in the polyamine pathway of the SH‐SY5Y ATP13A3 cell models (putrescine, PUT; spermidine, SPD; spermine, SPM; acetylated spermidine, N1/8‐ac‐SPD; and acetylated spermine, N1‐ac‐SPM). One sample t‐test was used for statistical analysis. Graphs depict mean ± SEM of three independent biological replicates. (C) Cellular uptake of fluorescent BODIPY (BDP)‐conjugated PUT, SPD and SPM in SH‐SY5Y ATP13A3 cell models. One sample t‐test was used to determine the significance of the difference in uptake. Graphs depict mean ± SEM of at least three independent biological replicates (n = 4 for PUT and SPM, n = 3 for SPD). (D–F) Cell viability assay (MUH reagent) in SH‐SY5Y ATP13A3 overexpression cells exposed to toxic effects of exogenously added PUT, SPD and SPM. Two‐way ANOVA was used for statistical analysis. Graphs depict mean ± SEM of at least two independent biological replicates (PUT, n = 3; SPD, n = 3; SPM, n = 2). (G) Overexpression of (a) ATP13A3 WT in SH‐SY5Y cells leads to increased uptake of exogenous polyamines inducing cell toxicity. No toxicity is observed by overexpressing (b) ATP13A3 D498N, where the uptake of extracellular polyamines is driven solely by endogenously present polyamine transporters. Figure made using BioRender. (H) Western blot showing the successful overexpression of Flag‐tagged SLC3A2 and Firefly Luciferase (FLUC) O.E. in SH‐SY5Y cells. Presented immunoblots are representative of results obtained in three independently performed experiments. (I) Uptake of BDP‐conjugated polyamines in SH‐SY5Y cells overexpressing SLC3A2 versus ATP13A3 overexpressing cells. 1 mm of aminoguanidine was added to cell culture medium. Graphs depict mean ± SEM of at three independent biological replicates. One sample t‐test was used to assess the significance of the changes in polyamine uptake versus NTS cells (100%) which is indicated by the asterisks on top of the bars. Comparisons between the uptake % in all overexpression groups were made by one‐way ANOVA, and represented by asterisks above connecting lines between bars. Statistical significance was defined as *P < 0.05, **P < 0.01, ****P < 0.0001 or ns (non‐significant).
Fig. 5
Fig. 5
ATP13A3 knockdown reduces polyamine uptake in multiple neuroblastoma cell lines. (A) Reduced ATP13A3 protein (left) and mRNA (right) levels after siRNA‐mediated silencing in various neuroblastoma cell lines (48 h). One sample t‐test was used to assess the significance of silencing relative to scrambled control (scr‐ctrl) transduced cells. The depicted blot is representative for data obtained in at least two independently performed experiments (SH‐SY5Y, n = 4; KELLY, n = 3; BE(2)‐C, n = 2). mRNA levels were quantified and represented as mean ± SEM of at least three independent biological replicates (SH‐SY5Y, n = 5; KELLY, n = 4; BE(2)‐C, n = 3). (B) ATP13A3 siRNA‐mediated knockdown (KD) reduces 3H‐labeled putrescine (PUT) and spermidine (SPD) uptake in non‐MYCN amplified (SH‐SY5Y) and MYCN‐amplified (KELLY and BE(2)‐C) neuroblastoma cell lines. One sample t‐test was used to assess the significance of the decrease in uptake compared with scr‐ctrl cells. Graphs depict mean ± SEM of at least two independent experiments (SH‐SY5Y, n = 4; KELLY, n = 3; BE(2)‐C, n = 2). Statistical significance was defined as *P < 0.05, **P < 0.01, ***P < 0.001, ****P < 0.0001 or ns (non‐significant).
Fig. 6
Fig. 6
ATP13A3‐mediated polyamine uptake supports the growth of neuroblastoma cells. (A) Representative Western blots showing reduced ATP13A3 protein levels after siRNA‐mediated silencing of ATP13A3 in neuroblastoma cells (48 h). The depicted blot is representative for data obtained in at least two independently performed experiments. (B) Silencing of ATP13A3 decreases SH‐SY5Y and KELLY cell growth, as assessed by the IncuCyte live cell imaging system. Two‐way ANOVA was used for statistical analysis. Graphs depict mean ± SEM of three independent biological replicates. (C, D) AMXT 1501 treatment reduced neuroblastoma cell colony formation (C) and cell viability (after 72 h treatment) (D), in MYCN‐amplified (KELLY) and non‐MYCN‐amplified (SH‐SY5Y) neuroblastoma cell lines. Graphs depict mean ± SEM of three independent biological replicates. Statistical significance was defined as ****P < 0.0001 or ns (non‐significant).
Fig. 7
Fig. 7
ATP13A3 silencing impairs DFMO‐induced polyamine uptake and increases DFMO sensitivity in neuroblastoma cells. (A–D) Radiolabeled putrescine (PUT) (A, C) and spermidine (SPD) (B, D) uptake in SH‐SY5Y (A, B) and KELLY (C, D) cell lines with or without difluoromethylornithine (DFMO) treatment, and in response to siRNA‐mediated silencing of ATP13A3 (ATP13A3 siRNA knockdown 1 and 2; ATP13A3 siKD‐1 and siKD‐2) alone or in combination with SLC3A2 siRNA knockdown (SLC3A2 siKD) versus scrambled siRNA control (scr‐ctrl). One sample t‐tests were used to compare uptake efficiency relative to untreated cells transfected with scr‐ctrl (asterisks on the bar). One‐way ANOVA was used for other group comparisons (asterisks between bars). Graphs depict mean ± SEM of at least three independent biological replicates (n = 3 for SH‐SY5Y PUT, n = 3 for SH‐SY5Y SPD except n = 2 for untreated ATP13A3 siKD‐1 + SLC3A2 siKD‐1; n = 5 for KELLY PUT and KELLY SPD). (E, F) Silencing of ATP13A3 reduced cell growth of SH‐SY5Y (E) and KELLY (F) cells upon treatment with DFMO as determined with the IncuCyte live cell imaging system. Two‐way ANOVA was used to compare growth curves. Graphs depict mean ± SEM of three independent biological replicates for SH‐SY5Y and two independent biological replicates for KELLY. (G, H) ATP13A3 knockdown sensitizes SH‐SY5Y (G) and KELLY (H) cells to DFMO treatment as measured by colony formation assays. Two‐way ANOVA was used to compare dose–response curves between groups. Graphs depict mean ± SEM of three independent replicates for SH‐SY5Y, two independent experiments for KELLY. Statistical significance was defined as *P < 0.05, **P < 0.01, ***P < 0.001, ****P < 0.0001 or ns (non‐significant).
Fig. 8
Fig. 8
AMXT 1501 inhibits ATP13A3‐mediated polyamine uptake. (A) A fixed dose of AMXT 1501 enhanced the inhibitory effect of difluoromethylornithine (DFMO) on neuroblastoma colony formation of SH‐SY5Y and KELLY cells. Graphs depict mean ± SEM of three independent biological replicates. (B) SH‐SY5Y and KELLY cells were treated with increasing dose of DFMO and AMXT 1501 in a 6X6 format, and the synergy between these two drugs at different combination is visualized by Combenefit software, using Bliss synergy model, with blue color indicating strong synergy and red representing antagonism. The Synergy plot is generated from three independent biological replicates. (C) Cytotoxicity assay, using the 4‐methylumbelliferyl heptanoate (MUH) reagent to assess cell viability, showing the window of efficacy for AMXT 1501 in SH‐SY5Y cells overexpressing ATP13A3 wild type (WT O.E.). Graphs depict mean ± SEM of three independent biological replicates. Two‐way ANOVA was used to compare dose response curves of cells with or without PUT. (D–F) Overnight pre‐treatment of SH‐SY5Y cells overexpressing ATP13A3 WT with 1 μm AMXT 1501 protects them from toxic concentrations of putrescine (PUT) (D), spermidine (SPD) (E) and spermine (SPM) (F). Two‐way ANOVA was used to compare dose response curves in D‐F. Graphs depict mean ± SEM of three independent biological replicates. (G, H) Overnight pre‐treatment with 1 μm AMXT 1501 abolishes ATP13A3‐mediated PUT‐BDP (G) and SPD‐BDP (H) uptake in SH‐SY5Y cells overexpressing ATP13A3 WT as well as ATP13A3 D498N. One sample t‐test was used to compare mean uptake levels relative to untreated SH‐SY5Y cells overexpressing the ATP13A3 D498N. One‐way ANOVA was used to compare mean uptake levels for all other multiple comparisons. Graphs depict mean ± SEM of four independent biological replicates for PUT and three independent biological replicates for SPD. Experiments illustrated in figs E, F and H were performed in the presence of 1 mm aminoguanidine. Statistical significance was defined as *P < 0.05, **P < 0.01, ***P < 0.001, ****P < 0.0001 or ns (non‐significant).
Fig. 9
Fig. 9
MYCN expression and polyamine uptake in neuroblastoma cells. (A) mRNA expression (Transcripts Per Million, TPM) of polyamine transporters in the SEQC neuroblastoma database (n = 498; graph shows only n = 493 as 5 patients have unknown MYCN status). Graph represents the distribution of data density of ATP13A3 expression in neuroblastoma patients, with the central line representing the median, and the upper and lower lines indicating the third (Q3) and first (Q1) quartiles. Student's t‐test was used for statistical analysis. (B, C) ChIP‐seq tracks of ATP13A3 (B) and ODC1 (C) after pulldown with anti‐MYCN antibody in three MYCN‐amplified neuroblastoma cell lines, BE(2)‐C, KELLY, and NGP, and with anti‐c‐MYC antibody in NB69 neuroblastoma cells, with one replicate in each cell line. Statistical analysis of ChIP‐seq data was performed using MACS2 as described in method section. (D) Western blot assessing ATP13A3 and MYCN expression after 72 h of doxycycline treatment. Representative blots from three independent experiments. Graphs depict mean ± SEM of three independent replicates. One sample t‐test was used to assess the significance of the difference between ATP13A3 protein levels of MYCN cells and that of MYCN+ cells (100%) which is indicated by the asterisks on top of the bars. (E) Uptake of BODIPY (BDP)‐labeled polyamines (putrescine, PUT; spermidine, SPD; spermine, SPM) in Tet‐21/N cells with or without MYCN expression. One sample t‐test was used to compare uptake levels, measured by geometric mean fluorescence intensities (GeoMFI), relative to MYCN+ cells. Graphs depict mean ± SEM of at least five independent biological replicates (n = 5 for PUT; n = 6 for SPD and SPM). Statistical significance was defined as *P < 0.05, **P < 0.01, ***P < 0.001, ****P < 0.0001 or ns (non‐significant).
Fig. 10
Fig. 10
ATP13A3 as a novel therapeutic target for neuroblastoma. Targeting ATP13A3 either by (A) its silencing or (B) with AMXT 1501, in conjunction with difluoromethylornithine (DFMO), prevents DFMO‐induced compensatory polyamine uptake and inhibits the growth of neuroblastoma cells.

References

    1. Zafar A, Wang W, Liu G, Wang X, Xian W, McKeon F, et al. Molecular targeting therapies for neuroblastoma: progress and challenges. Med Res Rev. 2021;41(2):961–1021. 10.1002/med.21750 - DOI - PMC - PubMed
    1. Qiu B, Matthay KK. Advancing therapy for neuroblastoma. Nat Rev Clin Oncol. 2022;19(8):515–533. 10.1038/s41571-022-00643-z - DOI - PubMed
    1. Pinto NR, Applebaum MA, Volchenboum SL, Matthay KK, London WB, Ambros PF, et al. Advances in risk classification and treatment strategies for neuroblastoma. J Clin Oncol. 2015;33(27):3008–3017. 10.1200/JCO.2014.59.4648 - DOI - PMC - PubMed
    1. Casero RA, Murray Stewart T, Pegg AE. Polyamine metabolism and cancer: treatments, challenges and opportunities. Nat Rev Cancer. 2018;18(11):681–695. - PMC - PubMed
    1. Damiani E, Wallace HM. Polyamines and cancer. Methods Mol Biol. 2018;1694:469–488. 10.1007/978-1-4939-7398-9_39 - DOI - PubMed

MeSH terms