. 2025 Mar 7;24(3):1102-1117.
doi: 10.1021/acs.jproteome.4c00729. Epub 2025 Feb 21.

Multiomics Analysis of Liver Molecular Dysregulation Leading to Nonviral-Related Hepatocellular Carcinoma Development

Affiliations

Multiomics Analysis of Liver Molecular Dysregulation Leading to Nonviral-Related Hepatocellular Carcinoma Development

Hikaru Nakahara et al. J Proteome Res. .

Abstract

Chronic liver diseases exhibit diverse backgrounds, and it is believed that numerous factors contribute to progression to cancer. To achieve effective prevention of nonviral hepatocellular carcinoma, it is imperative to identify fundamental molecular abnormalities at the patient level. Utilizing cancer-adjacent liver tissues obtained from hepatocellular carcinoma patients (chronic liver disease), we conducted RNA-Seq and metabolome analyses. In the chronic liver disease cohort, upregulation of inflammation-associated signals was observed, concomitant with accumulation of acylcarnitine and fatty acid and depletion of NADP+, gamma-tocopherol, and dehydroisoandrosterone-3-sulfate-1 (DHEAS). To minimize heterogeneity, we performed multiomics clustering, successfully categorizing the chronic liver disease cases into two distinct subtypes. Subtype 1 demonstrated elevated inflammatory levels, whereas Subtype 2 included a disproportionately high proportion of elderly cases. Furthermore, RNA-Seq analysis revealed upregulation of inflammatory signals in Subtype 1, while both subtypes exhibited downregulation of fatty acid metabolism. Metabolome analysis indicated a tendency of increased acylcarnitine levels in Subtype 1 and augmented fatty acid accumulation in Subtype 2. Validation of differentially expressed genes using the Gene Expression Omnibus (GEO) data set revealed the potential for amelioration through supplementation with antioxidants such as epigallocatechin gallate (EGCG).

Keywords: MOVICS; NAD metabolism; NAFLD; acylcarnitine; fatty acid.


Conflict of interest statement

The authors declare no competing financial interest.

Figures

Figure 1
Figure 1
Statistical analysis of control vs CLD. (A) PCA plots using RNA-Seq data. (B) PCA plots using metabolomics data. (C) GSEA analysis comparing CLD and control groups; red represents a positive correlation while blue represents a negative correlation at FDR < 0.05. (D) Percentage of each type of metabolite with significant differences.
Figure 2
Figure 2
Comparison of metabolomes with different backgrounds. The patients were divided into two groups based on differences in clinical background, and a volcano plot was drawn. (A) High-age vs low-age divided by median. (B) With or without DM. (C) Fibrosis stage 1–2 vs 3–4 (F1–2 vs F3–4). (D) With or without HL.
Figure 3
Figure 3
Subtype classification of CLDs. (A) Clustering multiomics data with MOVICS. Clinical information, CLDS1 and CLDS2 classification, and transcriptome and metabolome expression data in 50 patients are shown. The transcriptome data includes the 1000 genes used for clustering, and the metabolome includes the expression levels of 402 metabolites. (B) Comparison of the distributions of inflammation stage between CLDS1 and CLDS2 by Fisher’s exact test. (C) Comparison of age between CLDS1 and CLDS2 by Wilcoxon test. (D) PCA plot with RNA-Seq colored by MOVICS clustering. (E) PCA plot with metabolome data colored by MOVICS clustering.
Figure 4
Figure 4
Differential analysis of genes and metabolites. (A) Venn diagram showing genes commonly up- or down-regulated in CLDS1 and CLDS2. (B) Heatmap of genes shown in (A). (C) Venn diagram showing metabolites commonly increased or decreased in CLDS1 and CLDS2. (D) Heatmap of metabolites shown in C.
Figure 5
Figure 5
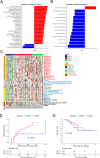
Characteristics of the two subtypes. (A) Pathways that were enriched in CLDS1 vs controls. (B) Pathways that were enriched in CLDS2 vs controls. The significance level is FDR < 0.05. (C) Heatmap of differential metabolites; red font: acylcarnitine, blue font; fatty acid, green font: phosphatidylcholine synthesis related metabolites, black font: others. (D) Kaplan–Meier recurrence-free survival comparison analysis of CLDS1 vs CLDS2. (E) Kaplan–Meier survival rate analysis of CLDS1 vs CLDS2.
Figure 6
Figure 6
Signal changes in animal models. (A) Heatmap of signal changes due to factors inducing liver injury. (B) Treatment effectiveness investigation in the GEO data set. In each data set, the left-hand panel compares the control and high-fat diet in the GSEA analysis. The right-hand panel compares groups fed a high-fat diet and a high-fat diet with the respective additions in the GSEA analysis. The vertical axis represents the NES; * indicates FDR < 0.25, ** FDR < 0.05. HFD: high-fat diet; HCHFD: high-cholesterol and high-fat diet; HCHCHFD: high-cholesterol, high-cholate, and high-fat diet; HFHSD, high-fat, high-sugar diet.

References

    1. Sung H.; Ferlay J.; Siegel R. L.; Laversanne M.; Soerjomataram I.; Jemal A.; Bray F. Global Cancer Statistics 2020: GLOBOCAN Estimates of Incidence and Mortality Worldwide for 36 Cancers in 185 Countries. Ca-Cancer J. Clin. 2021, 71 (3), 209–249. 10.3322/caac.21660. - DOI - PubMed
    1. Nagaoki Y.; Hyogo H.; Ando Y.; Kosaka Y.; Uchikawa S.; Nishida Y.; Teraoka Y.; Morio K.; Fujino H.; Ono A. Increasing incidence of non-HBV- and non-HCV-related hepatocellular carcinoma: Single-institution 20-year study. BMC Gastroenterol. 2021, 21 (1), 306.10.1186/s12876-021-01884-5. - DOI - PMC - PubMed
    1. Tateishi R.; Koike K. Changing etiology of hepatocellular carcinoma. J. Gastroenterol. 2020, 55 (1), 125–126. 10.1007/s00535-019-01622-5. - DOI - PubMed
    1. Tokushige K.; Hashimoto E.; Horie Y.; Taniai M.; Higuchi S. Hepatocellular carcinoma in Japanese patients with nonalcoholic fatty liver disease, alcoholic liver disease, and chronic liver disease of unknown etiology: Report of the nationwide survey. J. Gastroenterol. 2011, 46 (10), 1230–1237. 10.1007/s00535-011-0431-9. - DOI - PubMed
    1. Enomoto H.; Ueno Y.; Hiasa Y.; Nishikawa H.; Hige S.; Takikawa Y.; Taniai M.; Ishikawa T.; Yasui K.; Takaki A. The transition in the etiologies of hepatocellular carcinoma-complicated liver cirrhosis in a nationwide survey of Japan. J. Gastroenterol. 2021, 56 (2), 158–167. 10.1007/s00535-020-01748-x. - DOI - PMC - PubMed

MeSH terms