Kidney cell response to acute cardiorenal and isolated kidney ischemia-reperfusion injury
- PMID: 39982410
- PMCID: PMC12191245
- DOI: 10.1152/physiolgenomics.00161.2024
Kidney cell response to acute cardiorenal and isolated kidney ischemia-reperfusion injury
Abstract
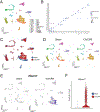
Acute cardiorenal syndrome (CRS) represents a critical intersection of cardiac and renal dysfunction with profound clinical implications. Despite its significance, the molecular underpinnings that mediate cellular responses within the kidney during CRS remain inadequately understood. We used single nucleus RNA sequencing (snRNAseq) to dissect the cellular transcriptomic landscape of the kidney following a translational model of CRS, cardiac arrest/cardiopulmonary resuscitation (CA/CPR) in comparison to ischemia-reperfusion injury (IRI). In each dataset, we found that proximal tubule (PT) cells of the kidney undergo significant gene expression changes, with decreased expression of genes critically important for cell identity and function, indicative of dedifferentiation. Based on this, we created a novel score to capture the dedifferentiation state of each kidney cell population and found that certain epithelial cell populations, such as the PT S1 and S2 segments, as well as the distal convoluted tubule, exhibited significant dedifferentiation response. Interestingly, the dedifferentiation response in the distal nephron differed in magnitude between IRI and CA/CPR. Gene set enrichment analysis (GSEA) of PT response to IRI and CA/CPR revealed similarities between the two models and key differences, including enrichment of immune system process genes. Transcriptional changes in both mouse models of acute kidney injury (AKI) highly correlated with a dataset of human biopsies from patients diagnosed with AKI. This comprehensive single-nucleus transcriptomic profiling provides valuable insights into the cellular mechanisms driving CRS.NEW & NOTEWORTHY Cardiac dysfunction is a common cause of acute kidney injury in a malady called acute cardiorenal syndrome. In a mouse model of acute cardiorenal syndrome called cardiac arrest/cardiopulmonary resuscitation, we characterized, for the first time, the kidney transcriptional landscape at the single-cell level. We developed a novel method for quantifying cell response to injury and found that cells adapted through dedifferentiation, the magnitude of which varied depending on cell type.
Keywords: acute cardiorenal syndrome; acute kidney injury; ischemia-reperfusion; single nucleus RNA sequencing; transcriptomics.
Figures


References
-
- Ashton CM, Bozkurt B, Colucci WB, Kiefe CI, Mann DL, Massie BM, Slawsky MT, Tierney WM, West JA, Whellan DJ, and Wray NP. Veterans Affairs Quality Enhancement Research Initiative in chronic heart failure. Med Care 38: I26–37, 2000. - PubMed
-
- Ronco C, McCullough PA, Anker SD, Anand I, Aspromonte N, Bagshaw SM, Bellomo R, Berl T, Bobek I, Cruz DN, Daliento L, Davenport A, Haapio M, Hillege H, House A, Katz NM, Maisel A, Mankad S, Zanco P, Mebazaa A, Palazzuoli A, Ronco F, Shaw A, Sheinfeld G, Soni S, Vescovo G, Zamperetti N, and Ponikowski P. Cardiorenal syndromes: an executive summary from the consensus conference of the Acute Dialysis Quality Initiative (ADQI). Contrib Nephrol 165: 54–67, 2010. - PubMed
-
- Ronco C, McCullough PA, Anker SD, Anand I, Aspromonte N, Bagshaw SM, Bellomo R, Berl T, Bobek I, Cruz DN, Daliento L, Davenport A, Haapio M, Hillege H, House A, Katz NM, Maisel A, Mankad S, Zanco P, Mebazaa A, Palazzuoli A, Ronco F, Shaw A, Sheinfeld G, Soni S, Vescovo G, Zamperetti N, Ponikowski P, and Group AC. Cardiorenal syndromes: an executive summary from the consensus conference of the Acute Dialysis Quality Initiative (ADQI). Contrib Nephrol 165: 54–67, 2010. - PubMed
MeSH terms
Grants and funding
- 20CDA35320169/American Heart Association (AHA)
- I01BX004288/U.S. Department of Veterans Affairs (VA)
- KL2 TR002370/TR/NCATS NIH HHS/United States
- TL1TR002371/HHS | NIH | National Center for Advancing Translational Sciences (NCATS)
- K01 DK121737/DK/NIDDK NIH HHS/United States
- K01DK121737/HHS | NIH | National Institute of Diabetes and Digestive and Kidney Diseases (NIDDK)
- I01 BX004288/BX/BLRD VA/United States
- 24CDA1269598/American Heart Association (AHA)
- R01 DK098382/DK/NIDDK NIH HHS/United States
- TL1 TR002371/TR/NCATS NIH HHS/United States
- KL2TR002370/HHS | NIH | National Center for Advancing Translational Sciences (NCATS)
- W81XWH2010196/PR191304/U.S. Department of Defense (DOD)
- Collins Medical Trust (CMT)
LinkOut - more resources
Full Text Sources

