. 2025 Feb 21;41(1):49.
doi: 10.1007/s10565-025-10003-z.

Spatio-temporal transcriptomic analysis reveals distinct nephrotoxicity, DNA damage, and regeneration response after cisplatin

Affiliations

Spatio-temporal transcriptomic analysis reveals distinct nephrotoxicity, DNA damage, and regeneration response after cisplatin

Lukas S Wijaya et al. Cell Biol Toxicol. .

Abstract

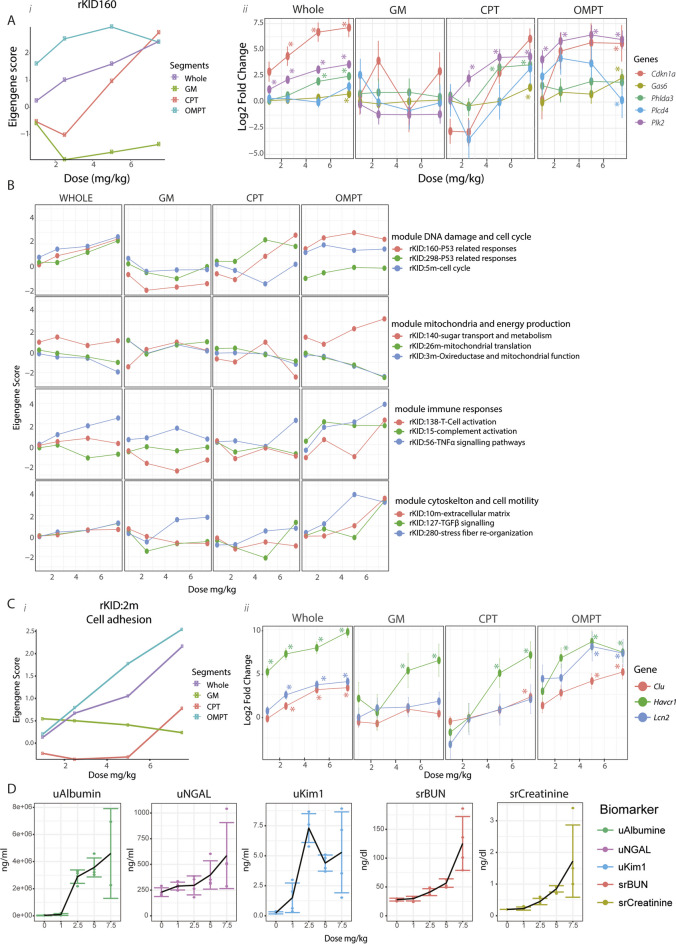
Nephrotoxicity caused by drug or chemical exposure involves complex mechanisms as well as a temporal integration of injury and repair responses in different nephron segments. Distinct cellular transcriptional programs regulate the time-dependent tissue injury and regeneration responses. Whole kidney transcriptome analysis cannot dissect the complex spatio-temporal injury and regeneration responses in the different nephron segments. Here, we used laser capture microdissection of formalin-fixed paraffin embedded sections followed by whole genome targeted RNA-sequencing-TempO-Seq and co-expression gene-network (module) analysis to determine the spatial-temporal responses in rat kidney glomeruli (GM), cortical proximal tubules (CPT) and outer-medulla proximal tubules (OMPT) comparison with whole kidney, after a single dose of the nephrotoxicant cisplatin. We demonstrate that cisplatin induced early onset of DNA damage in both CPT and OMPT, but not GM. Sustained DNA damage response was strongest in OMPT coinciding with OMPT specific inflammatory signaling, actin cytoskeletal remodeling and increased glycolytic metabolism with suppression of mitochondrial activity. Later responses reflected regeneration-related cell cycle pathway activation and ribosomal biogenesis in the injured OMPT regions. Activation of modules containing kidney injury biomarkers was strongest in OMPT, with OMPT Clu expression highly correlating with urinary clusterin biomarker measurements compared the correlation of Kim1. Our findings also showed that whole kidney responses were less sensitive than OMPT. In conclusion, our LCM-TempO-Seq method reveals a detailed spatial mechanistic understanding of renal injury/regeneration after nephrotoxicant exposure and identifies the most representative mechanism-based nephron segment specific renal injury biomarkers.

Keywords: Cisplatin; Nephrons; Nephrotoxicity; Spatial; Temporal; Transcriptomics.


Conflict of interest statement

Declarations. Ethical approval: Both animal dosing studies were performed at AbbVie Deutschland GmbH & Co. KG (Knollstrasse, 67061 Ludwigshafen, Germany) in accordance with the German Federal Animal Welfare Act.​ Conflict of interest: M.E.C, currently employed at Regeneron Pharmaceuticals Inc, contributed to this article as an employee of Abbvie and the views expressed do not necessarily represent the views of Regeneron Pharmaceuticals Inc. P.T, currently employed at Sanofi, contributed to this article as an employee of Abbvie and the views expressed do not necessarily represent the views of Sanofi.

Figures

Fig. 1
Fig. 1
Transcriptomics analysis of nephron segments reveals coherent cell type specific signature. A Overview of the 3 days dose response in vivo experiment during which blood and urines were samples (i). After sacrifice, tissue samples of specific regions were collected with laser capture microdissection (LCM) technology from FFPE embedded kidneys. This figure was created with BioRender.com. Schematic overview of the microdissection of the kidneys showing the selection of GM and CPT in the cortical region and OMPT in the outer-medullary region (ii). B PCA plots of each individual collected samples made from gene expression values (Whole kidney, GM, CPT, and OMPT) displayed both PC2 and PC3. C Heatmap showing the gene expression profiles of all tissue samples from top 10 highest expression of specific marker genes for particular nephron segments (Park et al. 2018). The sample clustering was performed using ‘Ward D2’ algorithm. The color on the annotation bar indicates the group of the marker genes expressed in the specific nephron segments that was extracted from the previous study (Park et al. 2018). The color scale of the heatmap indicates the log2 normalized count of each gene. D Gene expression value of specific nephron region markers (Kcjn1: distal tubule, cldn8: loop of henley, Slc8a1: collecting duct, Nphs1: podocyte/glomerulus, Slc5a2: proximal tubule s1 and s2, Slc22a2: proximal tubule s3). Sample types are depicted with the colors of the plots
Fig. 2
Fig. 2
Dose response effects of spatially-anchored transcriptional changes induced by cisplatin. A Numbers of Differentially expressed genes of each sample types (whole kidney, glomerulus, CPT, and OMPT – threshold: adj p-val < 0.05, log2 fold change > [2]). Red bars indicate upregulation of the genes and blue bars indicate downregulation of the genes. B Numbers of significantly de(activated) modules of each sample types (whole kidney, glomerulus, CPT, and OMPT – thresholds: gene memberships > 7, module coverage > 50%, and EGs >|2|). Red bars indicate activated modules and blue bars indicate repressed modules. C Heatmap showing an overview of the kidney TGX-Mapr module (n = 4) activities. The dose bar indicates the cisplatin dose and the segment bar indicates the sample type. Each block in the heatmap represents a response of a module in a particular sample type at the specific dose. The color of the heatmap indicates the magnitude of the module responses (eigengene scores; red: activation, blue: deactivation). Inset 1a and b contain the modules highly modulated in GM and inset 2 contains the modules highly modulated in OMPT. D Platinum (Pt 195) content measured in kidney tissue with ICP-MS. The color of the boxplot represents the cisplatin dose with each dot representing the value of each sample in the same condition (biological replicates). E Toxicogenomics maps of whole kidneys and OMPTs for dose cisplatin 7.5 mg/kg (left). Each circle on the map represents one module (highlighted: rKID:160-DNA damage module), color and the size of the circle indicate the magnitude of the response modulation (red: activation, blue: deactivation). Detailed overview of module WGCNA |Kidney:160 membership (right). Color and the size of the nodes indicate the magnitude of the response modulation (red: activation, blue: deactivation), the square node is the hub gene of the module (ii). F Dose response trend of rKID:29-transcription factors module activity (eigengene score) in each nephron region and whole kidneys. The color of the plot represents the sample type (i). The dose response plots of 3 highest correlated gene members of rKID:29 in each sample type. The color of the plots show the expression of gene memberships (error bars represent SEM). The stars represent the significant log2 fold change values (adj p-val < 0.05) (ii)
Fig. 3
Fig. 3
Dose response activation of cellular responses elicited in different nephron segments. A Dose response trend of rKID:160-DNA damage module activity (eigengene score) in each nephron region and whole kidneys. The color of the plot represents the sample type (i). The dose response plots of 5 highest expressed gene members of rKID:160 in each sample type. The color of the plots show the expression of gene memberships (error bars represent SEM). The stars represent the significant log2 fold change values (adj p-val < 0.05) (ii). B Cellular responses elicited in the nephron segments. The responses are grouped into 4 different injury responses of cisplatin: DNA damage (i), mitochondrial function (ii), cytoskeletal (iii), and immune responses (iv). Each response is represented by 3 different modules. The color of the plot represents the activity of each module. C The dose–response plot of rKID:2m-Biomarker module upon cisplatin exposure. The color of the plots represents the response of each segment (i). Dose–response plots of the gene expression level of 3 kidney biomarkers from rKID:2m (Clusterin, KIM1, Lcn2). The error bars display the SEM. The stars represent the significant log2 fold change values (adj p-val < 0.05) (ii). D Serum and urinary biomarkers upon cisplatin exposure measured after 72 h (u—urine, sr—serum). Error bars indicate SD
Fig. 4
Fig. 4
Temporal cisplatin transcriptional responses in whole kidney, CPT and OMPT. A Overview of the time dynamic experiment and sample collection timeline. Red tubes indicate blood collection, yellow jars indicate urine collection, and FFPE block indicate kidney collection. This figure was created with BioRender.com. B The number of differentially expressed genes (DEGs) of whole kidneys, CPT, and OMPT at each specific time points – threshold: adj p-val < 0.05, log2 fold change > [2]). Red bars indicate the number of upregulated genes and blue bars indicate downregulated genes (i). Numbers of significantly de(activated)modules of each sample types (whole kidney, CPT, and OMPT – thresholds: gene memberships > 7, module coverage > 50%, and EGs >|2|). Red bars indicate activated modules and blue bars indicate repressed modules (ii). C Heatmap showing the overview of the temporal dynamics of the module activity. The time legend indicates the duration of cisplatin exposure, and the segment legend indicates the nephron regions. Each block in the heatmap represents a response to a module in a particular sample type at a specific time point. The color of the heatmap indicates the magnitude of the module responses (eigengene scores; red: activation, blue: deactivation). D The plots of platinum (Pt 195) content measured in plasma (top, panel i) and whole kidney tissue (bottom, panel ii). The color of the plot represents the administered dose: 0 mg/kg (red) and 5 mg/kg (blue) and the shadow of the plot represents the standard deviation values. The inset box plots indicate the detailed overview of the Pt content at the early time points (0–4 h – plasma and 1–72 h – whole kidney). The error bar represents the SD, the shapes indicate the replicates
Fig. 5
Fig. 5
Assessment of the temporal cisplatin-induced DNA damage response in CPT and OMPT. A Toxicogenomics maps of cellular responses of the whole kidney, CPT, and OMPT assessed at day 5 of exposure. Each node on the map represents one module (highlighted: rKID:160-DNA damage)—left. Modulation of rKID:160 memberships in the whole kidney, CPT, and OMPT samples on day 5 after cisplatin exposure. The color and the size of the node indicate the activity of the responses (red: activation, blue: deactivation), the square node is the hub gene of the module—right. B Temporal dynamic plots of rKID:160 – DNA damage in the whole kidney (blue), CPT (red), and OMPT (green) (i). The time dynamic plots of 5 highest upregulated (in OMPT) module memberships of rKID:160-DNA damage in each sample type (ii). The color of the plots indicates the expression of gene memberships (error bars represent SEM). The stars represent the significant log2 fold change values (adj p-val < 0.05). C Nuclear staining of phosphorylated P53 protein—serine 15 in the cortex (left) and outer-medulla (right) – 60 × magnification (i). The quantification of p53-pS15 positive nuclei in the cortex (red) and outer-medulla area (green) (ii). The error bar indicates the standard deviation values. Each dot in the plot shows the value of replicate. The stars indicate the p-value derived from independent student t-test indicating the significant comparison between cortex and outer-medulla regions (* p-val < 0.05 – 0,01, ** p-val < 0.01 – 0.001, p-val *** < 0.001) (ii)
Fig. 6
Fig. 6
Comparative analysis of the temporal progressive cisplatin renal injury response in CPT and OMPT. Temporal dynamics of the modules annotated with various cellular responses (rKID:56 – inflammation [representing gene: Icam1], rKID:127 – TGFβ signalling [representing gene: Tgfbr2], rKID:3m – oxireductase and mitochondrial function [representing gene: Mpc2], rKID:140 – sugar transport and metabolism [representing gene: Pfkp]) (blue) compared with the dynamic of rKID:160-DNA damage (red). The representing genes indicate strongly modulated gene memberships with the functions associated to the module annotation. The stars represent the significant log2 fold change values (adj p-val < 0.05)
Fig. 7
Fig. 7
Temporal regenerative responses elicited in CPT and OMPT after cisplatin treatment. A Temporal dynamics of rKID:5m-Cell cycle (i), rKID:10m-epithelial-mesenchymal transition (ii) and, rKID:29-transcription factors – inset: the plot from 0–24 h (iii) in each sample type. B Nuclear staining of Ki67 in cortex (top) and outer-medulla (bottom) regions – 60 × magnification (i). Quantification of Ki67 positive nuclei in the cortex (red) and outer-medulla area (green) (ii). The error bars indicate the standard deviation values. Each dot in the plot shows the value of each replicate. The stars indicate the p-values derived from independent student t-test indicate the significant comparison between cortex and outer-medulla regions (* p-val < 0.05 – 0,01, ** p-val < 0.01 – 0.001, p-val *** < 0.001). C Immunohistochemistry staining of vimentin in the cortical (left) and outer-medulla (right) areas 40 × magnification
Fig. 8
Fig. 8
Temporal expression of kidney injury biomarkers upon cisplatin exposure. A Temporal dynamic plots of rKID:2m – Kidney injury biomarkers in the whole kidney (blue), CPT (red), and OMPT (green) – (i). Time dynamic plots of Havcr1 (ii) and Clu (iii) two kidney biomarker genes in each sample type (error bars represent SEM)—right. The stars represent the significant log2 fold change values (adj p-val < 0.05). B Immunohistochemistry staining of KIM1 and in the cortical (upper) and outer-medulla (lower) region – 40 × magnification. C Immunohistochemistry staining of clusterin and in the cortical (upper) and outer-medulla (lower) region – 40 × magnification. D Temporal dynamics of urine KIM1 and clusterin (i) as mechanistic biomarkers and serum creatinine and BUN (ii) as functional biomarkers. Red plot represents the baseline measurement with error bars indicate standard deviation values. E Correlation plots between urine clusterin with Clu expression in OMPT (top-left), urine KIM1 with Havcr1 expression in OMPT (top-right), urine clusterin with Clu expression in the whole kidneys (bottom-left), urine KIM1 with Havcr1 expression in the whole kidneys (bottom-right)
Fig. 9
Fig. 9
Schematic overview of cisplatin-induced key cellular responses elicited in the different segments of the rat kidneys. The difference in activation pattern of cellular responses is highlighted in whole kidney, CPT, and OMPT. This figure was created with BioRender.com

References

    1. Ahmed EA, Agay D, Schrock G, Drouet M, Meineke V, Scherthan H. Persistent DNA damage after high dose in vivo Gamma exposure of Minipig skin. PLoS ONE. 2012;7(6):e39521. 10.1371/journal.pone.0039521. - PMC - PubMed
    1. Benedetti G, Fredriksson L, Herpers B, Meerman J, van de Water B, de Graauw M. TNF- a -mediated NF- k B survival signaling impairment by cisplatin enhances JNK activation allowing synergistic apoptosis of renal proximal tubular cells. Biochem Pharmacol. 2013;85(2):274–86. 10.1016/j.bcp.2012.10.012. - PubMed
    1. Blair BG, Larson C, Safaei R, Howell SB. Copper transporter 2 regulates the cellular accumulation and cytotoxicity of cisplatin and carboplatin. Clin Cancer Res. 2009;15(13):4312–21. 10.1158/1078-0432.CCR-09-0311. - PMC - PubMed
    1. Bonventre JV, Vaidya VS, Schmouder R, Feig P, Dieterle F. Next-generation biomarkers for detecting kidney toxicity. Nat Biotechnol [internet ]. 2010;28(5):436–40. 10.1038/nbt0510-436. - PMC - PubMed
    1. Bruijn LE, van den Akker BEWM, van Rhijn CM, Hamming JF, Lindeman JHN. Extreme diversity of the human vascular mesenchymal cell landscape. J Am Heart Assoc. 2020;9(23):e017094. 10.1161/JAHA.120.017094. - PMC - PubMed

LinkOut - more resources