. 2025 Feb 21;75(1):26.
doi: 10.1007/s12031-025-02321-y.

SOX10-Mediated Regulation of Enteric Glial Phenotype in vitro and its Relevance for Neuroinflammatory Disorders

Affiliations

SOX10-Mediated Regulation of Enteric Glial Phenotype in vitro and its Relevance for Neuroinflammatory Disorders

Madlen Kunke et al. J Mol Neurosci. .

Abstract

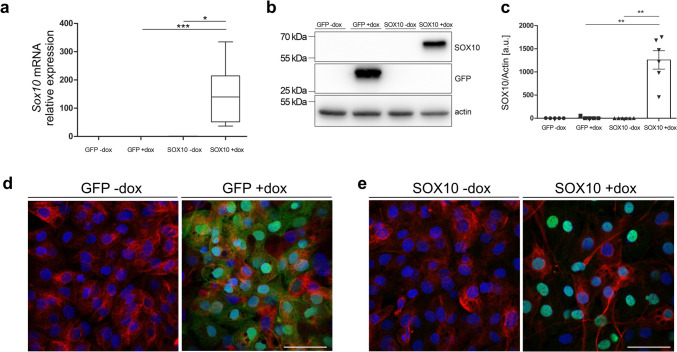
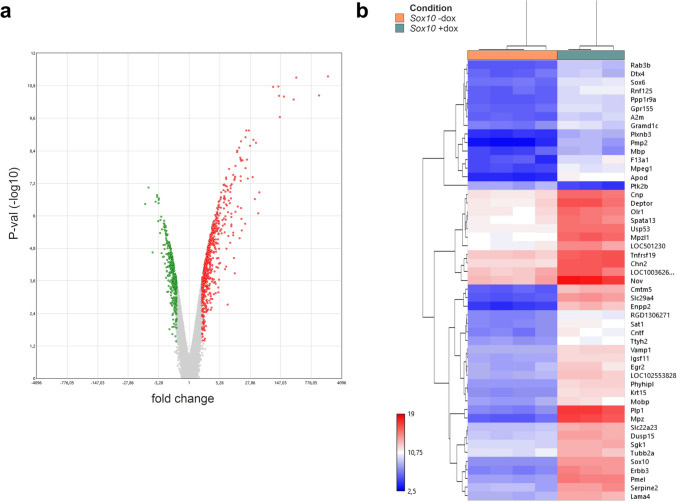
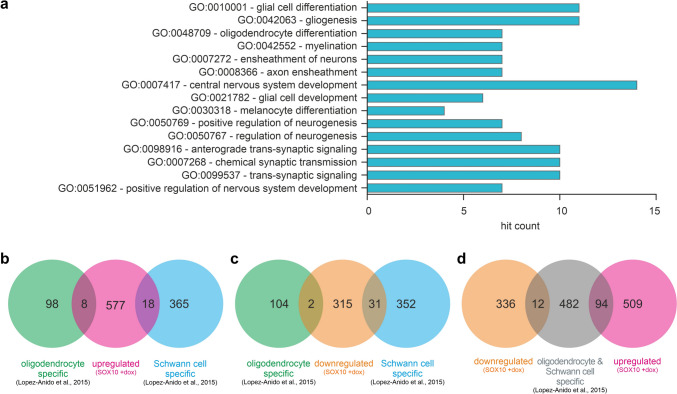
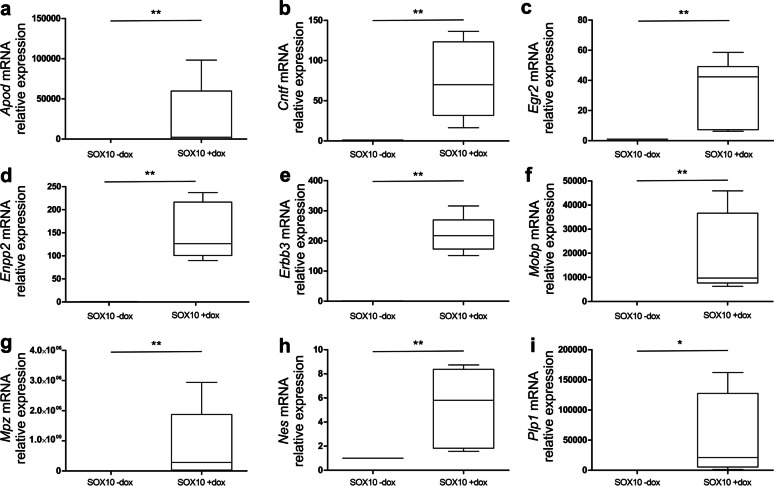
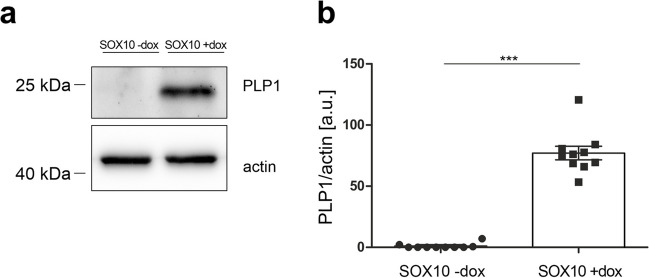
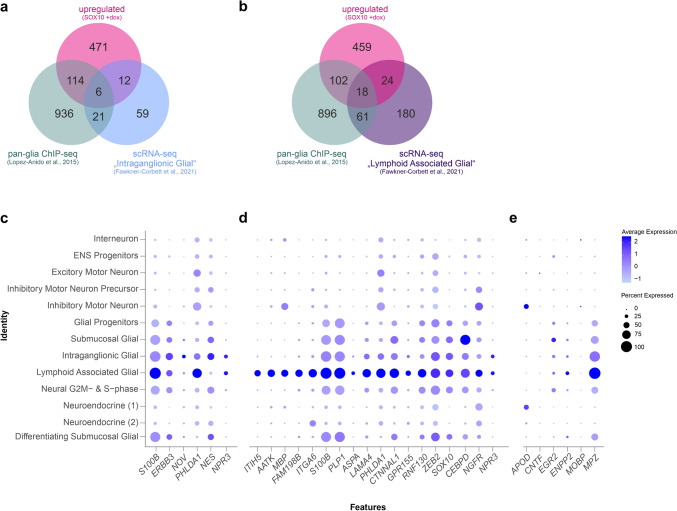
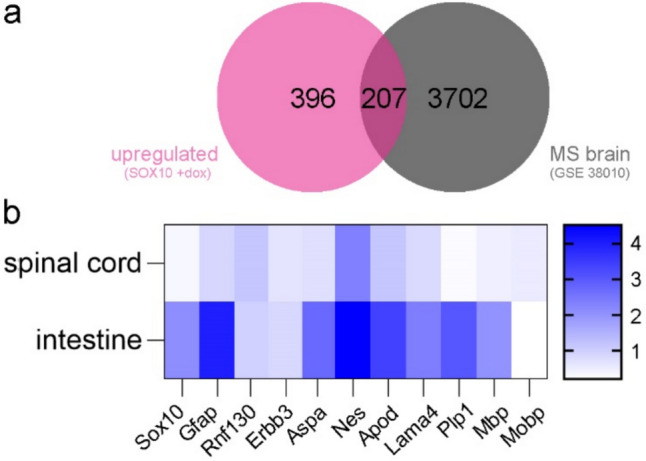
The transcription factor SOX10 is a key regulator of myelinated glial cell phenotype and function, with a known role in multiple sclerosis (MS). SOX10 is also expressed in enteric glial cells (EGC) within the gut, yet its regulatory functions in EGC remain poorly understood. This study aimed to identify SOX10 target genes that influence EGC phenotype and may have implications for MS. An EGC cell line was established for doxycycline-inducible SOX10 overexpression. Impact of SOX10 overexpression on EGC phenotype was assessed by genome-wide expression analysis and results were validated via RT-qPCR and western blot. Data were compared with SOX10 ChIP-seq and transcriptomic datasets from MS patients to identify pan-glial SOX10 target genes potentially linked to neuroinflammatory disorders. SOX10 overexpression was associated with ectopic upregulation of genes related to myelin regulation and glial differentiation, as evidenced by increased PLP1 expression at mRNA and protein levels. Comparison to ChIP-seq and MS datasets highlight SOX10 target genes, including PLP1, RNF130, NES and APOD potentially involved in central and peripheral manifestations of MS pathology. Our findings support a cell-specific regulation of EGC phenotype through SOX10 expression level and identify SOX10-regulated genes relevant to EGC function. This research advances the understanding of EGC diversity and provide information about glial cells targeting in neuroinflammatory disorders.

Keywords: Enteric glial cells; Multiple sclerosis; Nestin; Neuroinflammation; PLP1; Schwann cell; Sox10.


Conflict of interest statement

Declarations. Conflict of Interest: The authors declare no competing interests.

Figures

Fig. 1
Fig. 1
JUG2 cells after treatment with doxycycline (+ dox) showing overexpression of GFP (fluorescence control) and SOX10. a RT-qPCR. n = 3–8; *p ≤ 0.05, ***p ≤ 0.01 (Kruskal–Wallis test followed by Dunn's post-test). b, c Representative western blot of GFP, SOX10 and actin (loading control, b) and densitometrical analysis of SOX10 expression levels. n = 5–6; **p ≤ 0.01 (Kruskal–Wallis test followed by Dunn's post-test, c). d, e Representative confocal images of GFP (green, d) and of immunohistochemical stained SOX10 (green, e), nestin (red) and nuclei (blue). Scale bar = 50 µm
Fig. 2
Fig. 2
Impact of SOX10 overexpression on the transcriptome of JUG2 cells. a Volcano plots showing the differential gene expression between control and SOX10 overexpression. Red and green dots represent significant upregulated and downregulated genes, respectively (n = 3–4, fold change >  ± 2 and FDR-p-value < 0.05). b Hierarchical clustering of the main differentially expressed genes (fold change >  ± 10) between SOX10 -dox (control) and SOX10 overexpressing JUG2 cells
Fig. 3
Fig. 3
a Gene ontology (GO) analysis of SOX10 overexpressing JUG2 cells. JUG2 cells were incubated with doxycycline to induce SOX10 gene expression. Top 15 GO-molecular pathways fold enrichment of biological processes in doxycycline-treated SOX10 overexpressing JUG2 cells in comparison to control, based on differentially expressed genes (≥ 10-fold change). *FDR-p-value < 0.05. b, c Venn diagram representing the number of upregulated (b, pink) and downregulated (c, orange) DEG in SOX10-overexpressing JUG2 cells vs. oligodendrocyte-specific (green) and Schwann cell-specific (blue) SOX10 target genes, as determined by ChIP-seq analysis (Lopez-Anido et al. 2015). d Venn diagram representing the number of upregulated genes (pink) and downregulated (orange) DEG in SOX10-overexpressing JUG2 cells vs. SOX10 target genes common to oligodendrocytes and Schwann cells (grey), as determined by ChIP-seq analysis (Lopez-Anido et al. 2015)
Fig. 4
Fig. 4
Impact of SOX10 overexpression on expression of selected genes in JUG2 cells. mRNA expression of Apod (a), Cntf (b), Egr2 (c), Enpp2 (d), Erbb3 (e), Mobp (f), Mpz (g), Nes (h) and Plp1 (i) was determined by RT-qPCR (n = 4–6). Data were normalized to SOX10 -dox. *p ≤ 0.05, **p ≤ 0.01 in comparison to SOX10 -dox (Mann–Whitney U test)
Fig. 5
Fig. 5
SOX10 overexpression leads to increased PLP1 levels in JUG2 cells. a Representative western blot of PLP1 and actin (loading control) and b densitometrical analysis of PLP1 expression levels. n = 10, ***p ≤ 0.001 (Mann–Whitney U test)
Fig. 6
Fig. 6
a Venn diagram representing the overlap between upregulated SOX10 DEG, glia-associated ChIP-seq-validated SOX10 target genes (Lopez-Anido et al. 2015), and enriched genes present in the “intraganglionic glial” cluster, as determined by scRNA-seq analysis (Fawkner-Corbett et al. 2021). b Venn diagram representing the overlap between upregulated SOX10 DEG, ChIP-seq validated SOX10 target genes (Lopez-Anido et al. 2015) and enriched genes present in the “lymphoid associated glial” cluster, as determined by scRNA-seq analysis (Fawkner-Corbett et al. 2021). ce Dotplot showing the expression of overlapping SOX10 target genes of the “intraganglionic glial” cluster (c) and the “lymphoid associated” cluster (d) – as determined in (a) and (b) respectively – in cell clusters of the human ENS. Expression of selected additional SOX10 genes of interest is further shown (e). Expression data were obtained from published scRNA-seq analysis (Fawkner-Corbett et al. 2021)
Fig. 7
Fig. 7
a Venn diagram representing the overlap between upregulated DEG induced by SOX10 overexpression in JUG2 cells and upregulated DEG in active plaques within the brain of MS patients (GSE38010)(Han et al. 2012). b Heatmap showing fold change in gene expression of selected SOX10 target genes in the colon tissue (n = 2–4 per group) and spinal cord (n = 4 per group) of EAE mice compared to wild-type mice as determined by RT-qPCR

Similar articles

References

    1. Ahmadzai MM, McClain JL, Dharshika C, et al (2022) LPAR1 regulates enteric nervous system function through glial signaling and contributes to chronic intestinal pseudo-obstruction. J Clin Invest 132:. 10.1172/JCI149464 - PMC - PubMed
    1. Bach-Ngohou K, Mahé MM, Aubert P et al (2010) Enteric glia modulate epithelial cell proliferation and differentiation through 15-deoxy-12,14-prostaglandin J2. J Physiol 588:2533–2544. 10.1113/jphysiol.2010.188409 - PMC - PubMed
    1. Baghdadi MB, Ayyaz A, Coquenlorge S et al (2022) Enteric glial cell heterogeneity regulates intestinal stem cell niches. Cell Stem Cell 29:86-100.e6. 10.1016/j.stem.2021.10.004 - PubMed
    1. Baidoo N, Sanger GJ, Belai A (2023) Effect of old age on the subpopulations of enteric glial cells in human descending colon. Glia 71:305–316. 10.1002/glia.24272 - PMC - PubMed
    1. Barrenschee M, Lange C, Cossais F et al (2015) Expression and function of Neuregulin 1 and its signaling system ERBB2/3 in the enteric nervous system. Front Cell Neurosci 9:360. 10.3389/fncel.2015.00360 - PMC - PubMed

MeSH terms

Substances

LinkOut - more resources