. 2025 Feb 25;122(8):e2416412122.
doi: 10.1073/pnas.2416412122. Epub 2025 Feb 21.

Identification of AK4 and RHOC as potential oncogenes addicted by adult T cell leukemia

Affiliations

Identification of AK4 and RHOC as potential oncogenes addicted by adult T cell leukemia

Benquan Liu et al. Proc Natl Acad Sci U S A. .

Abstract

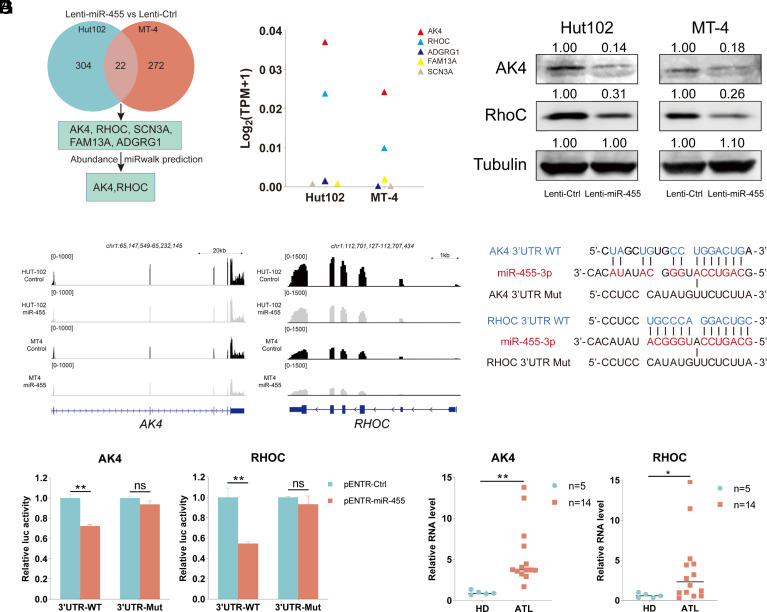
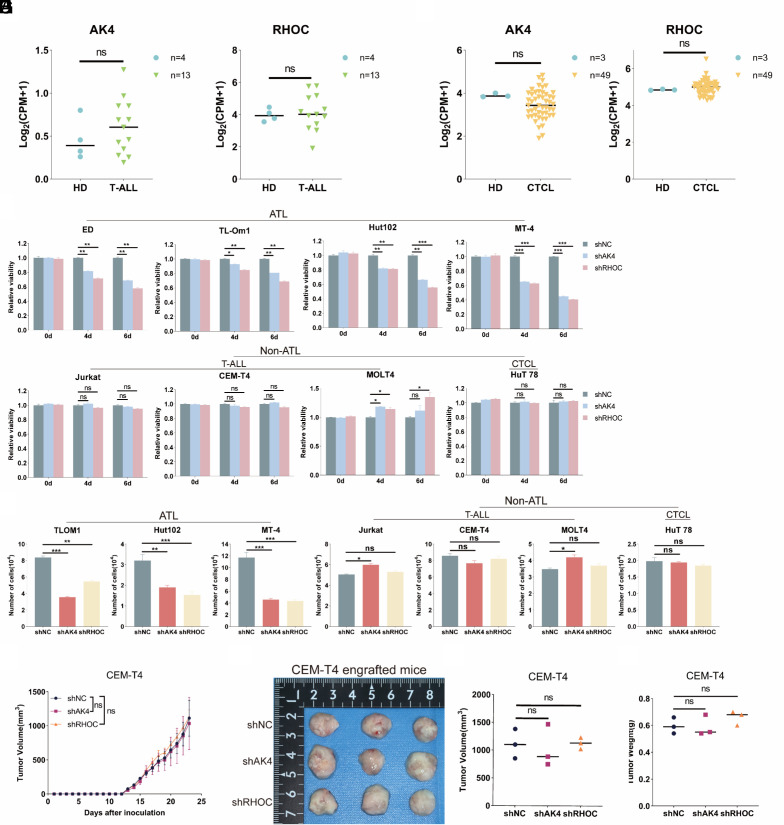
Adult T cell leukemia (ATL) is a highly aggressive T cell malignancy characterized by human T cell leukemia virus type 1 (HTLV-1) infection. ATL has a very poor prognosis and lacks satisfactory treatments; therefore, it is critical to identify potential targets in ATL cells in order to develop effective targeted therapeutics. Here, we report the identification of two oncogenes, AK4 and RHOC, as target genes of miR-455-3p, a tumor-suppressive microRNA in ATL patients. Importantly, AK4 and RHOC are highly expressed in ATL and exhibit oncogenic potentials in vitro and in vivo. Interestingly, transcriptome and metabolome analyses reveal a functional overlap of AK4 and RHOC, including activating oncogenic pathways such as Myc targets and deregulating lipid metabolism such as enhancing the production of sphingomyelin, a tumor-promoting lipid. In particular, compared to other types of T cell malignancy such as T cell acute lymphoblastic leukemia (T-ALL) and cutaneous T cell lymphoma (CTCL), ATL is sensitive to sphingomyelin inhibition and AK4 or RHOC depletion. Altogether, we report a distinct dependency of ATL on AK4 and RHOC oncogenes and an oncometabolite sphingomyelin, which together represent targetable vulnerabilities of ATL that could be exploited for developing effective therapeutics.

Keywords: AK4; ATL; HTLV-1; RHOC; miR-455.


Conflict of interest statement

Competing interests statement:The authors declare no competing interest.

Figures

Fig. 1.
Fig. 1.
Identification of miR-455-3p as a tumor suppressor in ATL. (A) Relative expression of miR-455-3p by qPCR in HD and ATL patients. (B) Effect of negative control (NC) or miR-455-3p mimic on Hut102 or MT-4 proliferation. (C) Effect of NC or miR-455-3p mimic on Hut102 or MT-4 migration as evaluated by transwell assay. The results (AC) were representatives of three independent experiments. (DG) Hut102 or MT-4 were transduced by lentivirus expressing an empty vector (lenti-Ctrl) or miR-455 (lenti-miR-455) and injected into NSG mice. At endpoint, mice were killed and tumors were removed and their volumes were measured and shown in (D and E). Note that one mouse in the lenti-ctrl group died shortly after injection due to acute stress. Photos of mouse spleens and measurements of their sizes are shown in (F). Splenocytes were analyzed by FACS and the number of metastasized GFP+ cells is shown in (G). *P < 0.05; **P < 0.01; ***P < 0.001.
Fig. 2.
Fig. 2.
AK4 and RHOC are miR-455-3p target genes in ATL. (A) RNA-seq was performed for lenti-Ctrl and lenti-miR-455 Hut102 and MT-4 cells and >1.5-fold differentially regulated genes were selected and analyzed. 22 such genes were present in both lenti-miR-455 Hut102 and MT-4 cells, among which five showed downregulation. Further information for these 22 genes is in SI Appendix, Table S2. (B) The abundances of the five genes downregulated by miR-455, based on RNA-seq results. (C) IGV output of RNA-seq reads mapped to AK4 or RHOC locus in Hut102 and MT-4 with lentiviral transduction. Black and gray colors indicate Ctrl and miR-455 respectively. (D) WB of AK4 and RhoC in lentivirus-transduced Hut102 and MT-4. (E) miR-455-3p and its target sequences in WT or mutated (Mut) 3′ UTR of AK4 or RHOC. (F) Luciferase assay results of reporters containing WT or Mut 3′ UTR of AK4 or RHOC. 293T Cells were transfected with either an empty vector (pENTR-Ctrl) or a miR-455 expression vector (pENTR-miR-455). (G) Relative expression of AK4 and RHOC in HD and ATL patients measured by qPCR. *P < 0.05; **P < 0.01; ns, not significant. The results were representatives of three independent experiments.
Fig. 3.
Fig. 3.
AK4 or RHOC promotes ATL in vitro and in vivo. (AC) Hut102 and MT-4 were transduced by lentivirus expressing a negative control shRNA (shNC) or gene-specific shRNAs (shAK4 or shRHOC). WB of AK4 and RhoC proteins is shown in (A). Relative viability of cells is measured by CCK-8 assay and results are shown in (B) while results of migration assay are shown in (C). The results (AC) were representatives of three independent experiments. (DH) shNC or AK4 or RHOC knockdown MT-4 were injected into NSG mice to observe tumor development. The growth curve of tumors is shown in (D). At endpoint, all mice were killed and photos are shown in (E). Photos of tumors were shown in (F). Quantification results of tumor volumes and weights were shown in (G and H) respectively. *P < 0.05; **P < 0.01; ***P < 0.001.
Fig. 4.
Fig. 4.
Transcriptome analysis reveals AK4 or RHOC likely regulates metabolism in ATL. (A) Volcano plots of differentially expressed genes in shNC vs. shAK4 or shRHOC group in MT-4 cells. Blue and red dots represent >1.5-fold downregulated and upregulated genes respectively, P < 0.05. (B) GSEA indicates the common pathways affected by AK4 and RHOC knockdown in MT-4 cells. The normalized enrichment score (NES) and false discovery rate (FDR) are shown. (C) KEGG pathway analysis of differentially expressed genes. (D) Functional annotation of KEGG enriched genes. (E) The Venn diagram showing 70 genes coregulated by AK4 and RHOC. Further information of these 70 genes is in SI Appendix, Table S3. (F) KEGG enrichment analysis of the 70 coregulated genes by AK4 and RHOC.
Fig. 5.
Fig. 5.
Metabolome profiling identifies lipid metabolism is affected by AK4 or RHOC knockdown. (A) Volcano plots of differentially produced metabolites in shNC vs. shAK4 or shRHOC group in MT-4 cells. Blue and red dots represent >1.5-fold downregulated and upregulated metabolites respectively, P < 0.05. (B) Ring diagrams of the differentially produced metabolites classified by HMDB’s Super Class substance classification. (C) Complex heatmaps of the top 50 differentially produced metabolites in shAK4 or shRHOC compared with shNC. Information on relative expression, fold change, P-value, and metabolite classification are shown. (D) Bar plots of KEGG pathway enrichment of the top 30 differentially produced metabolites. (E) Venn diagram showing the number of metabolites coregulated by AK4 and RHOC. Fifteen metabolites were present in both shAK4 and shRHOC groups. Further information of these 15 metabolites is in SI Appendix, Table S4. (F) Relative abundance of sphingomyelin extracted from the sequencing datasets in the shAK4 or shRHOC group.
Fig. 6.
Fig. 6.
ATL is addicted to AK4 or RHOC. (A) Relative expression of AK4 and RHOC in T-ALL patients and HD, based on the RNA-seq data of GSE141140. (B) Relative expression of AK4 and RHOC in CTCL patients and HD, based on the RNA-seq data of GSE113113. (C) CCK-8 assay results showing proliferation of ATL and non-ATL cell lines upon AK4 or RHOC knockdown. (D) Transwell assay results showing migration of the cells in (C). Note we did not detect migration of ED. The results (C and D) were representatives of three independent experiments. (EH) NC or AK4 or RHOC knockdown CEM-T4 were injected into NSG mice to observe tumor development. The growth curve of tumors is shown in (E). At endpoint, all mice were killed. Photos of tumors were shown in (F). Quantification results of tumor volumes and weights were shown in (G and H) respectively. *P < 0.05; **P < 0.01; ***P < 0.001; ns, not significant.
Fig. 7.
Fig. 7.
ATL is sensitive to sphingomyelin inhibition. (A) Targeted metabolome sequencing was performed in 4 ATL and 4 non-ATL cell lines. The upregulation of various molecular species of sphingomyelins in ATL over non-ATL cell lines is shown. (B) CCK-8 assay results showing proliferation of ATL and non-ATL cell lines upon sphingomyelin inhibition by myriocin treatments. The results were representatives of three independent experiments. (C) Schematic diagram of MT-4 xenograft experiment. (DG) MT-4 were injected into NSG mice to observe tumor development. The growth curve (D) and photos (E) of tumors, tumor volumes (F), and weights (G) are shown. (H) Schematic diagram of CEM-T4 xenograft experiment. (IL) MT-4 were injected into NSG mice to observe tumor development. The growth curve (I) and photos (J) of tumors, tumor volumes (K), and weights (L) are shown. *P < 0.05; **P < 0.01; ***P < 0.001; ns, not significant.

References

    1. Bangham C. R. M., HTLV-1 persistence and the oncogenesis of adult T-cell leukemia/lymphoma. Blood 141, 2299–2306 (2023). - PMC - PubMed
    1. Ma G., Yasunaga J., Akari H., Matsuoka M., TCF1 and LEF1 act as T-cell intrinsic HTLV-1 antagonists by targeting Tax. Proc. Natl. Acad. Sci. U.S.A. 112, 2216–2221 (2015). - PMC - PubMed
    1. Watanabe T., Adult T-cell leukemia: Molecular basis for clonal expansion and transformation of HTLV-1-infected T cells. Blood 129, 1071–1081 (2017). - PMC - PubMed
    1. Yoshie O., et al. , Frequent expression of CCR4 in adult T-cell leukemia and human T-cell leukemia virus type 1-transformed T cells. Blood 99, 1505–1511 (2002). - PubMed
    1. Ishida T., et al. , Mogamulizumab for relapsed adult T-cell leukemia-lymphoma: Updated follow-up analysis of phase I and II studies. Cancer Sci. 108, 2022–2029 (2017). - PMC - PubMed

LinkOut - more resources