. 2025 Apr 1;328(4):L538-L553.
doi: 10.1152/ajplung.00293.2024. Epub 2025 Feb 21.

Culture conditions differentially regulate the inflammatory niche and cellular phenotype of tracheobronchial basal stem cells

Affiliations

Culture conditions differentially regulate the inflammatory niche and cellular phenotype of tracheobronchial basal stem cells

Shubha Murthy et al. Am J Physiol Lung Cell Mol Physiol. .

Abstract

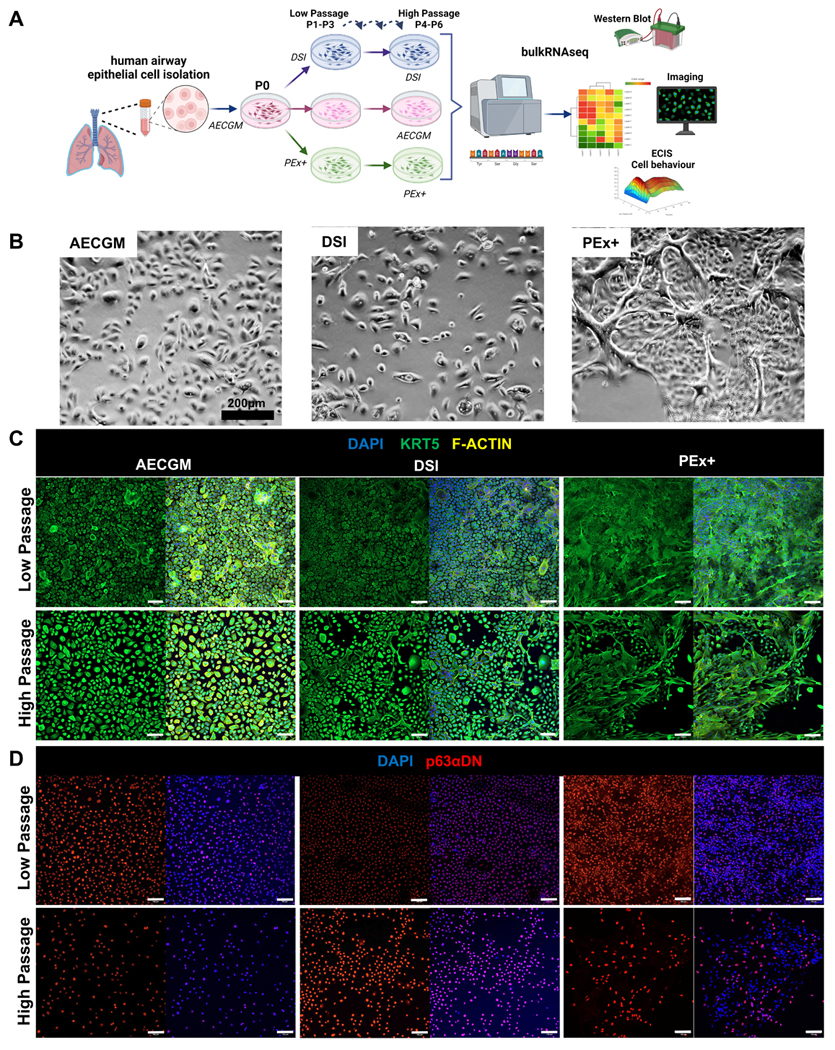
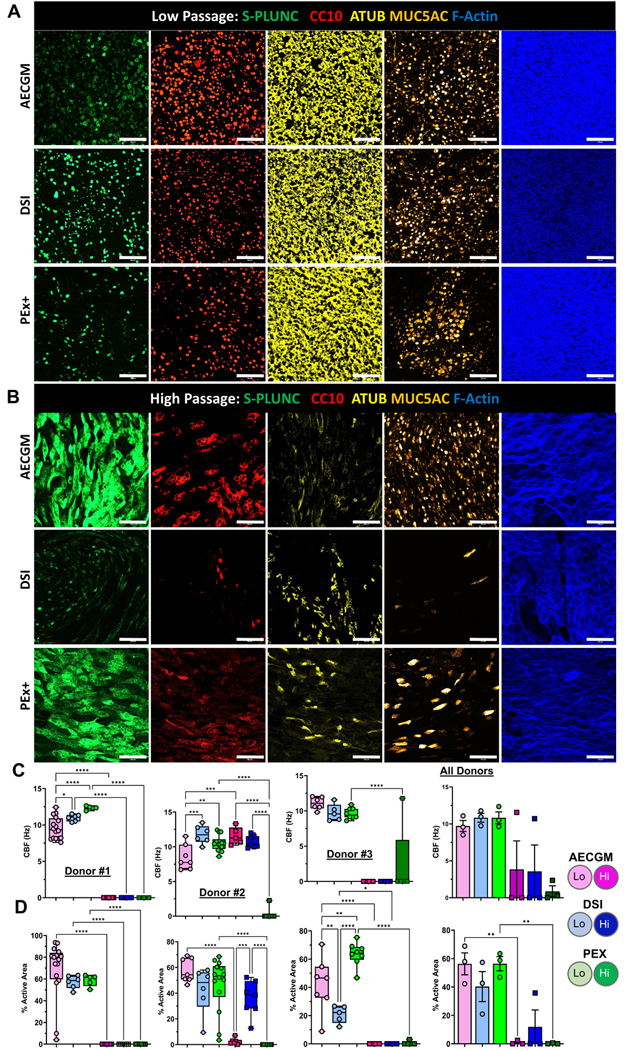
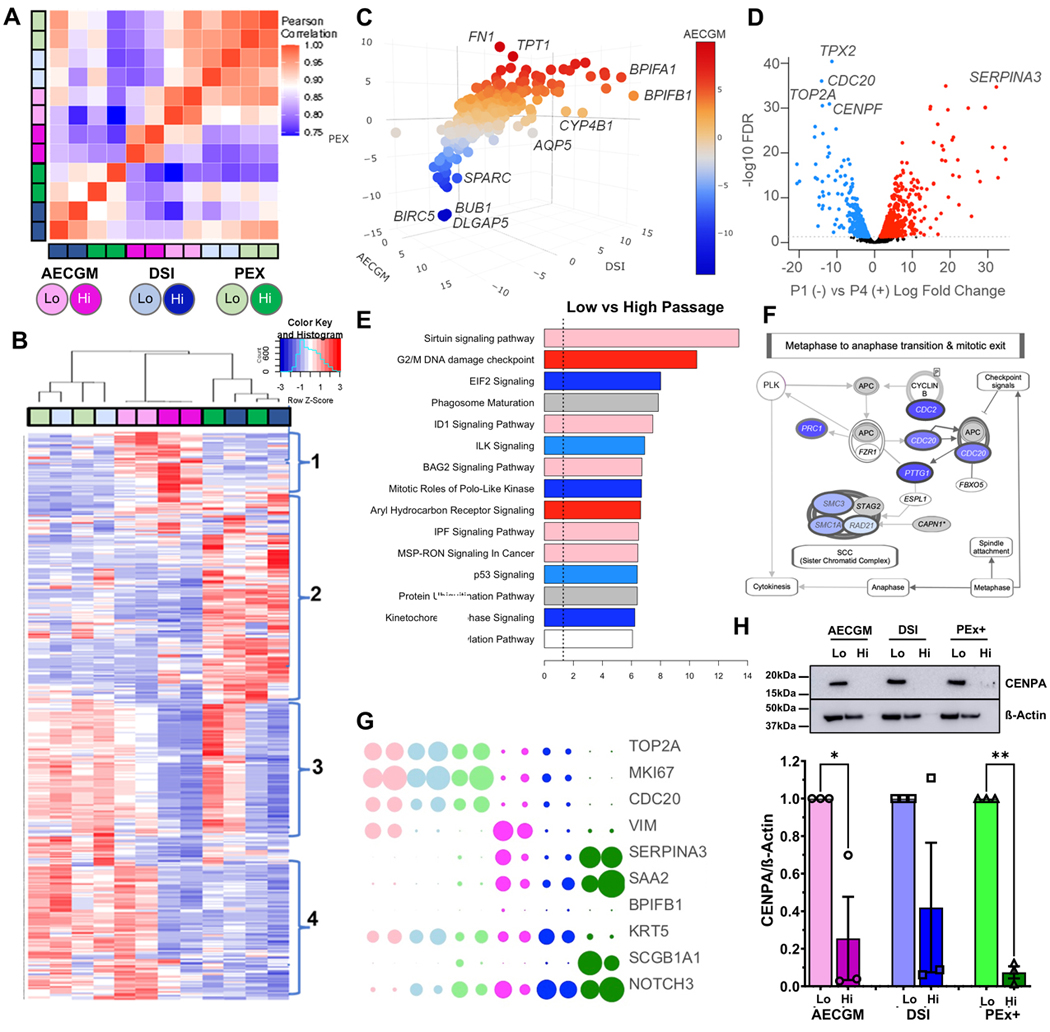
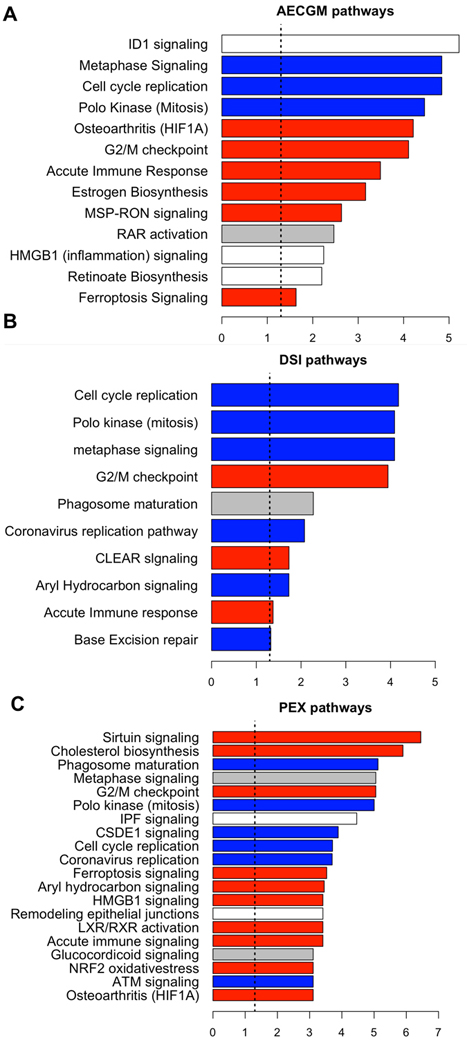
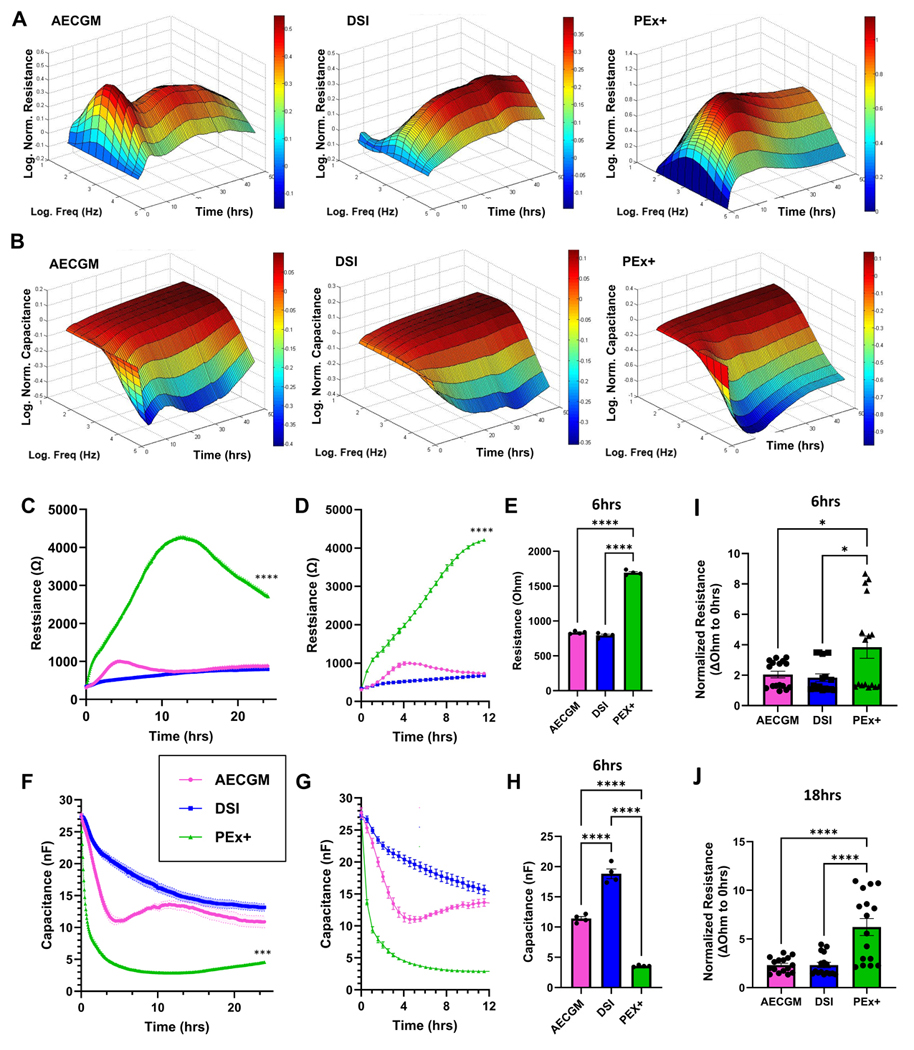
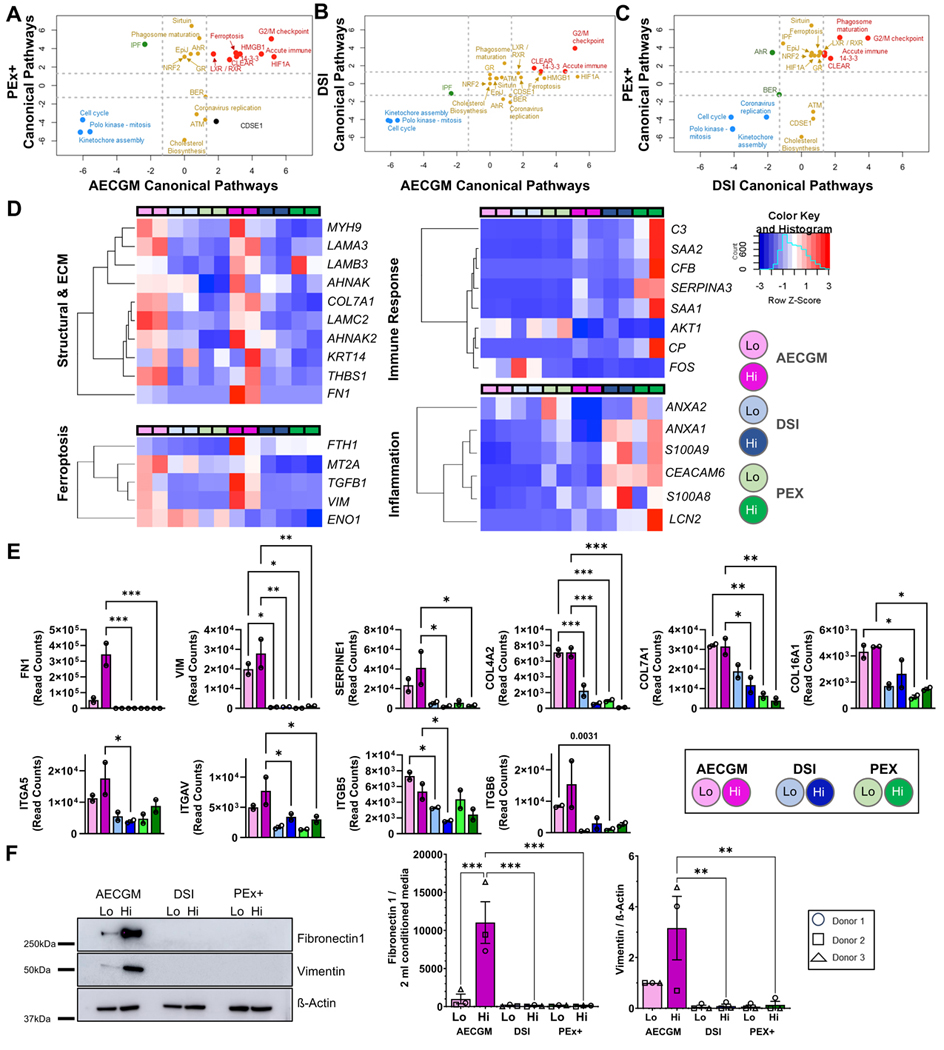
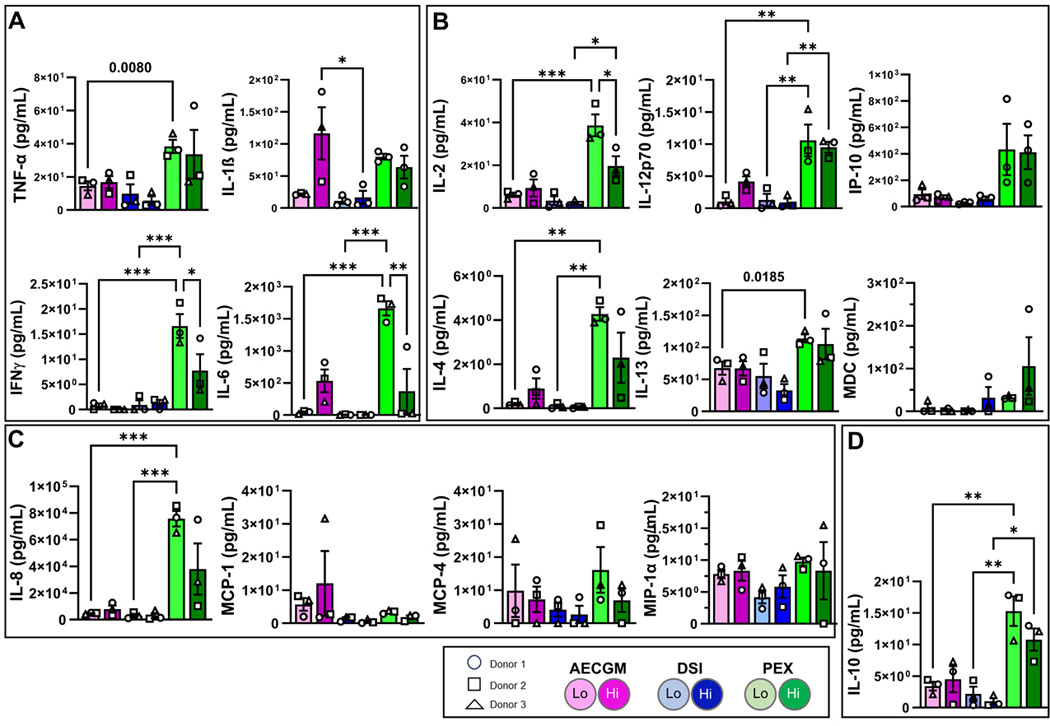
Bronchial epithelial cells derived from the tracheobronchial regions of human airways (HBECs) provide a valuable in vitro model for studying pathological mechanisms and evaluating therapeutics. This cell population comprises a mixed population of basal cells (BCs), the predominant stem cell in airways capable of both self-renewal and functional differentiation. Despite their potential for regenerative medicine, BCs exhibit significant phenotypic variability in culture. To investigate how culture conditions influence BC phenotype and function, we expanded three independent BC isolates in three media: airway epithelial cell growth medium (AECGM), dual-SMAD inhibitor (DSI)-enriched AECGM, and PneumaCult Ex plus (PEx+). Analysis through RNA sequencing, immune assays, and impedance measurements revealed that PEx+ media significantly drove cell proliferation and a broad proinflammatory phenotype in BCs. In contrast, BCs expanded in AECGM and displayed increased expression of structural and extracellular matrix components at higher passage. AECGM increased expression of some cytokines at high passage, whereas DSI suppressed inflammation implicating the involvement TGF-β in BC inflammatory processes. Differentiation capacity of BCs declined with time in culture irrespective of expansion media. This was associated with an increase in PLUNC expressing secretory cells in AECGM and PEx+ media consistent with the known immune modulatory role of PLUNC in the airways. These findings highlight the profound impact of media conditions on inflammatory niche established by, and function of, in vitro expanded BCs. The broad proinflammatory phenotype driven by PEx+ media, in particular, should be considered in the development of cell-based models for airway diseases and therapeutic applications.NEW & NOTEWORTHY Airway basal cells, vital for airway regeneration and potential therapies, show significant changes based on culture conditions. Our study reveals that media composition and culture duration greatly affect basal cell properties with profound changes in the proinflammatory phenotype and extracellular matrix deposition driven by changes in growth conditions. These results underscore the critical impact of culture conditions on BC phenotype, influencing cell-based models for airway disease research and therapy.

Keywords: RNA sequencing; airway epithelium; cell proliferation; differentiation; inflammatory niche.


Conflict of interest statement

DISCLOSURES

At the time of submission, the authors have no perceived or potential conflict of interest, financial or otherwise to disclose.

Figures

Figure 1:
Figure 1:. Long-term Culture Alters BC Phenotype.
(A) Schematic of isolation, expansion, and subculturing of BCs in AECGM, DSI or PEx+ media. Cells were harvested at either low (p1-p3) or high passage (p5-p6) for bulk RNA seq, immunofluorescent (IF) detection of stem cell markers, Western blotting (WB), or growth kinetics using ECIS. In addition, low and high passage BCs cultured in the 3 different media, were differentiated for 28 days at the air-liquid-interphase (ALI) to assess differentiation to ciliated, secretory or goblet cells and ciliary beat frequency. This schematic was made with Biorender.com. (B) Phase contrast images of low passage BCs cultured for 5 days in the 3 different media. Scale bar=200μm. Representative IF images from single donor showing KRT5 (green) and KRT5-F-ACTIN (yellow)-DAPI (blue) merged expression (C) and P63αΔN (red) and P63αΔN-nuclei (DAPI, blue) merged images (D) at low and high passage in AECGM, DSI or PEx+. Scale bar=100μm.
Figure 2:
Figure 2:. Culture Conditions Significantly Impact BC Differentiation.
Representative ALI IF images from single donor at low (A) and high passage (B) expanded in AECGM, DSI or PEx+ and differentiated in Pneumacult ALI medium. Acetylated Tubulin (ATUB), CC10, PLUNC, mucin 5AC (MUC5AC) and F-actin expression are shown. Scale bar=100μm. (C) Functional properties of ciliated cells at low and high passages in the 3 different media were measured by ciliary beat frequency (CBF) and distribution of actively beating ciliated cells (% Active area). Mean±SEM of 3 donors, * p <0.05, **p<0.01, ***p<0.001, ****p<0.0001.
Figure 3.
Figure 3.. Culture In AECGM Media Generates Distinct Basal Cell Transcriptome Patterning.
(A) Pearson correlation matrix of gene expression patterns across samples. (B) Unsupervised hierarchical clustering of top 20% of differentially expressed genes between high and low passage for all media types. (C) Three-dimensional plot showing distinct expression changes between all 3 media types. All axes represent log fold change in gene expression between high (+) and low (−) passage. Red = upregulated in AECGM at high passage, blue = downregulated in AECGM at high passage. (D) Volcano plot of differential expression between high (+) and low (−) passage for all media types. Red = increased expression, blue = decreased expression. (E) IPA pathways enrichment analysis for high (+) vs low (−) for all media types. Red (and shades of) = positive Z score of enrichment, blue (and shades of) = negative z score of enrichment, Grey = not able to calculate a z-score of activation. Data are plotted as - log10-BH corrected p value of pathway enrichment, the vertical dashed line indicates significance threshold. (F) Loss of metaphase separation observed in all media types. Canonical pathway shown. Blue = gene downregulated in high vs. low passage. (G) Dot plot of the top DEG between media and passage. (H) Representative immunoblots of CENPA and β-Actin from single donor and quantitation of CENPA normalized to β-Actin in 3 donors. Mean±SEM. *p<0.05, **p<0.01.
Figure 4.
Figure 4.. Media Specific Changes in IPA pathways associated with BC Expansion in Culture.
IPA pathway enrichment analysis for high (+) and low (−) passage for AECGM (A), DSI (B) and PEx+ (C). Red = positive Z score of enrichment, blue = negative z score of enrichment, Grey = not able to calculate a z-score of activation and white has a z-score of activation of 0. Data are plotted as - log10-BH corrected p value of pathway enrichment, the vertical dashed line indicates significance threshold.
Figure 5:
Figure 5:. Culture Conditions Significantly Alter Biophysical Properties of BCs.
ECIS measurements of BCs from a single donor cultured in the AECGM, DSI, or PEx+ media demonstrate marked differences in resistance (A, C) and capacitance (B,F) over 24 hours . Resistance at 4,000Hz shown over 24 hours (C) and 12 hours (D) for a single donor (n=4). (E) Measurement of resistance from one donor (n=4) after 6 hours. Capacitance at 64,000Hz shown over 24 (F) and 12 (G) hours. (H) Measurement of capacitance from one donor (n=4 technical replicates) after 6 hours. Resistance, normalized to 0-hour time point, at 4,000Hz from 3 independent donors after 6-hour (I) and 18-hour (J) incubation in the 3 media (N=3 donors, n=4 wells/donor). Mean±SEM. *p<0.05, ****p<0.0001.
Figure 6.
Figure 6.. Altered Transcriptome Pathways by Long-Term Culture.
Transcriptome analyses of most altered canonical pathway genes in cells cultured in AECGM and PEx+ (A), AECGM and DSI (B), and DSI and PEx+ (C). Blue=down regulated in both media, mustard=unchanged in the x axis media but significantly changed in the y axis media, green differentially regulated by media and red=upregulated in both media. (D) Heatmaps of genes reflecting the differential pathway regulation by the 3 media for specific genes selected to highlight differences in AECGM and PEx+ demonstrating changes in structural and ECM, immune response, and inflammation related genes. (E) RNAseq read counts of genes involved in cell-matrix interactions and cell surface adhesion and signaling for FN1, VIM, SEPRINE1, COL4A2, COL7A1, COL16A1, ITGA5, ITGAV, ITGB5 and ITGB6 in all 3 media across low and high passages. (F) Representative immunoblot of BCs from a single donor is shown. Densitometric quantitation of fibronectin 1 and vimentin from 3 donors normalized to conditioned media from 1 well and β-Actin, respectively. Data represents mean±SEM. *p<0.05, ** p<0.01, *** p<0.001, **** p<0.0001. Where significance is numerically stated this represents an unpaired student’s t-test.
Figure 7.
Figure 7.. Media- and time-dependent alterations in inflammatory profile of BCs in culture.
Secretion of cytokines and chemokines by BCs comparing low and high passage BCs expanded in AECGM, DSI or PEx+. (A) Pro-inflammatory cytokines: TNF-α, IL-1 β, IFN-γ, and IL-6. (B) T cell regulatory cytokines: IL-2, IL-12p70, IP-10, IL-4 , IL-13, and MDC. (C) Neutrophil and monocyte chemoattractants: IL-8, MCP-1, MCP-4 and MIP-1α. (D) Anti-inflammatory cytokine IL-10. Data represents mean±SEM *p<0.05, ** p<0.01 *** p<0.001. Where significance is numerically stated this represents an unpaired student’s t-test.

Update of

Similar articles

References

    1. Busch SM, Lorenzana Z, Ryan AL. Implications for Extracellular Matrix Interactions With Human Lung Basal Stem Cells in Lung Development, Disease, and Airway Modeling. Front Pharmacol. 2021;12:645858. Epub 20210512. doi: 10.3389/fphar.2021.645858. - DOI - PMC - PubMed
    1. Hong KU, Reynolds SD, Watkins S, Fuchs E, Stripp BR. Basal cells are a multipotent progenitor capable of renewing the bronchial epithelium. Am J Pathol. 2004;164(2):577–88. doi: 10.1016/S0002-9440(10)63147-1. - DOI - PMC - PubMed
    1. Hong KU, Reynolds SD, Watkins S, Fuchs E, Stripp BR. In vivo differentiation potential of tracheal basal cells: evidence for multipotent and unipotent subpopulations. Am J Physiol Lung Cell Mol Physiol. 2004;286(4):L643–9. Epub 20030718. doi: 10.1152/ajplung.00155.2003. - DOI - PubMed
    1. Parekh KR, Nawroth J, Pai A, Busch SM, Senger CN, Ryan AL. Stem cells and lung regeneration. Am J Physiol Cell Physiol. 2020;319(4):C675–C93. Epub 20200812. doi: 10.1152/ajpcell.00036.2020. - DOI - PMC - PubMed
    1. Whitsett JA, Kalinichenko VV. Notch and basal cells take center stage during airway epithelial regeneration. Cell Stem Cell. 2011;8(6):597–8. doi: 10.1016/j.stem.2011.05.008. - DOI - PubMed

LinkOut - more resources