. 2025 Jun 17;110(7):e2362-e2382.
doi: 10.1210/clinem/dgaf112.

Cell Lineage-Specific Differences in Clinical Behavior of Non-Functioning Pituitary Adenomas

Affiliations

Cell Lineage-Specific Differences in Clinical Behavior of Non-Functioning Pituitary Adenomas

Loren S van der Hoeven et al. J Clin Endocrinol Metab. .

Abstract

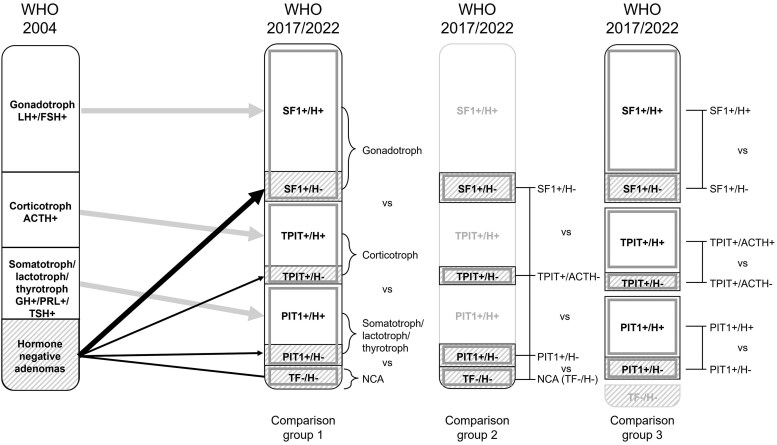
Context: Immunohistochemistry (IHC) of cell lineage-specific transcription factors (TFs) has been added to the histopathological classification of pituitary adenomas since 2017, resulting in new histopathological subtypes of TF+/hormone-non-functioning pituitary adenomas (NFPAs) and a reduction in the prevalence of null cell adenomas (NCAs).

Objective: This work aimed to evaluate associations between expression of cell lineage-specific TFs by IHC and radiological invasion and prognosis of NFPAs.

Data sources: A literature search in Medline, Embase, and CENTRAL was performed from inception up to July 11, 2023.

Study selection: Eligible studies were cohort studies reporting on radiological invasion, recurrence, and/or radiotherapy in patients with NFPAs who tested positive for one cell lineage-specific TF or negative for all 3. Finally, 27 out of 1985 studies were included.

Data extraction: Two authors independently extracted data and critically appraised risk of bias using the Quality In Prognostic Studies (QUIPS) tool.

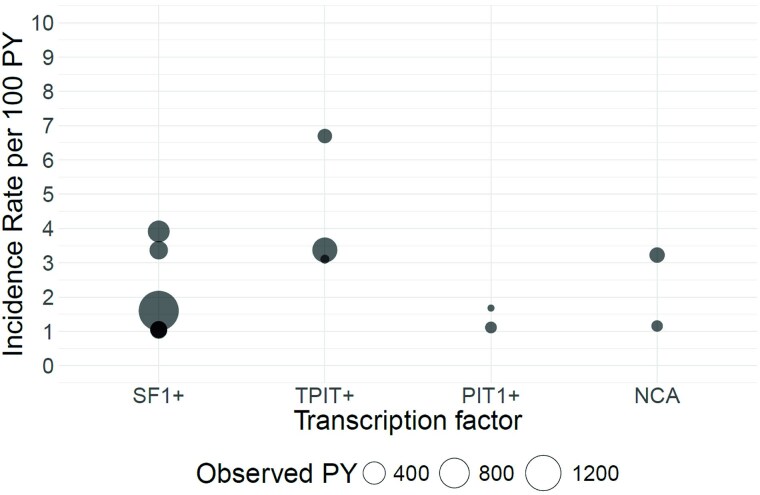
Data synthesis: Random-effects inverse variance models were used to pool effect sizes. Prevalence rate ratios (PRRs) were calculated using the Mantel-Haenszel method. Cavernous sinus invasion was more prevalent in NCAs and TPIT+ NFPAs compared with SF1+ NFPAs (PRR 1.60; 95% CI, 1.22-2.08, I2 10%, 95% prediction interval [PrI] 1.23-2.06; P = .0036, and PRR 1.43; 95% CI, 1.21-1.70, I2 0%, 95% PrI 1.17-1.76; P = .0017, respectively), and in NCAs compared with PIT1+ (PRR 1.44; 95% CI, 1.01-2.06, I2 0%, 95% PrI 0.83-2.50; P = .0454). A limited number of studies precluded data syntheses of recurrence and radiotherapy.

Conclusion: The use of cell lineage-specific TFs by IHC enables to detect histopathological subtypes of NFPAs with distinct clinical behavior.

Keywords: PitNET; SF1; TPIT; null cell adenoma; pituitary adenoma; transcription factors.


Figures

Figure 1.
Figure 1.
Comparison groups of histopathological subtypes of non-functioning pituitary adenomas (NFPAs). Comparison group 1: cross-comparisons between cell lineage-specific transcription factor (TF)-positive (SF1+, TPIT+, and PIT1+ NFPAs) and cell lineage-specific TF-negative (NCAs) NFPAs. Immunohistochemistry (IHC) of adenohypophyseal hormones is not taken into account. Comparison group 2: cross-comparisons between cell lineage-specific TF-positive and adenohypophyseal hormone-negative NFPAs (SF1+/H−, TPIT+/H−, and PIT1+/H−) and TF-negative NFPAs (TF–; NCAs) by IHC. Comparison group 3: cross-comparisons between cell lineage-specific TF-positive and adenohypophyseal hormone-positive, and adenohypophyseal hormone-negative NFPAs (SF1+/H− vs SF1+/H+, TPIT+/H− vs TPIT+/H+, and PIT1+/H− vs PIT1+/H+) by IHC. Abbreviations: ACTH, adrenocorticotropin; FSH, follicle-stimulating hormone; GH, growth hormone; H, adenohypophyseal hormone; IHC, immunohistochemistry; LH, luteinizing hormone; NCA, null cell adenoma; NFPA, non-functioning pituitary adenoma; PIT1, pituitary transcription factor 1; PRL, prolactin; SF1, steroidogenic factor 1; TF, transcription factor; TPIT, T-box family member TBX19; TSH, thyrotropin; WHO, World Health Organization.
Figure 2.
Figure 2.
Flow diagram of included studies.
Figure 3.
Figure 3.
Forest plots of prevalence rate ratios (PRRs) of cavernous sinus invasion (CSI) at time of first and/or repeat surgeries for comparison group 1 of A, NCAs vs SF1+ NFPAs; B, TPIT+ vs SF1+ NFPAs; C, PIT1 + vs SF1+ NFPAs; D, NCA vs TPIT+ NFPAs; E, NCA vs PIT1+ NFPAs; and F, TPIT+ vs PIT1+ NFPAs. Comparison group 1: cross-comparisons between cell lineage-specific transcription factor-positive (SF1+, TPIT+, and PIT1+) NFPAs and cell lineage-specific transcription factor-negative (NCAs) NFPAs. Immunohistochemistry of adenohypophyseal hormones is not taken into account. Abbreviations: CSI, cavernous sinus invasion; NCA, null cell adenoma; NFPA, non-functioning pituitary adenoma; PIT1, pituitary transcription factor 1; PR, prevalence rate; PRR, prevalence rate ratio; SF1, steroidogenic factor 1; TPIT, T-box family member TBX19.
Figure 4.
Figure 4.
Bubble plot of A, recurrence rates per 100 patient-years (PYs) after first and/or repeat surgery by transcription factor and B, recurrence rate ratios per 100 PY by comparison for comparison group 1. Every bubble represents the recurrence rate or recurrence rate ratio calculated based on individual study data. Bubble size represents the observed PY per subtype or per comparison. Studies that are not eligible for meta-analysis are marked as a white bubble. The horizontal line on the y-axis of Fig. 4B represents a recurrence rate ratio of 1. Comparison group 1: cross-comparisons between cell lineage-specific transcription factor-positive (SF1+, TPIT+, and PIT1+) NFPAs and cell lineage-specific transcription factor-negative (NCAs) NFPAs. Immunohistochemistry of adenohypophyseal hormones is not taken into account. Abbreviations: NCA, null cell adenoma; NFPAs, non-functioning pituitary adenomas; PIT1, pituitary transcription factor 1; PY, patient-year; SF1, steroidogenic factor 1; TPIT, T-box family member TBX19.
Figure 5.
Figure 5.
Bubble plot of incidence rates of postoperative radiotherapy per 100 patient-years (PYs) by transcription factor for comparison group 1. Every bubble represents the incidence rate calculated based on individual study data. Bubble size represents the observed patient years per subtype or per comparison. Comparison group 1: cross-comparisons between cell lineage-specific transcription factor-positive (SF1+, TPIT+, and PIT1+) NFPAs and cell lineage-specific transcription factor-negative (NCAs) NFPAs. Immunohistochemistry of adenohypophyseal hormones is not taken into account. Abbreviations: NCA, null cell adenoma; NFPAs, non-functioning pituitary adenomas; PIT1, pituitary transcription factor 1; PY, patient-year; SF1, steroidogenic factor 1; TPIT, T-box family member TBX19.

References

    1. Figarella-Branger D, Trouillas J. The new WHO classification of human pituitary tumors: comments. Acta Neuropathol. 2006;111(1):71‐72. - PubMed
    1. Mete O, Lopes MB. Overview of the 2017 WHO classification of pituitary tumors. Endocr Pathol. 2017;28(3):228‐243. - PubMed
    1. Asa SL, Mete O, Perry A, Osamura RY. Overview of the 2022 WHO classification of pituitary tumors. Endocr Pathol. 2022;33(1):6‐26. - PubMed
    1. Nishioka H, Inoshita N, Mete O, et al. The complementary role of transcription factors in the accurate diagnosis of clinically nonfunctioning pituitary adenomas. Endocr Pathol. 2015;26(4):349‐355. - PubMed
    1. Lenders NF, Wilkinson AC, Wong SJ, et al. Transcription factor immunohistochemistry in the diagnosis of pituitary tumours. Eur J Endocrinol. 2021;184(6):891‐901. - PubMed

Substances