. 2025 Aug 1;148(8):2797-2811.
doi: 10.1093/brain/awaf074.

Proprioceptive synaptic dysfunction is a key feature in mice and humans with spinal muscular atrophy

Affiliations

Proprioceptive synaptic dysfunction is a key feature in mice and humans with spinal muscular atrophy

Christian M Simon et al. Brain. .

Abstract

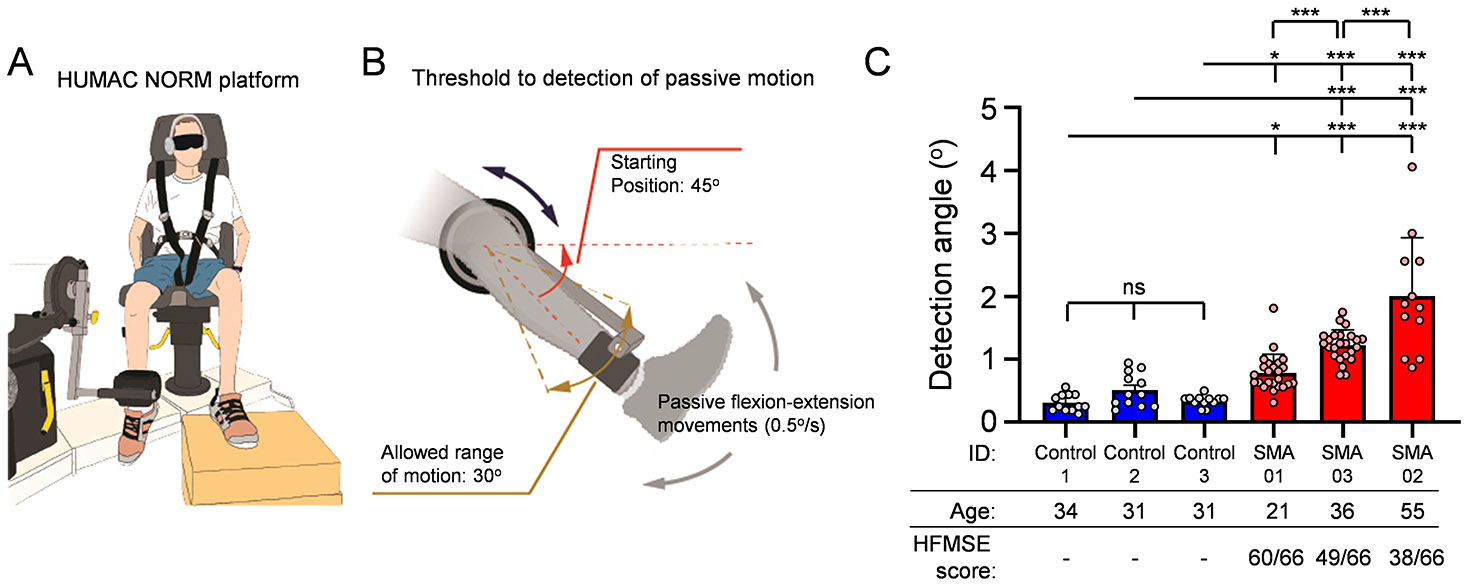
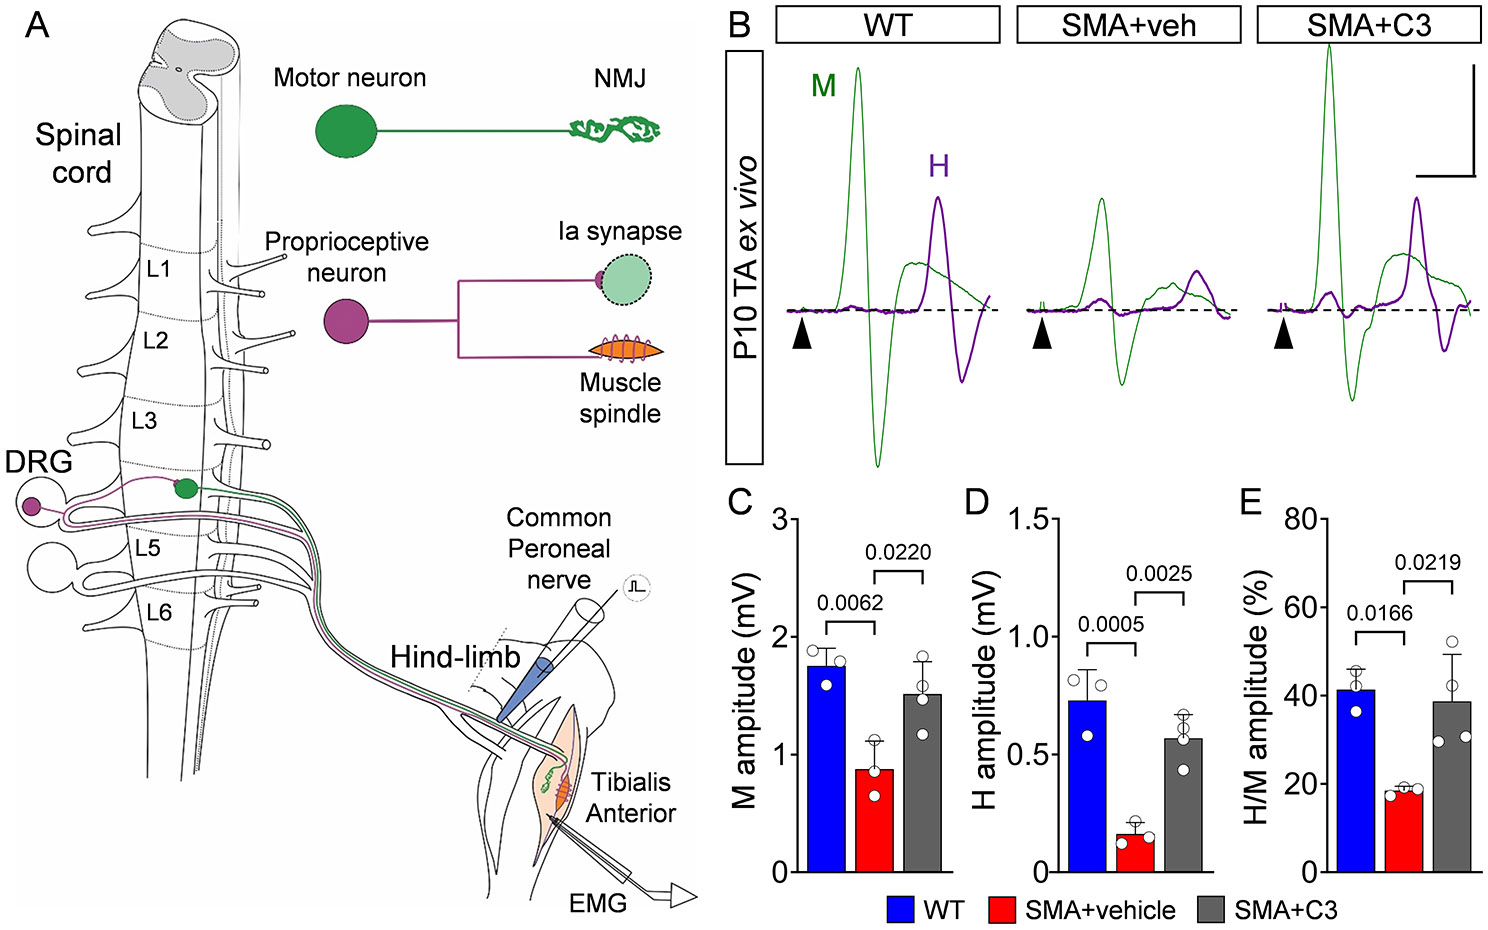
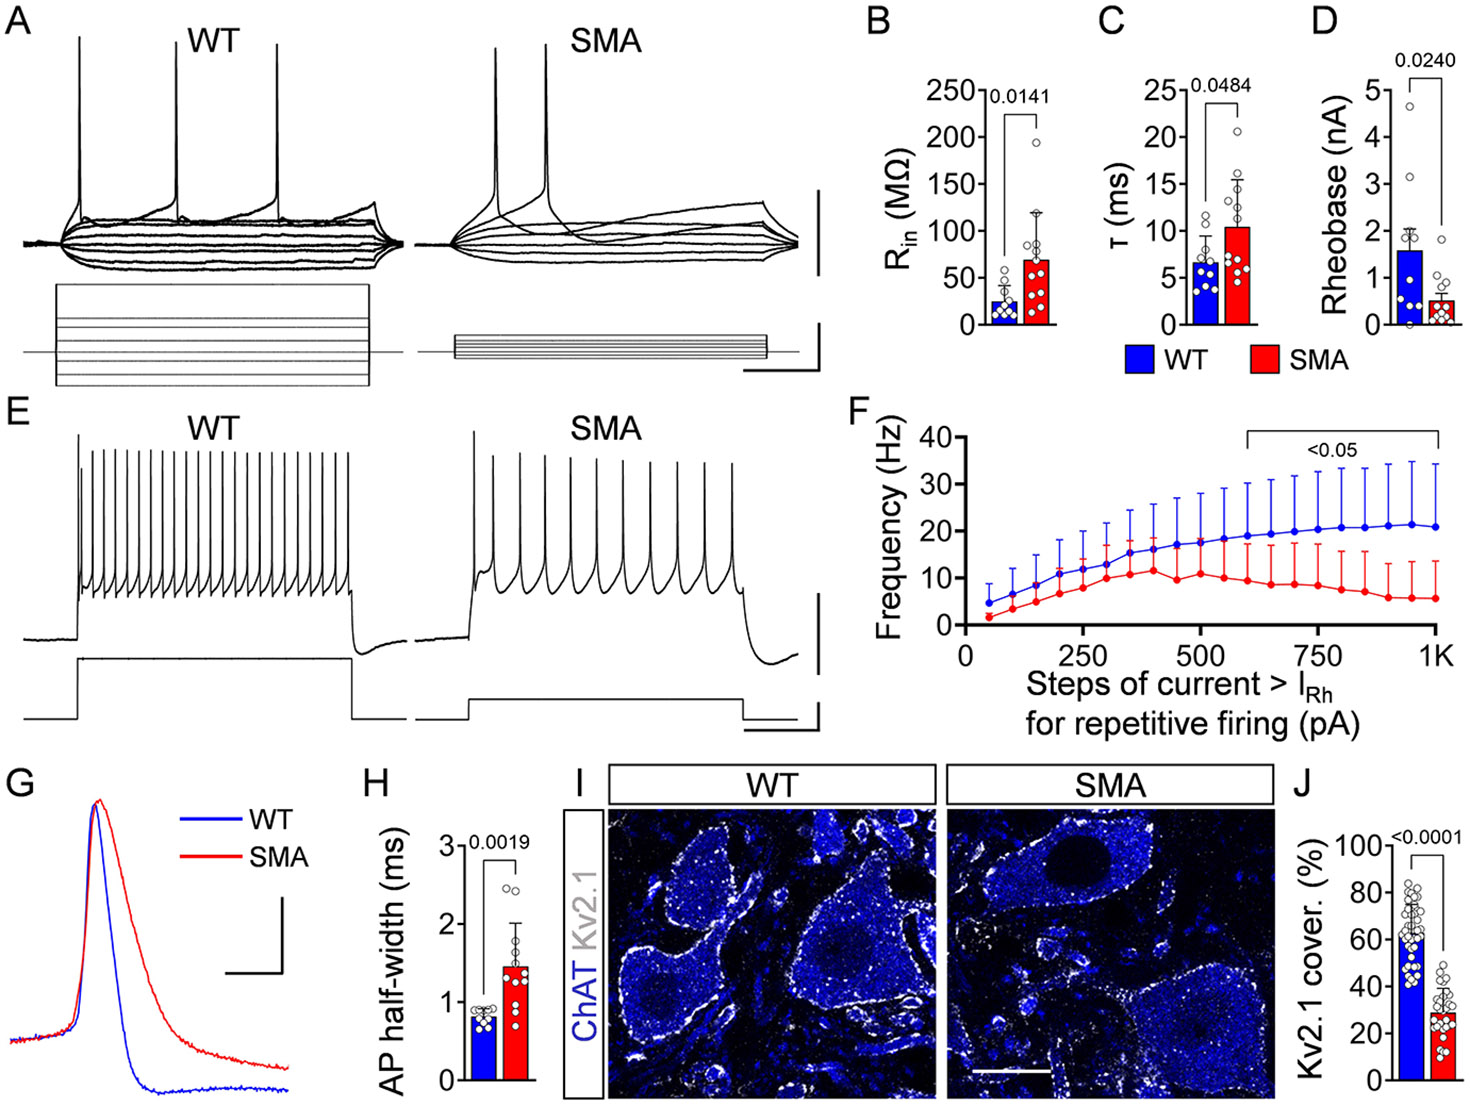
Spinal muscular atrophy (SMA) is a neurodegenerative disease characterized by a varying degree of severity that is correlated with the reduction of SMN protein levels. Motor neuron degeneration and skeletal muscle atrophy are hallmarks of SMA, but it is unknown whether other mechanisms contribute to the spectrum of clinical phenotypes. Here, through a combination of physiological and morphological studies in mouse models and SMA patients, we identify dysfunction and loss of proprioceptive sensory synapses as key signatures of SMA pathology. We demonstrate that type 3 SMA patients exhibit impaired proprioception and that their proprioceptive synapses are dysfunctional as measured by the neurophysiological test of the Hoffmann reflex. We also show moderate loss of spinal motor neurons along with reduced excitatory afferent synapses and altered potassium channel expression in motor neurons from type 1 SMA patients. These are conserved pathogenic events found in both severely affected patients and mouse models. Lastly, we report that improved motor function and fatigability in ambulatory type 3 SMA patients and mouse models treated with SMN-inducing drugs are correlated with increased function of sensory-motor circuits that can be captured accurately by the Hoffmann reflex assay. Thus, sensory synaptic dysfunction is a clinically relevant event in SMA, and the Hoffmann reflex is a suitable assay to monitor disease progression and treatment efficacy of motor circuit pathology.

Keywords: motor neuron; neurodegenerative disease; proprioception; sensory synapses; sensory–motor circuit; spinal muscular atrophy.


Figures

Figure 1.
Figure 1.. Proprioceptive dysfunction in SMA patients.
(A) Drawing of the testing platform. The Humac Norm was used to assess proprioception in SMA patients and controls. This platform allows for precise passive movement of the knee joint at minimal speed of 0.5°/s. (B) Protocol details of the proprioceptive assessment test. The initial position of the leg was at 45° from the horizontal plane. Randomly selected flexion or extension movements were imposed in the knee joint at a speed of 0.5°/s and a maximum range of motion of 30°. (C) Deficits in proprioception vs Hammersmith Functional Motor Scale Expanded (HMFSE) motor score in three SMA patients (red bars) and three control participants (blue bars). Each dot per participant represent the result from an individual trial. The HFMSE scores for the SMA participants are also shown (max value 66). Statistical comparisons were performed between each SMA patient to each participant from the control group. Statistical significance was calculated using ordinary one-way ANOVA with Tukey’s multiple post hoc comparisons test; *** p<0.001, * p<0.05; ns: no significance.
Figure 2.
Figure 2.. H-reflex is reduced in Type 3 SMA patients and improved following nusinersen treatment.
(A) Schematic showing the location of the electrodes for the H-reflex recorded from soleus muscles in human participant. (B) EMG recordings from soleus muscle following stimulation of the tibial nerve in control, untreated and nusinersen-treated SMA patients. Superimposed traces for maximum M- (green) and H- (magenta) responses are shown. Arrowheads indicate stimulus artefacts. Scale bar: 2mV, 10ms. Insets show magnified H-reflex responses. Scale bar: 1mV, 5ms. M-response amplitude (C), H-reflex amplitude (D) and H/M amplitude ratio (E) for control (N = 7) and SMA-untreated (N = 3) and nusinersen-treated (N = 4) of both left (triangle) and right (circle) legs of SMA Type 3 patients. Note that one treated SMA patient refused right side assessment (F) 6-minute-walk-test (6MWT) and (G) fatigability of the same untreated (N = 3) and nusinersen-treated (N = 4) SMA Type 3 patients. Data represent means and SD. Statistical analysis was performed using Welch’s test for (F), unpaired t test for (G), one-way ANOVA with Tukey multiple comparison test (C-E).
Figure 3.
Figure 3.. SMN therapy restores H-reflex in neonatal and juvenile SMA mice.
(A) Experimental setup to measure H-reflex using the spinal cord-hindlimb ex vivo preparation. The stretch reflex circuit consists of a motor neuron (MN) (green) and its neuromuscular junction (NMJ) synapse with its muscle, as well as a proprioceptive neuron (magenta) originating from a muscle spindle and making contact with a motor neuron via an Ia synapse. The common peroneal (CP) nerve was stimulated with an en passant electrode, while EMG was recorded from the tibialis anterior (TA) muscle. (B) TA EMG recordings following stimulation of the CP nerve in WT, vehicle-treated SMA and C3-treated SMA mice at P10. Superimposed traces for maximum M- (green) and H- (magenta) responses are shown. Arrowheads indicate stimulus artefacts. Scale bar: 0.5mV, 5ms. M-response amplitude (C), H-reflex amplitude (D) and H/M amplitude ratio (E) from WT (N = 4 mice) and SMA+vehicle (N = 4) and SMA+C3 (N = 5) mice at P10. (F) Drawing of a mouse highlighting the approximate location for stimulation of the sciatic nerve (red electrode) and the approximate location of the EMG electrode for the flexor digitorum brevis (FDB) muscle at the sole of the hindpaw. (G) In vivo EMG recordings form FDB muscle following stimulation of the sciatic nerve in WT and SMA mice treated daily with C3 compound at P30. Traces for M- and H- responses are shown in green. Arrowheads indicate stimulus artefact. Scale bar: 1mV, 2ms. Insets show magnified H-reflex in magenta. Scale bar: 50μV, 0.5ms. M-response amplitude (H), H-reflex amplitude (I), and H/M amplitude ratio (J) from WT (N = 4) and SMA+C3 (N = 9) mice at P30. Data represent means and SD. Statistical analysis was performed using an one-way ANOVA with Tukey multiple comparison test (C-E), t-test (I) and Mann-Whitney test (H, J).
Figure 4.
Figure 4.. SMN therapy restores sensory-motor circuit function in SMA mice.
Righting time (A), posture time (B) and weight (C) of WT (blue, N = 12 mice), SMA+vehicle (red, N = 9), and SMA+C3 (grey, N = 14) mice. (D) Confocal images and (E) quantification of (ChAT+) L1 motor neurons in the same groups as in A-C at P10. WT (N = 3 mice) and SMA+vehicle (N = 4) and SMA+C3 (N = 3) mice. Scale bar: 50μm. (F) Confocal images and (G) quantification of NMJ innervation (neurofilament and SV2+ are presynaptic markers while bungarotoxin is a postsynaptic marker). WT (N = 4 mice) and SMA+vehicle (N = 3) and SMA+C3 (N = 4) mice, ~200-300 NMJs per animal have been analyzed. Scale bar: 50μm. (H) Confocal images and (I) quantification of VGluT1+ proprioceptive synapses onto ChAT+ L1 motor neurons. Number of proprioceptive synapses on spinal motor neurons from WT (n=29 MNs from N=3 mice), SMA+vehicle (n=40 MNs from N=4 mice) and SMA+C3 (n=40 MNs from N=4 mice) mice. Scale bar: 20μm. (J) Confocal images and (K) quantification of Kv2.1 coverage of the cell membrane of motor neurons from WT (n=30 MNs from N=3 mice), SMA+vehicle (n=30 MNs from N=3 mice) and SMA+C3 (n=40 MNs from N=4 mice) mice. Scale bar: 20μm. Data represent means and SD. Statistical analysis was performed using two-way ANOVA with Tukey multiple comparison test (A,B,C) or one-way ANOVA (E, G, K) or Kruskal-Wallis with Dunn Posthoc (I) # indicates p <0.05.
Figure 5.
Figure 5.. Proprioceptive neurotransmission is impaired in motor neurons innervating distal muscles at late stages of disease in SMA mice.
(A) Schematic of the modified ex vivo spinal cord preparation in which the ventral funiculus was removed to aid visual access for patch clamp recordings. (B) Confocal image of CTb-488 (in green) motor neurons in a spinal cord preparation (L4/5 spinal segment). A motor neuron is shown in magenta which was intracellularly recorded, filled with Neurobiotin and visualized post hoc. Scale bar: 20μm. (C) Excitatory postsynaptic potentials (EPSPs) following supramaximal L5 dorsal root stimulation in WT and SMA mice at P10. Dotted vertical lines indicate the onset of the response and where the EPSP amplitude is measured (2.5ms after the onset). Scale bar: 5mV, 2ms. (D) Peak amplitude and (E) latency of EPSPs in WT (n = 11 motor neurons) and SMA (n = 9) motor neurons at P10. At least N=4 mice used per genotype. Relationship between input resistance and peak EPSP amplitude (F) as well as input resistance and motor neuron soma area (G) from WT (n = 9) and SMA (n = 8) motor neurons at P10. (H) Confocal images of L5 motor neurons (ChAT, green) and proprioceptive synapses (VGluT1, magenta) from WT and SMA mice at P10. Scale bar: 20μm. (I) Number of VGluT1+ proprioceptive synapses onto the soma of L5 motor neurons from WT (n = 40 MNs, N = 4 mice) and SMA (n = 30 MNs, N = 3 mice) mice at P10. (J) First (black) and second (magenta) EPSP responses elicited in motor neurons after 10Hz dorsal root stimulation in P10 WT and SMA mice. Arrowheads indicate stimulus artefact. Vertical dotted line marks peak EPSP amplitude measured at 2.5ms after the onset of response. Scale bar: 2mV, 2.5ms. (K) Percentage changes in EPSP amplitude following 10 stimuli at 10Hz normalized to the first response for WT (n = 10) and SMA (n = 9) motor neurons at P10. Data represent means and SD. Statistical analysis was performed using Mann-Whitney test for (C, I), unpaired t test for (B, G), and simple linear regression (D, E).
Figure 6.
Figure 6.. Motor neurons innervating distal muscles exhibit signs of dysfunction in symptomatic SMA mice.
(A) Membrane responses to current injections in a WT and SMA L5 motor neurons at P10. Scale bars: 20mV, 400pA, 100ms. (B) Input resistance, (C) Time constant and (D) Rheobase for WT (n = 10 motor neurons) and SMA (n = 12) motor neurons at P10. At least N=4 mice used per genotype. (E) Intracellular responses (top) showing repetitive firing at the maximum frequency attained during current injection (bottom) and (F) Frequency-to-current relationship for WT (n = 9) and SMA (n = 12) at P10. Scale bar: 40mV, 500pA, 200ms. (G) Superimposed action potentials during steady-state firing following current injection in a WT (blue) and SMA (red) motor neuron at P10. Scale bar: 20mV, 2ms. (H) Duration at half-width of action potentials for WT (n = 10) and SMA (n = 12) motor neurons. (I) Single-optical-plane confocal images of L5 motor neurons (ChAT, blue) expressing Kv2.1 channels (white) from P10 WT and SMA mice. Scale bar: 20μm. (J) Percentage somatic coverage of Kv2.1 expression in WT (n = 40 MNs, N = 4 mice) and SMA motor neurons (n = 30 MNs, N = 3 mice). Data represent means and SD. Statistical analysis was performed using unpaired t test for (B,C,J), Mann-Whitney test for (D, F) and Welch’s t test for (H).
Figure 7.
Figure 7.. Proprioceptive synapses and Kv2.1 channels are reduced in motor neurons from Type I SMA patients.
(A) Confocal image of α-motor neurons (MNs) (ChAT+, NeuN+) and γ-motor neurons (ChAT+, NeuN−) in a human control spinal cord. Scale bar: 50μm. Number of thoracic α-motor neurons (B) and γ-motor neurons (C) per spinal cord section in control (N = 4 subjects) and Type I SMA patients (N = 5 patients). (D) Perimeter of thoracic motor neuron soma in control (n = 30 MNs, N = 3 subjects) and Type I SMA spinal cords (n = 30 MNs, N = 3 patients). (E) Confocal images of motor neurons (ChAT; green) with proprioceptive synapses (VGluT1; magenta) from postmortem human spinal cord sections from a control and Type I SMA patient. Arrowheads point to proprioceptive synapses. Scale bar: 20μm. (F) Number of proprioceptive synapses on spinal motor neurons from control (n = 43 MNs, N = 4 subjects) and SMA type I patients (n = 55 MNs, N = 6 patients). (G) Inhibitory synapses (VGAT; magenta) on motor neurons (ChAT; green) from a control and SMA Type I patient. Scale bar: 20μm. (H) Number of inhibitory synapses on motor neurons from control (n = 30 MNs, N = 3 subjects) and SMA Type I patients (n = 30 MNs, N = 3 patients). (I) Number of C-boutons onto lumbar lateral motor neurons of control (n = 10 MNs, N = 1 subject) and Type I SMA patient (n =10 MNs, N = 1 patient). (J) Single-optical-plane confocal images of motor neurons (ChAT; blue) expressing Kv2.1 channels (white) from a control and SMA Type I patient. Scale bar: 20μm. (K) Percentage somatic coverage of Kv2.1 expression in control (n = 5 MNs, N = 2 subjects) and SMA Type I patients (n = 5 MNs, N = 2 patients) lumbar motor neurons. Data represent means and SD. Statistical analysis was performed using Welch’s t test for (B, C, F, I, K) and unpaired t test for (D, H).

Update of

References

    1. Mentis GZ, et al. , Early functional impairment of sensory-motor connectivity in a mouse model of spinal muscular atrophy. Neuron, 2011. 69(3): p. 453–67. - PMC - PubMed
    1. Fletcher EV, et al. , Reduced sensory synaptic excitation impairs motor neuron function via Kv2.1 in spinal muscular atrophy. Nat Neurosci, 2017. 20(7): p. 905–916. - PMC - PubMed
    1. Shorrock HK, Gillingwater TH, and Groen EJN, Molecular Mechanisms Underlying Sensory-Motor Circuit Dysfunction in SMA. Front Mol Neurosci, 2019. 12: p. 59. - PMC - PubMed
    1. Buettner JM, et al. , Central synaptopathy is the most conserved feature of motor circuit pathology across spinal muscular atrophy mouse models. iScience, 2021. 24(11): p. 103376. - PMC - PubMed
    1. Mercuri E., et al. , Spinal muscular atrophy. Nat Rev Dis Primers, 2022. 8(1): p. 52. - PubMed