. 2025 Feb 21;11(8):eadq2475.
doi: 10.1126/sciadv.adq2475. Epub 2025 Feb 21.

SUMO2/3 conjugation of TDP-43 protects against aggregation

Affiliations

SUMO2/3 conjugation of TDP-43 protects against aggregation

Enza Maria Verde et al. Sci Adv. .

Abstract

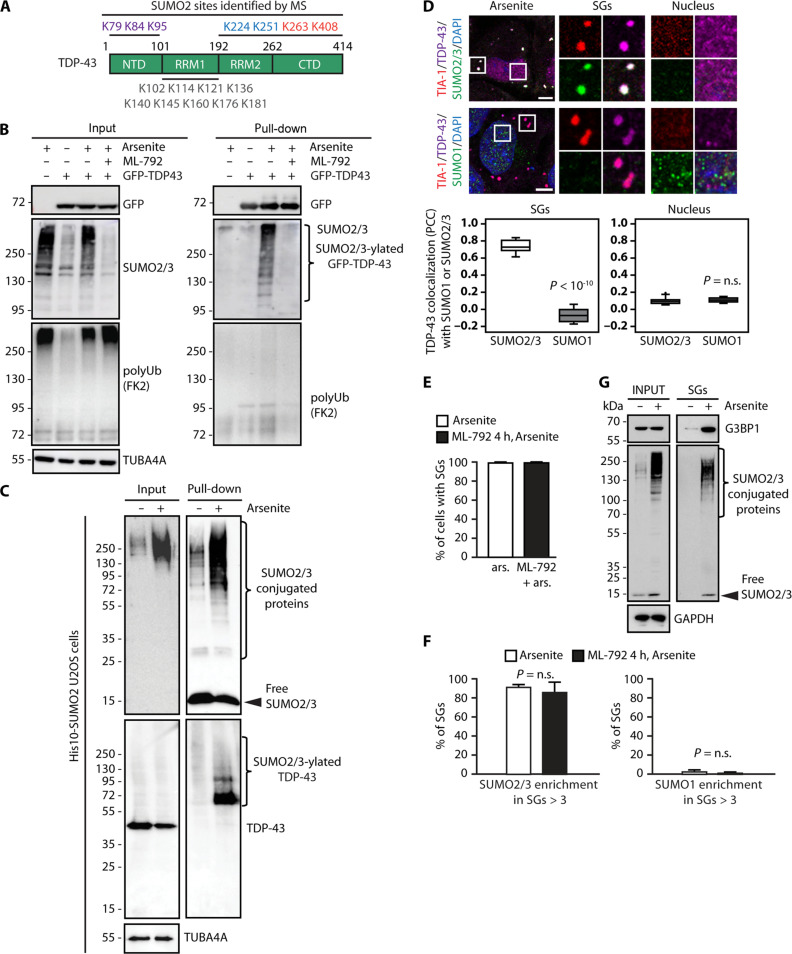
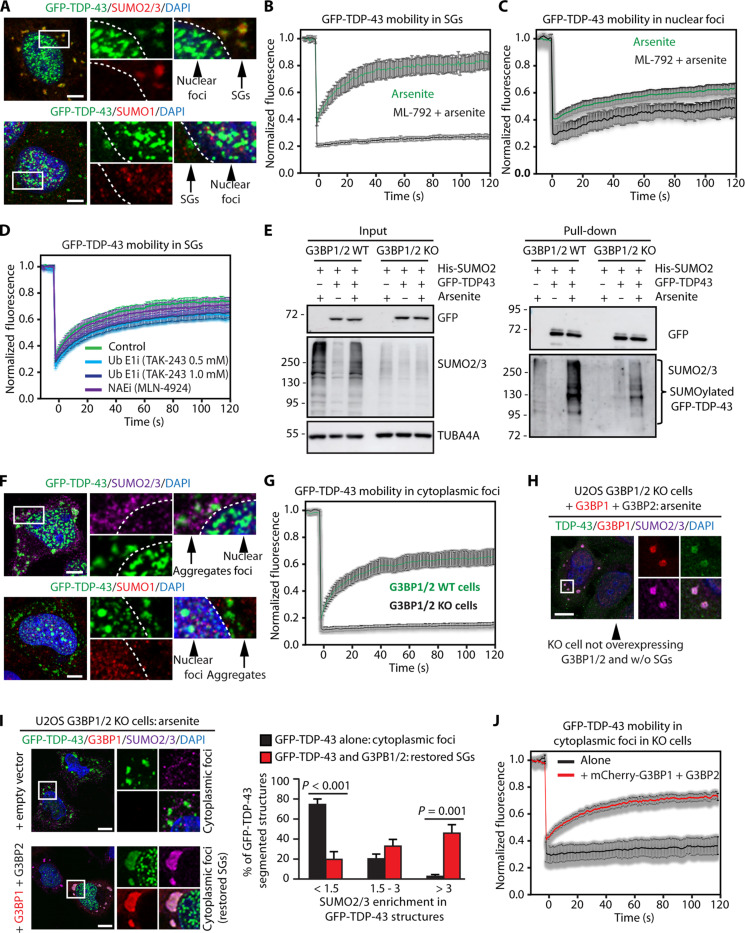
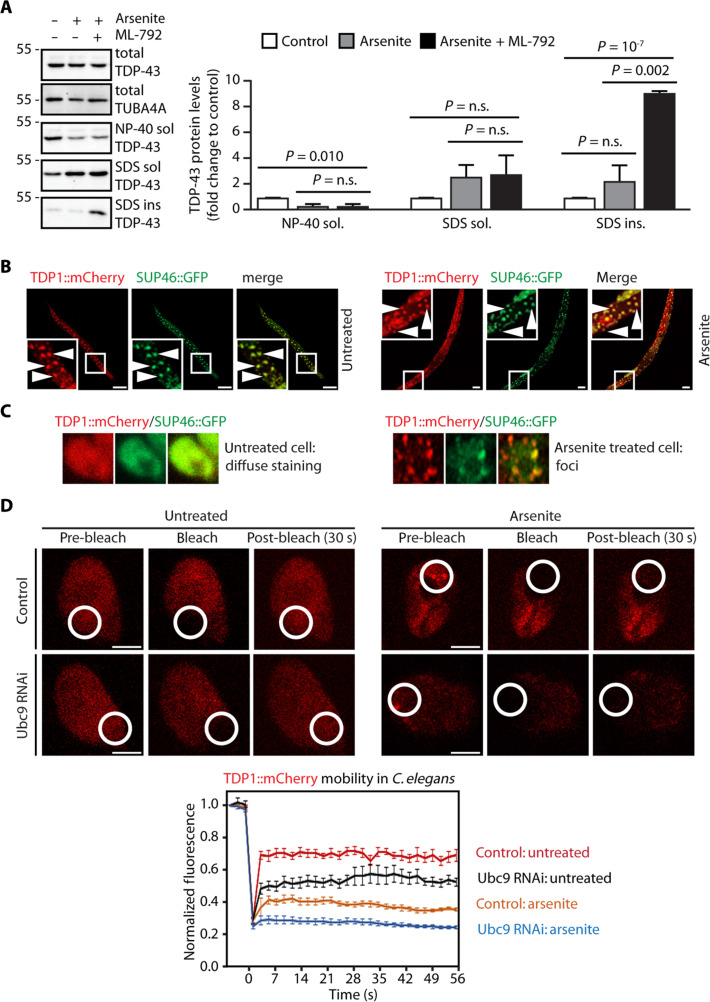
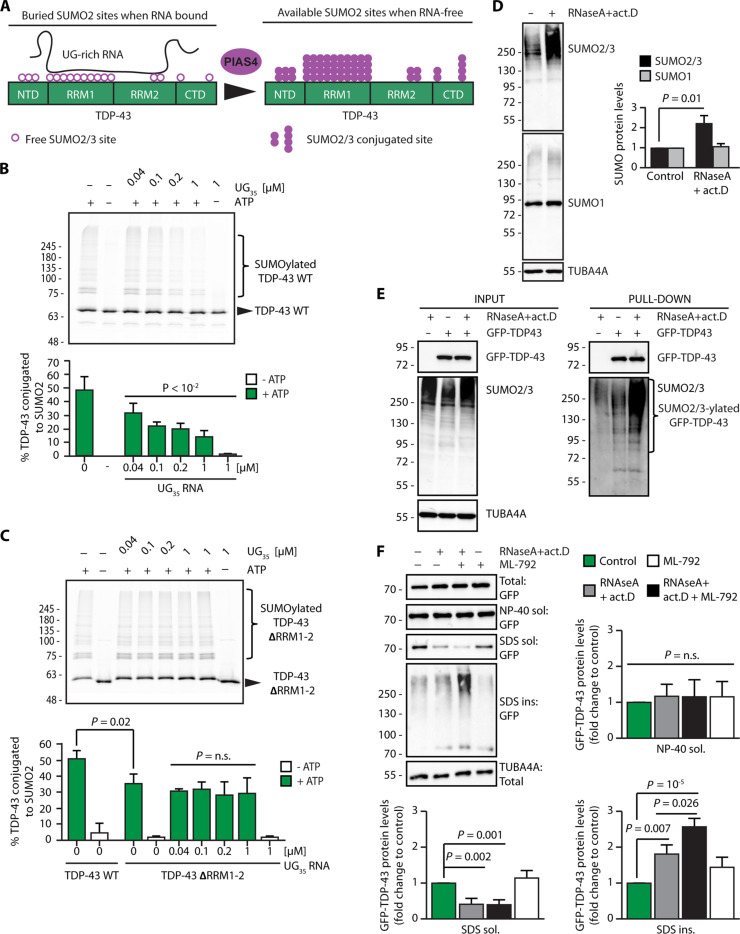
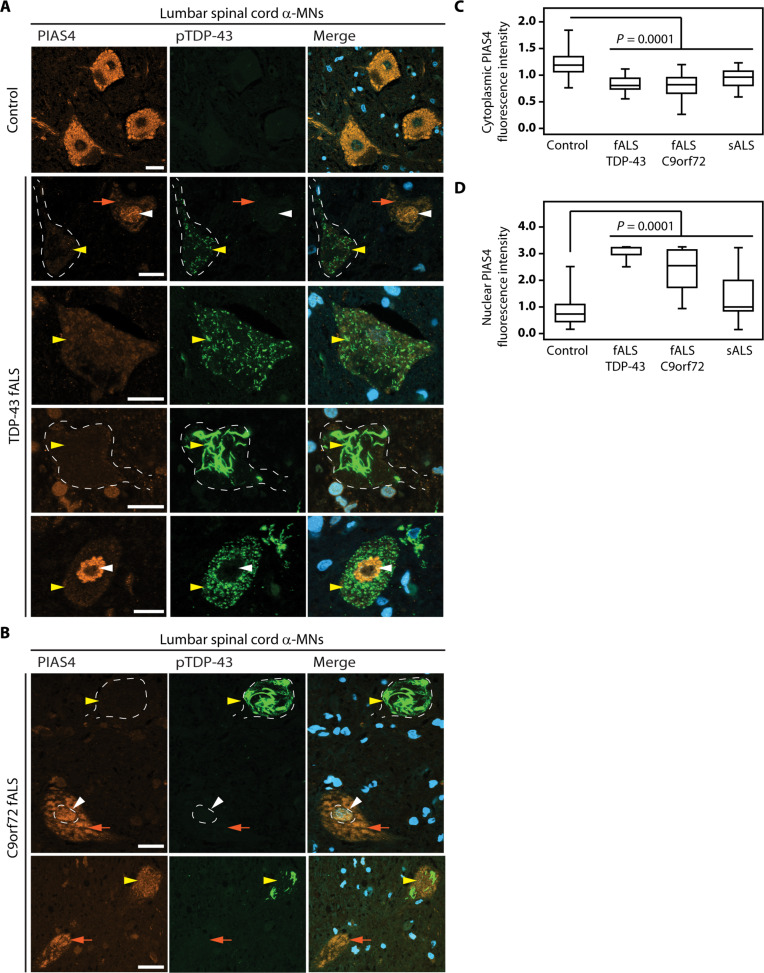
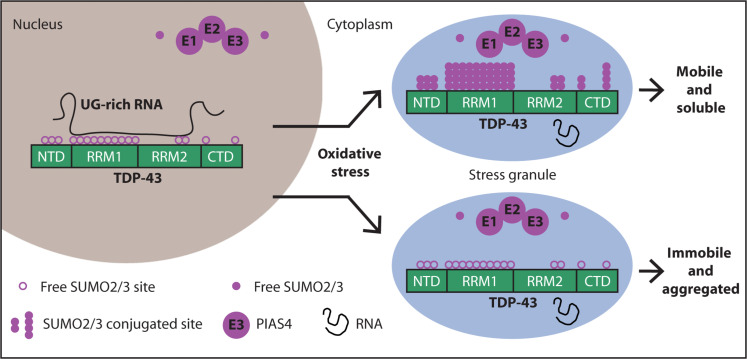
Cytosolic aggregation of the RNA binding protein TDP-43 (transactive response DNA-binding protein 43) is a hallmark of amyotrophic lateral sclerosis and frontotemporal dementia. Here, we report that during oxidative stress, TDP-43 becomes SUMO2/3-ylated by the SUMO E3 ligase protein PIAS4 (protein inhibitor of activated STAT 4) and enriches in cytoplasmic stress granules (SGs). Upon pharmacological inhibition of TDP-43 SUMO2/3-ylation or PIAS4 depletion, TDP-43 enrichment in SGs is accompanied by irreversible aggregation. In cells that are unable to assemble SGs, SUMO2/3-ylation of TDP-43 is strongly impaired, supporting the notion that SGs are compartments that promote TDP-43 SUMO2/3-ylation during oxidative stress. Binding of TDP-43 to UG-rich RNA antagonizes PIAS4-mediated SUMO2/3-ylation, while RNA dissociation promotes TDP-43 SUMO2/3-ylation. We conclude that SUMO2/3 protein conjugation is a cellular mechanism to stabilize cytosolic RNA-free TDP-43 against aggregation.


Figures

Fig. 1.
Fig. 1.. Upon oxidative stress, TDP-43 is SUMO2/3-ylated and colocalizes with SGs.
(A) Schematic representation of TDP-43 protein domains and the SUMO2 sites identified by mass spectrometry (13). (B) Immunoprecipitation under denaturing conditions of GFP-TDP-43 from U2OS cells untreated or treated with arsenite (500 μM, 1 hour), where indicated cells were incubated with ML-792 (2 μM, 2 hours), before the addition of arsenite. Immunoblots of denatured total protein (input) and beads (pull-down) fractions are shown. TUBA4A was used as loading control. (C) Ni-NTA pull-down of His-SUMO2 under denaturing conditions from His10-SUMO2 U2OS cells left untreated or treated with arsenite (500 μM, 1 hour). Immunoblots of total SUMO2/3 proteins and endogenous TDP-43 are shown. TUBA4A was used as loading control. (D) Confocal imaging of TIA-1, TDP-43, SUMO2/3, SUMO1, and DAPI in arsenite-treated U2OS cells. Colocalization of TDP-43 and SUMO1 or SUMO2/3 inside SGs and nuclei is shown (Pearson’s correlation coefficient/PCC; mean ± SEM; SUMO1: n = 2946 SGs, n = 228 nuclei; SUMO2/3: n = 1964 SGs, n = 203 nuclei). Student’s t test. Scale bar, 5 μm. (E) Percentage of HeLa Kyoto cells forming SGs following arsenite treatment alone or preceded by ML-792 pretreatment (mean ± SEM, n = 3). Student’s t test. (F) HeLa Kyoto cells were treated as reported in (E), followed by confocal imaging. The enrichment of SUMO1 and SUMO2/3 inside SGs is shown (mean ± SEM, n = 3. Total number of SGs analyzed: 10,859 to 11,896 for SUMO1; 11,345 to 12,296 for SUMO2/3). Fluorescence intensity >3 corresponds to SGs highly enriched for SUMO1 and SUMO2/3. One-way ANOVA, followed by Bonferroni-Holm post hoc test. (G) Immunoblots of total and SG-enriched fractions from His6-SUMO2-HEK293T cells untreated or treated with arsenite (500 μM, 1 hour). GAPDH was used as loading control.
Fig. 2.
Fig. 2.. SUMO2/3-ylation maintains TDP-43 mobility inside SGs.
(A) Confocal imaging of GFP-TDP-43, SUMO2/3, SUMO1, and DAPI in arsenite-treated U2OS cells. Scale bars, 5 μm. (B) FRAP curves of GFP-TDP-43 inside SGs in U2OS cells treated with arsenite alone or pretreated with ML-792 (mean ± SEM, n = 11 and 15). (C) FRAP curves of GFP-TDP-43 inside nuclear foci in U2OS cells treated with arsenite alone or pretreated with ML-792 (mean ± SEM, n = 15 and 21). (D) FRAP curves of GFP-TDP43 inside SGs in U2OS cells during arsenite stress with a pretreatment with either Ub E1i/TAK-243 or NAEi1/MLN-4924 (mean ± SEM, n = 12, control, or Ub E1i 0.5 μM, or 1.0 μM; n = 9, NAEi). (E) Immunoprecipitation under denaturing conditions of GFP-TDP-43 from U2OS G3BP1/2 WT and KO cells untreated or arsenite treated (500 μM, 1 hour). Immunoblots of denatured total protein (input) and beads (pull-down) fractions are shown. TUBA4A was used as loading control. (F) Confocal imaging of GFP-TDP-43, SUMO2/3, SUMO1, and DAPI in arsenite-treated U2OS G3BP1/2 KO cells. Scale bars, 5 μm. (G) FRAP curves of GFP-TDP-43 inside cytoplasmic foci in U2OS G3BP1/2 WT and KO cells treated with arsenite (mean ± SEM, n = 6 and 14, respectively). (H) Confocal imaging of overexpressed mCherry-G3BP1, endogenous TDP-43, SUMO2/3, and DAPI in U2OS G3BP1/2 KO arsenite-treated cells overexpressing mCherry-G3BP1 and G3BP2-myc-DDK (+ G3BP1 + G3BP2). The arrow indicates a nontransfected cell lacking SGs. Scale bar, 10 μm. (I) Confocal imaging of GFP-TDP-43, mCherry-G3BP1, SUMO2/3, and DAPI in U2OS G3BP1/2 KO cells overexpressing an empty vector or mCherry-G3BP1 and G3BP2-myc-DDK (+ G3BP1 + G3BP2) and arsenite treated. Quantification of SUMO2/3 enrichment inside GFP-TDP-43 aggregates and SGs (mean ± SEM, n = 4). One-way ANOVA, followed by Bonferroni-Holm post hoc test. Scale bars, 10 μm. (J) FRAP curves of GFP-TDP-43 inside cytoplasmic foci in U2OS G3BP1/2 KO cells transfected as described in (I) (mean ± SEM, n = 4 and 15).
Fig. 3.
Fig. 3.. TDP-43 aggregates upon SUMO2/3-ylation inhibition.
(A) Sequential fractionation of NP-40 soluble, SDS-soluble, and insoluble proteins from U2OS cells untreated or treated with arsenite with or without a pretreatment with ML-792 and quantification of endogenous TDP-43 protein levels, expressed as fold change compared to the control condition (mean ± SEM, n = 4). TUBA4A was used as loading control. One-way ANOVA, followed by Bonferroni-Holm post hoc test. (B) Confocal imaging of C. elegans overexpressing TDP1-mCherry and SUP-46-GFP untreated or arsenite treated. White arrowheads indicate somatic cells. Scale bars, 5 μm. (C) High magnification of one representative cell coexpressing TDP1-mCherry and SUP-46-GFP in untreated (left) or arsenite-treated (right) animals. (D) Representative images of FRAP experiments in TDP1-mCherry in Ubc9-proficient and -deficient (Ubc9 RNAi fed) worms untreated or arsenite treated. The bleached area is shown. Scale bars, 5 μm. FRAP curves of TDP1-mCherry in Ubc9-proficient and -deficient (Ubc9 RNAi fed) worms untreated or arsenite treated (mean ± SEM, n = 8 to 9).
Fig. 4.
Fig. 4.. Impact of K/R substitution on TDP-43 mobility and solubility upon oxidative stress.
(A) Confocal imaging of GFP-TDP-43 WT and the K/R variants, G3BP1, SUMO2/3, and DAPI in arsenite-treated U2OS cells. Scale bars, 5 μm. (B) Immunoprecipitation under denaturing conditions of GFP-TDP-43 WT and the K/R variants from U2OS cells treated with arsenite (500 μM, 1 hour). Immunoblots of denatured total protein (input) and beads (pull-down) fractions are shown. TUBA4A was used as loading control. (C) FRAP curves of GFP-TDP-43 WT and the K/R variants inside SGs in U2OS cells treated with arsenite (mean ± SEM, n = 9, WT; n = 12, N 3K/R; n = 16, RRM1 5K/R; n = 17, RRM1 10K/R). (D) Sequential fractionation of NP-40 soluble and insoluble proteins from U2OS cells overexpressing GFP-TDP-43 WT and RRM1 10K/R left untreated or treated with arsenite (500 μM, 1 hour). Where indicated, cells were allowed to recover for 4 hours following arsenite exposure (recovery); mean ± SEM, GFP-TDP-43 WT: n = 4, GFP-TDP-43 RRM1 10K/R: n = 3. One-way ANOVA, followed by Bonferroni-Holm post hoc test. TUBA4A was used as loading control. (E and F) Immunoprecipitation under denaturing conditions of GFP-TDP-43 WT and the RRM2 2K/R variant or the N- and C-terminal variants from U2OS cells treated with arsenite (500 μM, 1 hour). Immunoblots of denatured total protein (input) and beads (pull-down) fractions are shown. TUBA4A was used as loading control. (G) FRAP curves of GFP-TDP-43 WT and the RRM2 2K/R variant or the N- and C-terminal variants inside SGs in U2OS cells treated with arsenite (mean ± SEM, n = 7, WT; n = 14, RRM2 2K/R; n = 15, K263R; n = 14, C 2K/R; n = 16, K408R; n = 20, N-C 5K/R).
Fig. 5.
Fig. 5.. PIAS4 SUMO2-ylates TDP-43 and maintains TDP-43 solubility upon oxidative stress.
(A) FRAP curves of GFP-TDP43 inside arsenite-induced SGs in U2OS cells transfected with the indicated siRNAs (mean ± SEM, n = 12, siRNA control; n = 12, siRNA PIAS1; n = 12, siRNA PIAS3; n = 16, siRNA PIAS4). (B) FRAP curves of GFP-TDP43 inside nuclear foci during arsenite stress in U2OS cells transfected with the indicated siRNAs (mean ± SEM, n = 9, siRNA control; n = 10, siRNA PIAS1; n = 6, siRNA PIAS3; n = 5, siRNA PIAS4). (C) FRAP curves of mCherry-G3BP1 inside arsenite-induced SGs in U2OS cells transfected with the indicated siRNAs (mean ± SEM, n = 6, siRNA control; n = 5, siRNA PIAS1; n = 7, siRNA PIAS3; n = 7, siRNA PIAS4). (D) Immunoprecipitation of FLAG-TDP-43 under nondenaturing conditions from U2OS cells untreated or arsenite treated (500 μM, 1 hour). Immunoblots of NP-40 soluble proteins (input) and beads (pull-down) fractions are shown. TUBA4A was used as loading control. (E) In vitro SUMO2-ylation of TDP-43-GFP in the absence or presence of either recombinant PIAS4, RanBP2, or ATP and quantification (mean ± SEM, n = 3). One-way ANOVA, followed by Bonferroni-Holm post hoc test. (F) Sequential fractionation of NP-40 soluble, SDS soluble and insoluble proteins from PIAS4-proficient and deficient U2OS cells left untreated or arsenite treated (500 μM, 1 hour) and quantification of GFP-TDP-43 protein levels (mean ± SEM, n = 4). TUBA4A was used as loading control. One-way ANOVA, followed by Bonferroni-Holm post hoc test.
Fig. 6.
Fig. 6.. SUMO2/3-ylation protects RNA-unbound TDP-43 from aggregation.
(A) Schematic model showing that binding of TDP-43 to UG-rich RNA masks the K residues located in the two RRMs, while loss of RNA binding makes them available for SUMO2/3-ylation. (B) Representative image and quantification of the percentage of in vitro SUMO2-ylated TDP-43-GFP by PIAS4 in the absence of UG35 RNA (column 1) and in the presence of increasing concentrations of UG35 RNA (columns 3 to 7). Where indicated, (−) ATP was omitted from the reaction mixture (columns 2 and 7) (mean ± SEM, n = 3). One-way ANOVA, followed by Bonferroni-Holm post hoc test. (C) Representative image and quantification of the percentage of in vitro SUMO2-ylated TDP-43-GFP-ΔRRM1-2 by PIAS4 in the absence or presence of ATP; where indicated, increasing concentrations of UG35 RNA were added; quantification of the SUMO2-ylated TDP-43-GFP-ΔRRM1-2 versus WT is also shown (mean ± SEM, n = 3). One-way ANOVA, followed by Bonferroni-Holm post hoc test. (D) Immunoblots of U2OS cells untreated or treated with RNase A (10 μM) and actinomycin D (4 μM) for 2 hours (mean ± SEM, n = 3). TUBA4A was used as loading control. One-way ANOVA, followed by Bonferroni-Holm post hoc test. (E) Immunoprecipitation under denaturing conditions of GFP-TDP-43 from U2OS cells treated as described in (D). Immunoblots of total protein (input) and beads (pull-down) fractions are shown. TUBA4A was used as loading control. (F) Sequential fractionation of NP-40 soluble, SDS-soluble, and insoluble proteins from U2OS cells overexpressing GFP-TDP43 and either left untreated or treated with RNase A (10 μM) and actinomycin D (4 μM) for 2 hours, alone or with a pretreatment with ML-792 (2 μM) for 2 hours. Quantification of GFP-TDP-43 levels in the NP-40 soluble, SDS-soluble, and insoluble fractions, expressed as fold change compared to the control condition (mean ± SEM, n = 5). TUBA4A was used as loading control. One-way ANOVA, followed by Bonferroni-Holm post hoc test.
Fig. 7.
Fig. 7.. Inhibition of SUMO-ylation affects SG dynamics and TDP-43 mobility in neuronal and ALS patient cells.
(A) Confocal imaging of endogenous TDP-43, SUMO1, SUMO2/3, TIA-1, and DAPI in iPSC-MNs differentiated for 12 days (D12) and either left untreated or exposed to arsenite (500 μM, 45 min). Average enrichment of TDP-43, SUMO1, and SUMO2/3 inside TIA-1–positive SGs is shown (mean ± SEM, n = 215, TDP-43; n = 215, SUMO2/3; n = 175, SUMO1). Scale bars, 5 μm. (B) Percentage of PLA foci/cell in iPSC-MN progenitors (D3) and iPSC-MNs (D12) untreated or arsenite-treated (500 μM, 45 min) and incubated with TDP-43 and SUMO2/3 antibodies (mean ± SEM, n = 3). Total number of cells analyzed: n = 613 (D3) and 338 (D12), control; n = 971 (D3) and 387 (D12), arsenite. One-way ANOVA, followed by Bonferroni-Holm post hoc test. (C) Quantification of the percentage of SG-positive iPSC-MNs (D12) that were exposed to arsenite (500 μM, 45 min), followed by recovery in drug-free medium for 2 hours (rec. control) or to a treatment with ML-792 (2 μM) and arsenite, followed by recovery with ML-792 (2 μM) for 2 hours (rec. ML-792). Mean ± SEM, n = 3. Student’s t test. (D) Quantification of the % of persisting SGs with enrichment of TDP-43 higher than 1.5 in iPSC-MNs (D12) treated as described in (C) (mean ± SEM, n = 3. Total number of SGs analyzed: 10,859 to 11,896 for SUMO1; 11,345 to 12,296 for SUMO2/3). Fluorescence intensity >1.5 corresponds to SGs with moderate to high enrichment of TDP-43. Student’s t test. (E) Immunoprecipitation under denaturing conditions of overexpressed GFP-tagged TDP-43, TDP-35, and TDP-25 in U2OS cells treated with arsenite. Immunoblots of total protein (input) and beads (pull-down) fractions are shown. TUBA4A was used as loading control. (F) Confocal imaging of GFP-tagged TDP-35 and TDP-25, G3BP1, SUMO2/3, and DAPI in arsenite-treated U2OS cells. Scale bars, 5 μm. (G) FRAP curves of overexpressed GFP-tagged TDP-43, TDP-35, and TDP-25 in U2OS cells treated with arsenite (mean ± SEM, n = 6, GFP-TDP-43; n = 15, GFP-TDP-35; n = 9, GFP-TDP-25).
Fig. 8.
Fig. 8.. Reduced cytoplasmic PIAS4 immunoreactivity in human ALS lumbar spinal cord α-MNs with TDP-43 pathology.
(A and B) Double immunofluorescence labeling performed on control and fALS (with mutations in the gene coding for TDP-43 and C9orf72, respectively) lumbar spinal cord α-MNs using PIAS4 and phospho Ser409/410 TDP-43 (pTDP-43) antibodies showing a variable pattern of immunoreactivity. Note the overall reduced cytoplasmic PIAS4 immunoreactivity and increased nuclear PIAS4 immunoreactivity (white arrowheads) in fALS α-MNs. α-MNs harboring pTDP-43 aggregates showed markedly reduced levels of PIAS4 (yellow arrowheads). fALS α-MNs showing moderately elevated levels of PIAS4 were devoid of pTDP-43 aggregates (orange arrows). Scale bars, 30 μm (C and D) Quantification of PIAS4 immunoreactivity in lumbar spinal cord MNs [as shown in (A) and (B)]. Number of α-MNs counted: 992 from four age-matched controls; 159 from two patients with fALS TDP-43; 427 from five patients with fALS C9orf72; 528 from eight patients with sALS. One-way ANOVA, followed by Brown-Forsythe and Welch ANOVA tests, multiple comparisons, P = 0.0001 compared to control cases, using GraphPad Prism6 software.
Fig. 9.
Fig. 9.. SUMO2/3-ylation protects RNA-free TDP-43 from aggregation upon oxidative stress.
When cells are not subjected to stress, TDP-43 is mainly localized inside the nucleus, where it binds with high affinity to UG-rich RNA. RNA masks the K residues located in the RRM1 and RRM2, reducing the access to PIAS4. Upon oxidative stress, a fraction of TDP-43 translocates into the cytoplasm, where it localizes inside SGs along with the SUMO machinery (free SUMO2/3, E1, E2 and E3 enzymes, including PIAS4). RNA-free TDP-43 molecules can be efficiently conjugated to SUMO2/3 by PIAS4, thereby protecting TDP-43 from immobilization inside SGs and aggregation.

References

    1. Ling S. C., Polymenidou M., Cleveland D. W., Converging mechanisms in ALS and FTD: Disrupted RNA and protein homeostasis. Neuron 79, 416–438 (2013). - PMC - PubMed
    1. Hergesheimer R. C., Chami A. A., de Assis D. R., Vourc’h P., Andres C. R., Corcia P., Lanznaster D., Blasco H., The debated toxic role of aggregated TDP-43 in amyotrophic lateral sclerosis: A resolution in sight? Brain 142, 1176–1194 (2019). - PMC - PubMed
    1. Portz B., Lee B. L., Shorter J., FUS and TDP-43 phases in health and disease. Trends Biochem. Sci. 46, 550–563 (2021). - PMC - PubMed
    1. Cook C. N., Wu Y., Odeh H. M., Gendron T. F., Jansen-West K., Del Rosso G., Yue M., Jiang P., Gomes E., Tong J., Daughrity L. M., Avendano N. M., Castanedes-Casey M., Shao W., Oskarsson B., Tomassy G. S., McCampbell A., Rigo F., Dickson D. W., Shorter J., Zhang Y. J., Petrucelli L., C9orf72 poly(GR) aggregation induces TDP-43 proteinopathy. Sci. Transl. Med. 12, eabb3774 (2020). - PMC - PubMed
    1. Klaips C. L., Jayaraj G. G., Hartl F. U., Pathways of cellular proteostasis in aging and disease. J. Cell Biol. 217, 51–63 (2018). - PMC - PubMed

MeSH terms

LinkOut - more resources