. 2025 Mar 11;20(3):102420.
doi: 10.1016/j.stemcr.2025.102420. Epub 2025 Feb 20.

An efficient, non-viral arrayed CRISPR screening platform for iPSC-derived myeloid and microglia models

Affiliations

An efficient, non-viral arrayed CRISPR screening platform for iPSC-derived myeloid and microglia models

Sonja Meier et al. Stem Cell Reports. .

Abstract

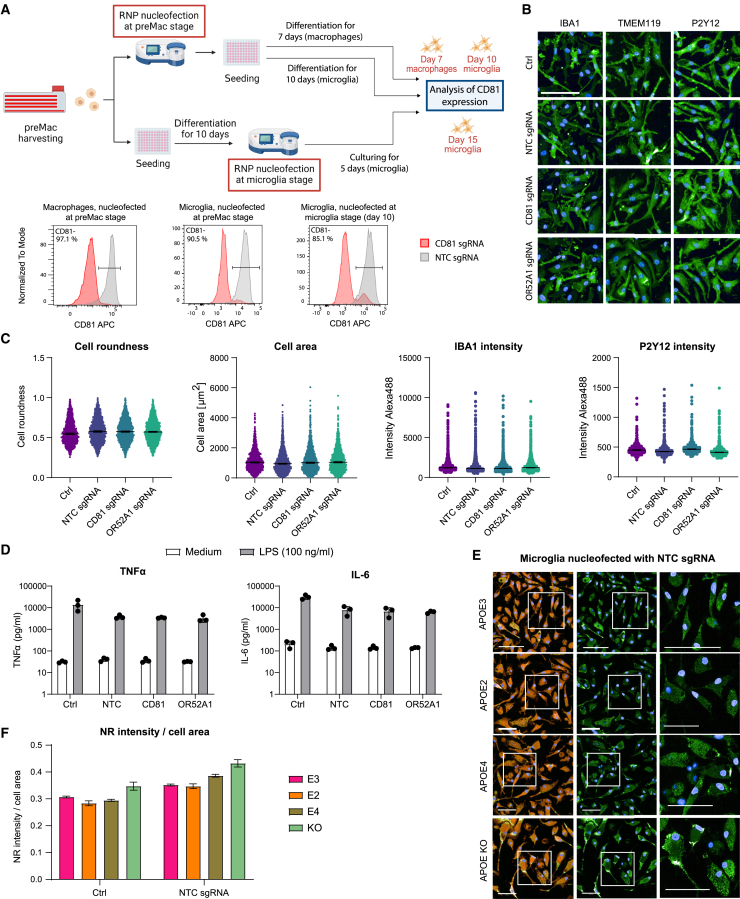
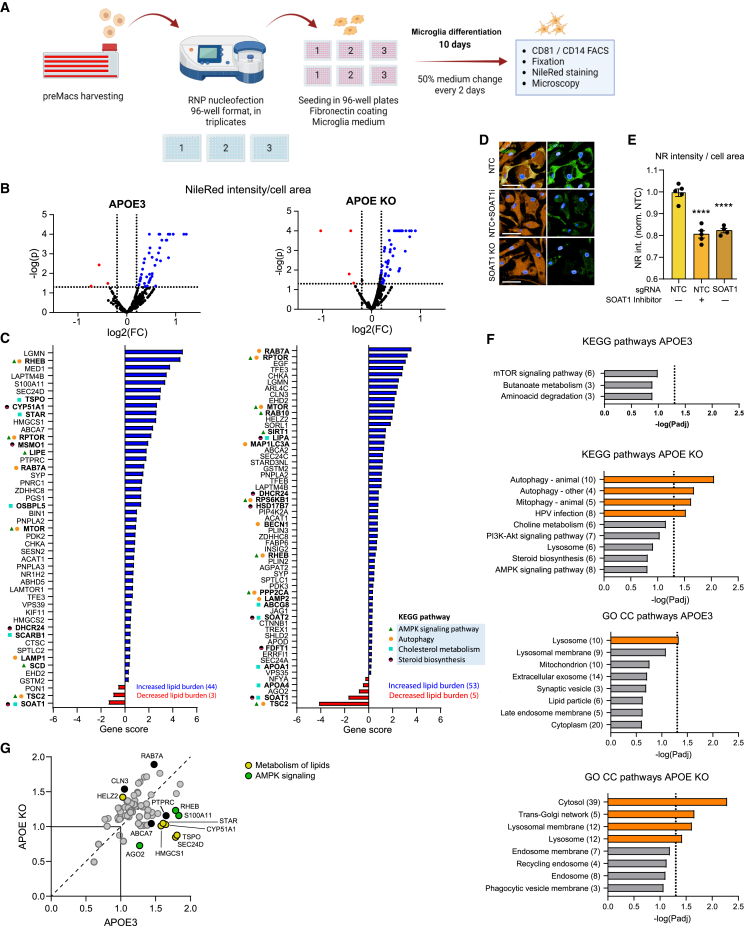
Here, we developed a CRISPR-Cas9 arrayed screen to investigate lipid handling pathways in human induced pluripotent stem cell (iPSC)-derived microglia. We established a robust method for the nucleofection of CRISPR-Cas9 ribonucleoprotein complexes into iPSC-derived myeloid cells, enabling genetic perturbations. Using this approach, we performed a targeted screen to identify key regulators of lipid droplet formation dependent on Apolipoprotein E (APOE). We identify the Mammalian Target of Rapamycin Complex 1 (mTORC1) signaling pathway as a critical modulator of lipid storage in both APOE3 and APOE knockout microglia. This study is a proof of concept underscoring the utility of CRISPR-Cas9 technology in elucidating the molecular pathways of lipid dysregulation associated with Alzheimer's disease and neuroinflammation.

Keywords: APOE; CRISPR-Cas9 gene editing; arrayed genetic screening; iPSC-derived microglia; lipid accumulation; lipid droplet screen; lipid metabolism; lipid regulation; lysosome; mTORC1.


Conflict of interest statement

Declaration of interests F.W., N.M., L.T., E.S.M., L.C., F.R., and R.J. are employees of F. Hoffman-La Roche Ltd. S.M., A.S.G.L., and A.M. were employees of F. Hoffman-La Roche Ltd at the time of the study. The design, research conduct, and financial support for this study were provided by F. Hoffman-La Roche Ltd. F.R. and R.J. are shareholders of F. Hoffman-La Roche Ltd. M.K. is a co-scientific founder of Montara Therapeutics; serves on the scientific advisory boards of Engine Biosciences, Casma Therapeutics, Alector, Montara Therapeutics, and Neurocrine Biosciences; and is an advisor to Modulo Bio and Recursion Therapeutics. M.K. is an inventor on the US Patent 11,254,933 related to CRISPRi and CRISPRa screening.

Figures

Figure 1
Figure 1
APOE regulates intracellular lipid accumulation and cell size in iPSC-derived microglia (A) Representative images of iPSC microglia stained with Nile red (NR) and imaged at 488 nm (non-polar lipids) and 594 nm (polar lipids). Scale bar: 50 μm. (B) NR intensity and number of spots (488 nm) normalized to cell area (594 nm) or per quantified number of cells (DAPI). Different shades of blue indicate 3 independent biological experiments of minimum 3 technical replicates. Biological replicates are defined as independent differentiations from the preMac stage to microglia. Data are normalized to APOE3 for each experiment. One-way ANOVA for paired values across experiments was performed, followed by Dunnett’s multiple comparison correction. Box plots represent median with minimum and maximum values; ∗ indicates p < 0.05, ∗∗∗ p < 0.001, and ∗∗∗∗ p < 0.0001.
Figure 2
Figure 2
CRISPR-Cas9 RNP nucleofection can effectively edit iPSC-derived microglia, macrophages, or preMacs (A) Microglia or preMacs before differentiation were nucleofected with Cas9 RNPs containing non-targeting control (NTC) or CD81 sgRNA. CD81 expression was analyzed after 7 days (preMacs to macrophages), 10 days (preMacs to microglia), or 5 days (mature microglia; left to right) by flow cytometry. (B) Representative images of day 10 microglia stained for AIF1/IBA1, TMEM119, and P2Y12 after nucleofection at preMac stage with RNPs containing NTC, CD81, or OR52A1 sgRNA. Ctrl, non-nucleofected cells. Scale bar: 100 μm. (C) Quantification of immunofluorescence single-cell data with population median and 95% confidence interval. (D) Microglia treated with 100 ng/mL LPS for 6 h before supernatant collection for Luminex cytokine measurement. Data are from three independent experiments represented as mean ± SEM. (E) NR staining of microglia nucleofected at preMac stage with RNPs containing NTC sgRNA. Scale bar: 50 μm. (F) Quantification of NR intensity (488 nm) per cell area, normalized to APOE3 Ctrl. Data are shown for one experiment with 3 technical replicates representative for two independent experiments and is represented as mean ± SEM.
Figure 3
Figure 3
Arrayed lipid droplet screen in APOE3 and APOE KO microglia (A) Schematic representation of the arrayed CRISPR-Cas9 screen workflow. (B) Volcano plots indicating significant hits for APOE3 and APOE KO for Nile red (NR) intensity quantification. Red and blue dots indicate significant hits with a decrease or increase in NR intensity of at least 15%. Data averaged from three nucleofection experiments per gene. Every gene was analyzed for significance separately for each experiment with paired one-way ANOVA and comparison to NTC on each plate. (C) Gene scores for significant hits of APOE3 and APOE KO. Gene score = log2(FC) −log(p). Blue bar color indicates increased NR intensity per cell area, and red bar color indicates decreased intensity. (D and E) Effect of SOAT1 KO on NR intensity per cell area in BIONi010-C (APOE3/4) microglia. Inhibitor treatment: SOAT1 inhibitor (K604) 500 nM for 2 days. Two-way ANOVA with Sidak post hoc test was performed. Data represents mean ± SEM, and ∗∗∗∗ p < 0.0001. (F) KEGG pathway and Gene Ontology (GO)-term cellular component (GO CC) analysis using DAVID Bioinformatics Database (version 2021; threshold 2; EASE 0.25; Benjamini correction) of significant hits on the background of the genes and corresponding pathways represented in the focused library. (G) Correlation plot of hits APOE3 vs. APOE KO for NR intensity. Only hits that did not reduce cell number in both lines were analyzed. A two-way ANOVA was used to determine significant differences between the genetic lines (black or colored circles, significant; gray circles, non-significant).
Figure 4
Figure 4
mTORC1 regulates lipid droplet accumulation and cell size in iPSC-derived microglia (A) Schematic representation of the mTORC1 pathway and the effect of KO on lipid load as identified in the CRISPR-Cas9 arrayed screen. (B) Report of fold change and p values for mTORC1 signaling pathway components tested in the CRISPR-Cas9 arrayed screen. (C) Validation of RHEB and TSC2 KO on lipid phenotype in microglia from BIONi010-C line measured by Nile red (NR) staining. Rapamycin treatment with 2 nM for 24 h or 5 days before analysis (NTC: non-targeted control sgRNA). (D) Western blot for TSC2, RHEB, p-S6, and S6 in BIONi010-C microglia. (E and F) Quantification of NR intensity (488 nm) and cell area (594 nm) of images shown in (C). Data are representative of 2 independent experiments, and plotted as mean ± SEM.

References

    1. Drager N.M., Sattler S.M., Huang C.T., Teter O.M., Leng K., Hashemi S.H., Hong J., Aviles G., Clelland C.D., Zhan L., et al. A CRISPRi/a platform in human iPSC-derived microglia uncovers regulators of disease states. Nat. Neurosci. 2022;25:1149–1162. doi: 10.1038/s41593-022-01131-4. - DOI - PMC - PubMed
    1. Freund E.C., Lock J.Y., Oh J., Maculins T., Delamarre L., Bohlen C.J., Haley B., Murthy A. Efficient gene knockout in primary human and murine myeloid cells by non-viral delivery of CRISPR-Cas9. J. Exp. Med. 2020;217 doi: 10.1084/jem.20191692. - DOI - PMC - PubMed
    1. Greenspan P., Mayer E.P., Fowler S.D. Nile red: a selective fluorescent stain for intracellular lipid droplets. J. Cell Biol. 1985;100:965–973. doi: 10.1083/jcb.100.3.965. - DOI - PMC - PubMed
    1. Gutbier S., Wanke F., Dahm N., Rümmelin A., Zimmermann S., Christensen K., Köchl F., Rautanen A., Hatje K., Geering B., et al. Large-Scale Production of Human iPSC-Derived Macrophages for Drug Screening. Int. J. Mol. Sci. 2020;21 doi: 10.3390/ijms21134808. - DOI - PMC - PubMed
    1. Hosios A.M., Wilkinson M.E., McNamara M.C., Kalafut K.C., Torrence M.E., Asara J.M., Manning B.D. mTORC1 regulates a lysosome-dependent adaptive shift in intracellular lipid species. Nat. Metab. 2022;4:1792–1811. doi: 10.1038/s42255-022-00706-6. - DOI - PMC - PubMed

Publication types

MeSH terms

Substances

LinkOut - more resources