. 2025 May:126:342-355.
doi: 10.1016/j.bbi.2025.02.019. Epub 2025 Feb 19.

Patient-derived monoclonal LGI1 autoantibodies elicit seizures, behavioral changes and brain MRI abnormalities in rodent models

Affiliations

Patient-derived monoclonal LGI1 autoantibodies elicit seizures, behavioral changes and brain MRI abnormalities in rodent models

Manoj Upadhya et al. Brain Behav Immun. 2025 May.

Abstract

Objective: Limbic encephalitis with leucine-rich glioma inactivated 1 (LGI1) protein autoantibodies is associated with cognitive impairment, psychiatric symptoms, and seizures, including faciobrachial dystonic seizures (FBDS). Patient-derived LGI1-autoantibodies cause isolated symptoms of memory deficits in mice and seizures in rats. Using a multimodal experimental approach, we set out to improve the validity of existing in vivo rodent models to further recapitulate the full clinical syndrome of anti-LGI1 antibody mediated disease.

Methods: A monoclonal anti-LGI1 antibody (anti-LGI1 mAb) derived from a patient's CSF antibody-secreting cell was infused intracerebroventricularly (ICV) into rats and mice for one or two weeks, respectively. Cellular excitability of CA3 pyramidal neurons was determined in hippocampal slices. Structural changes in mouse brains were explored using MRI. Antibody effects on behavior and brain activity of rats were studied using video-EEG.

Results: Anti-LGI1 mAbs augmented the excitability of CA3 pyramidal neurons and elicited convulsive and non-convulsive spontaneous epileptic seizures in mice and rats. Mice displayed a hypoactive and anxious phenotype during behavioral testing. MRI revealed acutely increased hippocampal volume after ICV anti-LGI1 mAb infusion. Video-EEG recordings of juvenile rats uncovered two peaks of seizure frequency during the 7-day antibody infusion period resembling the natural progression of seizures in human anti-LGI1 encephalitis.

Interpretation: Our data strongly corroborate and extend our understanding of the direct pathogenic and epileptogenic role of human LGI1 autoantibodies.

Keywords: Animal model; Human monoclonal antibody; LGI1; Limbic encephalitis; Seizure.


Conflict of interest statement

Declaration of competing interest The authors declare that they have no known competing financial interests or personal relationships that could have appeared to influence the work reported in this paper.

Figures

Fig. 1
Fig. 1. Behavioral effects and MRI changes following intrathecal infusion of monoclonal human LGI1 autoantibodies into mice.
(A) Marked loss of body weight in mice receiving intracerebroventricular administration of anti-LGI1 antibodies compared to controls (mean ± standard error of the mean [SEM] from 14 animals per group from days 0 to 14 [multiple t-test comparisons: *p < 0.05, **p < 0.01, ***p < 0.001, ****p < 0.0001]). (B) Representative recordings of Open Field test tracks from mice receiving control (left) or anti-LGI1 mAbs (middle). In individual mice, seizures led to reduced post-ictal motility (right). (C, D) Increased latency to visit the center area of the open field (C, p = 0.0413) and reduced mean time in the center area (D, p = 0.0178) in anti-LGI1 mAb treated compared to control mice, indicating anxiety-like behavior. (E) Unchanged mean velocity indicates normal (loco)motor function. (F, G) In the three-chamber test, mice of both groups spent the same time with a first stranger mouse (F), but latency to make contact was markedly increased in anti-LGI1 mAb-treated animals, indicating potential deficits in sociability (p = 0.0358, G). (H, I) Introduction of a second stranger mouse led to increased investigation by LGI1 mAb-infused mice, indicating increased interest in social novelty (p = 0.0300, H). Latency to make contact with the novel intruder was unchanged; one mouse did not move and therefore gave the high value (600 s) in the LGI1 group (I). (J, K) Representative T2w anatomical MR images (n = 13 animals per group; 40 slices per brain) of mice treated with either control or anti-LGI1 mAbs (J). Quantification showed significantly increased hippocampal volumes and subtly reduced pontine volumes after treatment with anti-LGI1 mAbs (K, t-test comparisons; FDR correction = 0.1; significance levels *p < 0.05, **p < 0.01, ***p < 0.001, ****p < 0.0001).
Fig. 2
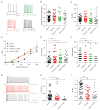
Fig. 2. In vivo treatment with anti-LGI1 mAbs in mice increases excitability and bursting of CA3 pyramidal neurons.
(A) Example traces of cell responses during depolarizing current steps (40pA and 120pA). Black: control; red: slices from anti-LGI1 mAb treated mice; green: slices from anti-LGI1 mAb treated mice after DTX-K (100 nM) wash-in; gray: slices from control mice after DTX-K wash-in. Scale bar: 20 mV/0.2 s. (B, C) Resting membrane potential (B, ANOVA (Kruskal-Wallis test): p = 0.8251) and input resistance (C, ANOVA (Kruskal-Wallis-Test): p = 0.3968) were not altered with LGI or DTX-K treatment. (D) AP number/current intensity relationship displays a significant increase in excitability when mice were perfused anti-LGI1 mAb or slices treated with DTX-K. Data points represent mean ± SEM. 2-way-ANOVA, Dunnet’s multiple comparison test: 120pA: control vs LGI * (CI −12.82 to −0.3107) control vs control DTX * (CI = −14.47 to −0.6777); 200pA: control vs. control DTX * (CI: −14.10 to −0.3111). (E) The number of spikes elicited by 120pA current injection was significant higher when mice were perfused with anti-LGI1 mAb or slices treated with DTX-K: ANOVA (Kruskal-Wallis-Test): p = 0.0027; Dunnet’s multiple comparison Test: *p < 0.05; **p < 0.01.
Fig. 3
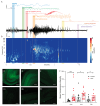
Fig. 3. Electroclinical features of anti-LGI1 mAb rat seizure model.
(A) Example EEG trace (black) from anti-LGI1 mAb infused rat recorded from depth electrode placed in CA3 region of hippocampus with highlighted, color-coded breakdown of seizure EEG features at different phases of the seizure. (B) Temporally aligned time–frequency plot, illustrating the spectral evolution of the EEG signal. (C) Confocal image of CA3 region of hippocampus from sagittal brain slice prepared 14 days after 7-day infusion of anti-LGI1 mAbs with accompanying image of CA3 in control mAb infused brain slice (Ci). Scale bar 250 µm. (D) Confocal image of CA1 region of hippocampus from sagittal brain slice prepared 14 days after 7 day infusion of anti-LGI1 mAbs with accompanying image of CA3 in control mAb infused brain slice (Di). Scale bar 250 µm. (E) Confocal image of dentate gyrus (DG) of hippocampus from sagittal brain slice prepared 14 days after 7-day infusion of anti-LGI1 mAbs with accompanying image of CA3 in control mAb infused brain slice (Ei). Scale bar 250 µm. (F) Mean fluorescence intensity of CA3, CA1 and DG of brain slices infused for 7 days with anti-LGI1 or control mAb. Data is expressed as mean ± SEM of anti-LGI1 mAb in CA3 and CA1 (n = 20) and anti-LGI1 mAb in DG (n = 19) and for control mAb in CA3, CA1 and DG (n = 11). (***p < 0.001, *p < 0.05; Mann Whitney t-test). Measurements shown as mean ± SEM. Green fluorescence staining represents human LGI1-antibody binding.
Fig. 4
Fig. 4. EEG of anti-LGI1 mAb seizures in rats show a bimodal peak during antibody infusion and deterioration of interictal/baseline EEG over time.
(A) The median hourly number of 1-second ictal EEG events per hour in anti-LGI1 mAb-infused rats over time (n = 6) as detected by automated seizure detection software (Opensource Instruments). No ictal events were seen in the control rats(n = 5). (B) PSBB scores as measures of hyperexcitable behavior in anti-LGI1 mAb-infused rats (n = 6) as compared to controls (n = 5) using the PSBB (post-seizure behavioral battery) test (**p < 0.001; 2-way ANOVA with Bonferroni multiple comparisons test). The dotted line in both graphs represents the end of the 7-day antibody infusion. Measurements shown as median or mean ± SEM. (C) Median number of seizures per hour (concatenating individual ictal events) over the duration of antibody infusion (dotted line represents end of antibody infusion). (D) Daily comparison of seizure frequency (***p < 0.001; Ordinary one-way ANOVA). Measurements shown as mean ± SEM. (E) EEG coastline length (calculated per hour for entire 21-day recording period for each animal) in anti-LGI1 mAb-infused (n = 6) and control mAb-infused animals (n = 5) (***p < 0.001; Mann-Whitney). Measurements shown as median or mean ± SEM. (F) EEG power in different frequency bands (calculated per hour for 21 day recording period for each animal) in anti-LGI1 mAb infused (n = 6) and control mAb infused animals (n = 5) (**p < 0.01; Mann-Whitney). Measurements shown as mean ± SEM. (G) Comparison of frequency-band specific EEG power during interictal segments recorded during periods with peak seizure frequencies – Peak 1 (red) and Peak 2 (hashed red) in anti-LGI mAb infused animals; compared to controls (black). Measurements shown as mean ± SEM and expressed in log scale. (H) Example of interictal EEG in anti-LGI mAb infused animal at 24, 73 and 95 h. Blue highlighted panel on left panel EEGs shown enlarged in corresponding right panel EEG trace. Blue bracket indicates normal sleep EEG pattern. Blue arrows indicate interictal spikes. Scale bar for left panel 1 mV vs 50 s and for right panel 1 mV vs 5 s.
Fig. 5
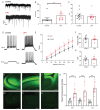
Fig. 5. Electrophysiological recordings in vitro 48 h after single intracerebroventricular (ICV) injection of anti-LGI mAbs into rats show increased excitability in CA3 pyramidal neurons.
(A) Representative spontaneous EPSC (sEPSC) whole-cell patch clamp recording 48 h after ICV injection with anti-LGI 1(lower trace) or control mAbs (upper trace). Scale bar 10pA vs 1 s. (B) The interevent interval of the sEPSCs recorded from CA3 pyramidal cells in control (n = 10 cells from 4 rats) and anti-LGI1 mAb (n = 9 cells from 5 rats) injected slices 48 h after ICV injection (**p = 0.008; Mann-Whitney). Measurements shown as mean ± SEM.(C) The amplitude of the sEPSCs recorded from CA3 pyramidal cells in control (n = 10 cells from 4 rats) and anti-LGI1 mAb (n = 9 cells from 5 rats) injected slices 48 h after ICV injection (p = ns; Mann-Whitney). Measurements shown as mean ± SEM. (D) Representative traces of CA3 pyramidal cell responses during depolarizing current steps in CA3 pyramidal cells from control (left traces) and anti-LGI1-mAb (right traces) injected rodent slices 48 h after ICV injection. (E) Depolarizing steps of different current intensities elicited significantly more spikes in the anti-LGI1 mAb injected rodent slices (n = 11 cells from 3 rats) than in control antibody (n = 13 cells from 4 rats) treated slices at 40, 100, 120 and 140pA currents (*p < 0.05, unpaired t-test). Measurements shown as mean ± SEM. (F) Input resistance was not significantly altered between the two conditions (p = ns; Mann-Whitney). Measurements shown as mean ± standard error of the mean (SEM). (G) The resting membrane potential was not significantly different between the two conditions (p = ns; Mann-Whitney). Measurements shown as mean ± standard error of the mean (SEM). (H) Confocal image of CA3 region of hippocampus from sagittal brain slice prepared 48hrs after ICV injection of anti-LGI1 mAbs with accompanying image of CA3 in control mAb infused brain slice (Hi). Scale bar 250 µm. (I) Confocal image of CA1 region of hippocampus from sagittal brain slice prepared 48hrs after ICV injection of anti-LGI1 mAbs with accompanying image of CA1 in control mAb infused brain slice (Ii). Scale bar 250 µm. (J) Confocal image of dentate gyrus (DG) of hippocampus from sagittal brain slice prepared 48hrs after ICV injection of anti-LGI1 mAbs with accompanying image of DG in control mAb infused brain slice (Ji). Scale bar 250 µm. (K) Mean fluorescence intensity of CA3, CA1 and DG of brain slices injected with single ICV dose of anti-LGI1 mAb or control mAb. Data is expressed as mean ± SEM of anti-LGI1 mAb in CA3, CA1 and DG (n = 16) and for control mAb in CA3 and CA1 (n = 14) and in DG (n = 13). (***p < 0.001; Mann Whitney t-test). Measurements shown as mean ± SEM.
Fig. 6
Fig. 6
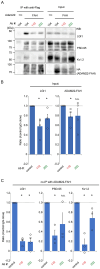
Anti-LGI1 mAbs affect the integrity of ADAM22 protein complexes in cultured mouse neurons. Treatment of cultured neurons derived from Adam22FAH knock-in mice with anti-LGI1 mAbs (AB060-110, LRR antibody; AB060-203, EPTP antibody) significantly reduces LGI1 expression and largely reduces the functional complex including ADAM22, PSD-95 and Kv1.2. Results of ADAM22-FAH co-IP experiments are shown as (A) Western Blots, (B) quantifications of input and (C) quantifications of co-IP. Note that AB060-110 shows greater, inhibitory effect on the functional complex than AB060-203. n = 4 experiments for LGI1, n = 3 experiments for PSD-95/Kv1.2. *p < 0.05 as compared to control; Kruskal-Wallis with post-hoc Steel test. Measurements shown as mean ± SEM.

References

    1. Baudin P, Roussel D, Mahon S, Charpier S, Navarro V. In Vivo Injection of Anti-LGI1 Antibodies into the Rodent M1 Cortex and Hippocampus Is Ineffective in Inducing Seizures. eNeuro. 2023;10 doi: 10.1523/ENEURO.0267-22.2023. - DOI - PMC - PubMed
    1. Baudin P, Whitmarsh S, Cousyn L, Roussel D, Lecas S, Lehongre K, Charpier S, Mahon S, Navarro V. Kv1.1 channels inhibition in the rat motor cortex recapitulates seizures associated with anti-LGI1 encephalitis. Prog Neurobiol. 2022;213:102262. - PubMed
    1. Baumgartner T, Pitsch J, Olaciregui-Dague K, Hoppe C, Racz A, Rüber T, Becker A, von Wrede R, Surges R. Seizure underreporting in LGI1 and CASPR2 antibody encephalitis. Epilepsia. 2022;63:e100–e105. - PubMed
    1. Binks SNM, Klein CJ, Waters P, Pittock SJ, Irani SR. LGI1, CASPR2 and related antibodies: a molecular evolution of the phenotypes. J Neurol Neurosurg Psychiatry. 2018;89:526–534. doi: 10.1136/jnnp-2017-315720. - DOI - PMC - PubMed
    1. Chabrol E, Navarro V, Provenzano G, Cohen I, Dinocourt C, Rivaud-Pechoux S, Fricker D, Baulac M, Miles R, Leguern E, Baulac S. Electroclinical characterization of epileptic seizures in leucine-rich, glioma-inactivated 1-deficient mice. Brain J Neurol. 2010;133:2749–2762. doi: 10.1093/brain/awq171. - DOI - PMC - PubMed

MeSH terms