. 2025 Apr 9;45(15):e2103242025.
doi: 10.1523/JNEUROSCI.2103-24.2025.

The Medial Olivocochlear Efferent Pathway Potentiates Cochlear Amplification in Response to Hearing Loss

Affiliations

The Medial Olivocochlear Efferent Pathway Potentiates Cochlear Amplification in Response to Hearing Loss

Patricia M Quiñones et al. J Neurosci. .

Abstract

The mammalian cochlea receives efferent feedback from the brain. Many functions for this feedback have been hypothesized, including on short timescales, such as mediating attentional states, and long timescales, such as buffering acoustic trauma. Testing these hypotheses has been impeded by an inability to make direct measurements of efferent effects in awake animals. Here, we assessed the role of the medial olivocochlear (MOC) efferent nerve fibers on cochlear amplification by measuring organ of Corti vibratory responses to sound in both sexes of awake and anesthetized mice. We studied long-term effects by genetically ablating the efferents and/or afferents. Cochlear amplification increased with deafferentation using VGLUT3-/- mice, but only when the efferents were intact, associated with increased activity within OHCs and supporting cells. Removing both the afferents and the efferents using VGLUT3-/- Alpha9-/- mice did not cause this effect. To test for short-term effects, we recorded sound-evoked vibrations while using pupillometry to measure neuromodulatory brain state. We found no state dependence of cochlear amplification or of the auditory brainstem response. However, state dependence was apparent in the downstream inferior colliculus. Thus, MOC efferents upregulate cochlear amplification chronically with hearing loss, but not acutely with brain state fluctuations. This pathway may partially compensate for hearing loss while mediating associated symptoms, such as tinnitus and hyperacusis.

Keywords: brain state; cochlea; feedback; hearing; optical coherence tomography; outer hair cell; pupillometry.


Conflict of interest statement

J.S.O. and B.E.A. are founders of AO technologies, with the goal of translating inner ear imaging technologies for clinical purposes. The other authors declare no competing financial interests.

Figures

Figure 1.
Figure 1.
Inputs and outputs of the descending medial olivocochlear (MOC) efferent system. Medial olivocochlear (MOC) neurons located in the ventral nucleus of the trapezoid body (VNTB), one of the periolivary nuclei within the superior olivary complex (SOC; green), project to the cochlea, where they synapse on hair cells (bottom right). The MOC neurons receive descending input from the reticular activating system (RAS; dark blue), the inferior colliculus (purple), the auditory cortex, and other areas (top). These descending inputs could convey neuromodulatory brain state and acoustic context, respectively, to the cochlea. The descending RAS inputs also tightly regulate the size of the pupil. Therefore, pupil diameter in constant luminance conditions can be used as a readout of moment-to-moment changes in brain state. Central input onto the efferent MOC cells may affect cochlear function, since they project to the outer hair cells (OHCs) and modulate their ability to amplify the traveling wave, in a process known as cochlear amplification (top right). Sensitivity is the amount the organ of Corti vibrates in response to a sound stimulus. The characteristic frequency (CF) is the sound frequency at which vibration peaks when presenting low stimulus levels.
Figure 2.
Figure 2.
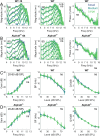
Deafferented VGLUT3−/− mice have more cochlear amplification than WT mice. Representative data from one WT mouse (top row) and one VGLUT3−/− mouse (bottom row). A, E, Raw vibratory responses to sounds of different frequencies (4–15 kHz) and intensities (10–90 dB SPL). The characteristic frequencies were ∼9–10 kHz. B, F, Sensitivity curves were created by referencing the vibratory magnitude to the stimulus intensity. For lower stimulus intensities (10–30 dB SPL), VGLUT3−/− mice demonstrated more cochlear amplification, as noted by the responses above the dotted red line. C, G, Phase responses were similar between the genotypes. The phase above 10 kHz is noisy because of the low vibratory magnitude and, thus, not significant. D, H, Responses to a 30 dB click revealed larger amplitude vibrations and more ringing (arrow) in VGLUT3−/− mice, consistent with more cochlear amplification.
Figure 3.
Figure 3.
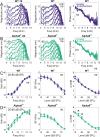
Increased cochlear amplification in VGLUT3−/− mice requires a functional MOC efferent pathway. Averaged vibratory responses for (A) WT mice (n = 9), (B) Alpha9−/− mice (n = 9), (C) VGLUT3−/− mice (n = 8), and (D) VGLUT3−/−Alpha9−/− mice (n = 9). Increased vibratory responses for lower sound levels are noted in the magnitude responses (first column) and sensitivity curves (second column) of VGLUT3−/− compared with VGLUT3−/−Alpha9−/− mice (compare curves above the red dotted line in the sensitivity plots; linear mixed effect model comparison p < 0.001, F = 9.11). However, their phase responses (third column) were similar (p = 0.064, F = 2.42). There were no differences in vibratory response magnitudes between the other three genotypes (p = 0.372, F = 1.08).
Figure 4.
Figure 4.
Quantification of the increased cochlear amplification in VGLUT3−/− mice. A, Comparison between WT (n = 9), Alpha9−/− (n = 9), VGLUT3−/− (n = 8), and Alpha9−/−VGLUT3−/− (n = 9) mice. Gain between 20–80 dB SPL was higher in VGLUT3−/− mice at 9.0 and 9.5 kHz (linear mixed effect model comparisons p = 0.020, F = 2.278; follow-up t tests for 9.0 kHz: p = 0.038, t = 2.283 and 9.5 kHz: p = 0.033, t = 2.418), but similar among the other three genotypes (p > 0.05 for all other comparisons). B, There were no differences in the best frequency (BF) between the genotypes for any intensity level (linear mixed effect model comparisons p = 0.822, F = 0.570). C, There were no differences in the sharpness of frequency tuning (Q10dB) between the genotypes for any intensity level (linear mixed effect model comparisons p = 0.855, F = 0.526). D, The maximum gain was largest in VGLUT3−/− mice (ANOVA p = 0.011, F = 4.363; follow-up t test vs Alpha9−/−VGLUT3−/− mice p = 0.026, t = 2.476). There were no differences in the maximum gain between the other three genotypes (ANOVA p = 0.497, F = 0.721). E, The sensitivity at the characteristic frequency (CF) was largest in in VGLUT3−/− mice (ANOVA p = 0.001, F = 6.668; follow-up t test vs Alpha9−/−VGLUT3−/− mice p = 0.004, t = 3.423). There were no differences in the sensitivity at CF between the other three genotypes (ANOVA p = 0.736, F = 0.31). F, The sensitivity at 5 kHz, which was roughly half the CF, was similar among the genotypes (ANOVA p = 0.605, F = 0.623). For D&E, ANOVA was performed first, followed by post hoc t tests with Bonferroni’s correction for each pair combination. For F, only ANOVA was performed because it demonstrated no significance.
Figure 5.
Figure 5.
Increased cochlear amplification in VGLUT3−/− mice are not due to increased OHC prestin levels. Top, Representative immunofluorescence images from the mid-portion of cochlea from the four genotypes. We labeled nerve fibers (α-NF, gradient glow), actin (phalloidin, cyan), hair cells (α-Myo7a, green), and prestin (α-prestin, red). Images of prestin labeling alone are shown to the right. Scale bars, 10 µm. Bottom, We quantified whole cell prestin immunofluorescence from each individual OHC and then averaged these data for each mouse. We studied WT (n = 6), Alpha9−/− (n = 7), VGLUT3−/− (n = 7), and Alpha9−/−VGLUT3−/− (n = 6) mice. There were no significant differences in OHC prestin levels between the four genotypes (ANOVA, p = 0.404, F = 1.018).
Figure 6.
Figure 6.
Dynamic OCM reveals increased middle- and high-frequency activity within the OHCs and nearby supporting cells of VGLUT3−/− mice. Cross-sectional (x–z) images through the round window membrane (RWM) were taken 10 min after killing. The variation in pixel intensity was analyzed to assess the movements of subcellular particles in the tissues. Pixel intensity over time was bandpass filtered into three bins: low (0–5 Hz), mid (5–15 Hz), and high (15–64 Hz). Data from representative WT and VGLUT3−/− mice are shown. The outer hair cell (OHC) and inner hair cell (IHC) regions are noted. VGLUT3−/− mice (n = 5) had relatively more activity in the OHC region and the Deiters’ cell (DC) region in the middle- and high-frequency bands compared with WT mice (n = 5; cyan arrow and orange arrow, respectively). Nonpaired t tests OHClow: p = 0.266, t = 1.19; DClow: p = 0.543, t = 0.635; OHCmid: p = 0.006, t = 3.67; DCmid: p = 0.041, t = 2.43; OHChigh: p = 0.015, t = 3.07; DChigh p = 0.091, t = 1.92.
Figure 7.
Figure 7.
Experimental setup for recording organ of Corti (OoC) vibrometry and pupillometry in awake mice. A, Head posting and resection of the left pinna was performed. After 1 week, the mouse was habituated to being comfortable on the free-spin wheel and to hearing the sound stimuli. This took ∼3 d, and then we began performing basilar membrane vibrometry through the ear canal. B, The infrared light-emitting diode (IR-LED) and IR camera were used to image the pupil; the ultraviolet LED (UV-LED) was titrated at the beginning of the experiment so that the pupil diameter was in the middle of its range. The visible light (RGB) camera was used to monitor for movements of the mouse that might produce artifacts. C, Image down the ear canal of the mouse. The tympanic membrane and ossicular mass are visible. D, OCT cross-sectional image through the tympanic membrane (Tym) and otic capsule bone reveals the organ of Corti (OoC) within the apical turn of the mouse cochlea. E, Diagram of the cross section of the cochlea. SV, scala vestibuli; SM, scala media; ST, scala tympani; TM, the tectorial membrane; RM, Reissner's membrane. F, Representative data from one mouse. Pupil diameter is shown versus time (red tracing). OoC vibrometry response curves were collected at each black dot. Three sets of vibrometry response curves are shown, each with a different size pupil (small, medium, and large).
Figure 8.
Figure 8.
Brain state, as measured by pupil diameter, does not affect organ of Corti vibration. A, Spontaneous variations in pupil diameter measured in one representative mouse. Over this 100 s cropped portion of the recording, the pupil dilated and then constricted. B, The peak magnitude of the vibratory response measured in the same mouse during the same time calculated from repeated measurements to 50 dB SPL stimuli ranging in frequency from 5 to 13 kHz. There were no obvious changes in vibratory magnitude that correlated with the pupil diameter. C, Scatterplot of data recorded from a full experiment from the same mouse demonstrates no obvious correlation between pupil diameter and the peak magnitude of the vibratory response (linear fit R2 = 0.0045; p = 0.496). D, E, The data for each mouse were binned into small, medium, and large pupil sizes and the vibratory responses averaged. Then, mice within each cohort were averaged (WT: n = 6, Alpha9−/−: n = 8). There were no correlations between vibratory responses and pupil diameter in either genotype (linear mixed effect model comparisons WT: p = 1.00, F = 0.022; Alpha9−/− p = 0.976, F = 0.203).
Figure 9.
Figure 9.
Vibratory responses did not vary with brain state. While measuring each set of vibratory responses, the pupil diameter was also measured and categorized as being small, medium, or large. All vibratory responses within each category were then averaged together to create three sets of responses for each mouse. A, B, Representative data from one WT and one Alpha9−/− mouse (left). The three curves from each mouse in each cohort (WT: n = 6, Alpha9−/−: n = 6) were then averaged to get magnitude (center) and phase (right) responses. There were no differences in vibratory magnitude with pupil size (linear mixed effect model comparisons WT: p = 0.505, F = 0.885; Alpha9−/− p = 0.842, F = 0.455). Similarly, phase did not correlate with pupil size (linear mixed effect model comparisons WT: p = 0.107, F = 1.743; Alpha9−/− p = 0.649, F = 0.549). C, D, The gain (left), best frequency (BF, center), and sharpness of frequency tuning (Q10dB, right) were analyzed. There were no correlations between these measures of cochlear amplification and pupil diameter. Linear mixed effect model comparisons were performed for gain (WT: p = 0.882, F = 0.394; Alpha9−/− p = 0.928, F = 0.316), BF (WT: p = 0.918, F = 0.333; Alpha9−/− p = 0.992, F = 0.135), and Q10dB (WT: p = 0.819, F = 0.484; Alpha9−/− p = 0.979, F = 0.189).
Figure 10.
Figure 10.
There were no correlations between cochlear amplification and pupil diameter in either WT (n = 6) or Alpha9−/− (n = 6) mice. Data were binned by pupil diameter into 10 bins (i.e., by decile), and linear mixed effect model comparisons were performed to assess for effects of genotype and pupil diameter on each measurement. A, Gain (genotype: p = 0.420, F = 0.705; pupil: p = 0.570, F = 0.684), (B) CF (genotype: p = 0.101, F = 3.28; pupil: p = 0.595, F = 0.642), (C) Q10dB (genotype: p = 0.252, F = 0.1.49; pupil: p = 0.353, F = 1.32), (D) the vibratory magnitude at the BF (genotype: p = 0.856, F = 0.035; pupil: p = 0.124, F = 2.10), (E) the vibratory magnitude at half the BF (genotype: p = 0.556, F = 0.369; pupil: p = 0.762, F = 0.389), and (F) the phase at the CF (genotype: p = 0.592, F = 4.51; pupil: p = 0.172, F = 1.79) all demonstrated no correlations.
Figure 11.
Figure 11.
Anesthetized brain state does not alter BM vibration. A, B, Vibratory responses from awake (solid lines) and anesthetized (dotted lines) WT (n = 6) and Alpha9−/− (n = 6) mice were similar for one representative mouse (left), averaged magnitude responses (center), and averaged phase responses (right). There were no differences in vibratory magnitude between the awake and anesthetized conditions in WT or Alpha9−/− mice (linear mixed effect model comparisons WT: p = 0.363, F = 1.06; Alpha9−/− p = 0.207, F = 1.52). Similarly, the phase did not change (linear mixed effect model comparisons WT: p = 0.649, F = 0.549; Alpha9−/− p = 0.615, F = 0.600). C, D, The gain (left), BF (center), and Q10dB (right) were calculated. Linear mixed effect model comparisons were performed to assess for effects of anesthesia on each measurement. Gain (WT: p = 0.669, F = 0.521; Alpha9−/−: p < 0.001, F = 7.85), BF (WT: p = 0.469, F = 0.855; Alpha9−/−: p = 0.102, F = 2.15), Q10dB (WT: p = 0.485, F = 0.825; Alpha9−/−: p = 0.039, F = 2.93). There were no significant differences found in WT mice. However, there were a few occasional points of statistical significance in Alpha9−/− mice that we followed up with t test analyses (e.g., Gain 8.3 kHz p = 0.036; Gain 9.9 kHz p = 0.022; Gain 12.7 kHz p = 0.014; Q10dB 20 dB SPL p = 0.015; Q10dB 30 dB SPL p = 0.035). However, these appear to have little physiological relevance, and our interpretation is that they represent statistical outliers.
Figure 12.
Figure 12.
Brain state correlates with responses in the inferior colliculus (IC), but not auditory brainstem responses (ABR). A, Left, Schematic of Neuropixels probe and image of the probe tip used for LFP data acquisition. Right, Sagittal view of the brain section showing probe track in IC. B, Snippet from an example session showing LFP aligned to pupil size. C, Population average tone-evoked LFP in the IC grouped by pre-stim pupil size showing state-dependent modulations in the negative peak of the LFP (N1). The error bars represent 68% BCA bootstrap confidence interval of the mean (N = 2,687 electrode sites from 22 sessions in 13 animals). D, Population average ABR grouped by pre-stim pupil size show lack of state dependence (n = 32 sessions in 6 animals). The error bars represent 68% BCA bootstrap confidence interval of the mean. E, Peak amplitude responses for LFP and ABR waves as a function of pupil size. N1 in the LFP responses from the IC shows strong state-dependent modulations. The ABR waves show no obvious state dependence. The error bars represent 68% BCA bootstrap confidence interval of the mean. The horizontal error bars (gray) for pupil size are across sessions whereas vertical error bars are across electrode sites. F, Using a quadratic model, we show that pupil-indexed brain state better predicts tone-evoked IC response but not for ABR waves. Explained variance (R2) is much larger for N1 than those observed for ABR waves. Data is bootstrapped 1,000 times with replacement to get R2 replicates. R2 is cross-validated using leave-one-out method. The error bars represent 68% BCA bootstrap confidence interval of the mean. ABR-I: p = 0.61, ABR-II: p = 0.53, ABR-III: p = 0.55, ABR-IV: p = 0.86, ABR-V: p = 0.87, log(VI ratio): p = 0.99, LFP-P1: p = 0.04, LFP-N1: p < 0.0005.
Figure 13.
Figure 13.
Local averaging of adjacent trials improves R2 for IC responses but not for ABR waves. A, The R2 for IC responses increased as the number of trials averaged increased. No such increase was observed in ABR waves. The error bars represent 68% BCA bootstrap confidence interval of the mean. B, Ratio of ABR wave VI does not show state dependence.

References

    1. Abdala C, Mishra SK, Williams TL (2009) Considering distortion product otoacoustic emission fine structure in measurements of the medial olivocochlear reflex. J Acoust Soc Am 125:1584–1594. 10.1121/1.3068442 - DOI - PMC - PubMed
    1. Akil O, Seal RP, Burke K, Wang C, Alemi A, During M, Edwards RH, Lustig LR (2012) Restoration of hearing in the VGLUT3 knockout mouse using virally mediated gene therapy. Neuron 75:283–293. 10.1016/j.neuron.2012.05.019 - DOI - PMC - PubMed
    1. Amilhon B, et al. (2010) VGLUT3 (vesicular glutamate transporter type 3) contribution to the regulation of serotonergic transmission and anxiety. J Neurosci 30:2198–2210. 10.1523/JNEUROSCI.5196-09.2010 - DOI - PMC - PubMed
    1. Applegate BE, Shelton RL, Gao SS, Oghalai JS (2011) Imaging high-frequency periodic motion in the mouse ear with coherently interleaved optical coherence tomography. Opt Lett 36:4716–4718. 10.1364/OL.36.004716 - DOI - PMC - PubMed
    1. Badash I, Applegate BE, Oghalai JS (2021a) In vivo cochlear imaging provides a tool to study endolymphatic hydrops. J Vestib Res 31:269–276. 10.3233/VES-200718 - DOI - PubMed

Substances

LinkOut - more resources