. 2025 Feb 22;16(1):1871.
doi: 10.1038/s41467-025-57046-8.

Activation of CAMK2 by pseudokinase PEAK1 represents a targetable pathway in triple negative breast cancer

Affiliations

Activation of CAMK2 by pseudokinase PEAK1 represents a targetable pathway in triple negative breast cancer

Xue Yang et al. Nat Commun. .

Abstract

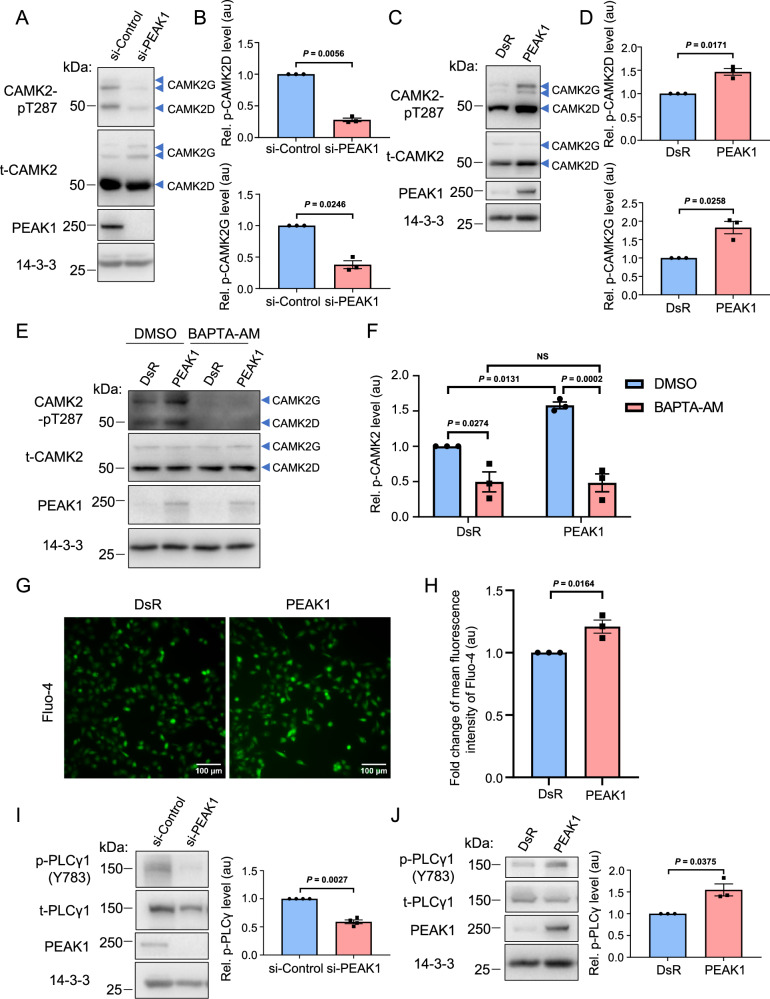
The PEAK family of pseudokinases, comprising PEAK1-3, play oncogenic roles in several poor prognosis human cancers, including triple negative breast cancer (TNBC). However, therapeutic targeting of pseudokinases is challenging due to their lack of catalytic activity. To address this, we screen for PEAK1 effectors and identify calcium/calmodulin-dependent protein kinase 2 (CAMK2)D and CAMK2G. PEAK1 promotes CAMK2 activation in TNBC cells via PLCγ1/Ca2+ signalling and direct binding to CAMK2. In turn, CAMK2 phosphorylates PEAK1 to enhance association with PEAK2, which is critical for PEAK1 oncogenic signalling. To achieve pharmacologic targeting of PEAK1/CAMK2, we repurpose RA306, a second generation CAMK2 inhibitor. RA306 inhibits PEAK1-enhanced migration and invasion of TNBC cells in vitro and significantly attenuates TNBC xenograft growth and metastasis in a manner mirrored by PEAK1 ablation. Overall, these studies establish PEAK1 as a critical cell signalling nexus that integrates Ca2+ and tyrosine kinase signals and identify CAMK2 as a therapeutically 'actionable' target downstream of PEAK1.


Conflict of interest statement

Competing interests: The authors declare no competing interests.

Figures

Fig. 1
Fig. 1. Identification of specific CAMK2 isoforms as PEAK1/2 interactors via BiCAP-MS/MS.
AC. Results of BiCAP-MS/MS screen. Volcano plots indicate enriched interactors for the PEAK1 homotypic complex (A), PEAK2 homotypic complex (B) and PEAK1/PEAK2 heterotypic complex (C). The known PEAK1 interactor Grb2 and targets of particular interest, including specific CAMK2 family members, are highlighted in blue. Dotted lines indicate fold change and p-value cut-offs. Data are from n = 3 independent experiments, and statistical significance is determined by a two-tailed t test. D Western blotting validation of PEAK1 and PEAK2 knockdown. PEAK1 and PEAK2 were knocked down using siRNA pools, with successful knockdown confirmed by Western blotting. Size markers (in kDa) are indicated on the right. These are representative data from n = 3 independent experiments detailed below. E, F. Validation of PEAK1/2 association with CAMK2D and CAMK2G by proximity ligation assays. Left panels, representative proximity ligation assay (PLA) images from MDA-MB-231 cells for the interaction of PEAK1 (E) or PEAK2 (F) with CAMK2D and CAMK2G. Cells were transfected with either si-PEAK1 (E), si-PEAK2 (F) or si-Control. Scale bars indicate 10 µm. Right panels, quantification of protein interactions in each cell. The data are expressed as dot numbers divided by cell number. In each condition, more than 50 cells have been counted. Data are presented as mean values +/− standard error of the mean (SEM) from n = 3 independent experiments and analysed by unpaired two-tailed t test. Source data are provided as a Source Data file.
Fig. 2
Fig. 2. PEAK1-mediated regulation of CAMK2 activity in triple negative breast cancer cells.
AD Manipulation of PEAK1 expression modulates CAMK2 activity. PEAK1 was knocked down using a siRNA (A, B) or overexpressed via transient transfection (C, D) in MDA-MB-231 cells and autonomous activation of CAMK2 determined by Western blotting as indicated. Blotting for 14-3-3 served as a loading control. Histograms indicate CAMK2 T287 phosphorylation normalised for total CAMK2 expression, with ‘au’ indicating arbitrary units. E, F PEAK1-promoted CAMK2 activation is calcium-dependent. MDA-MB-231 cells were transfected with a PEAK1 construct in the presence or absence of 10 µM BAPTA-AM. Cell lysates were Western blotted as indicated (E), and CAMK2 activation quantified as above for CAMK2D/G combined (F), with data expressed relative to the DsR (vector)/DMSO control which was arbitrarily set at 1. G, H. Overexpression of PEAK1 increases intracellular Ca2+. MDA-MB-231_EcoR cells stably overexpressing PEAK1 were loaded with calcium-sensitive dye Fluo-4 AM and then imaged with a fluorescence microscope. Representative images from n = 3 independent experiments are shown (G) as well as quantification of Fluo-4 images (H), presented as mean Fluo-4 fluorescence ± SEM. I, J PEAK1 regulates tyrosine phosphorylation of PLCγ1. MDA-MB-231 cells were transfected with PEAK1 siRNA (I) or a PEAK1 expression vector (J) and then cell lysates were Western blotted as indicated. The histograms indicate Y783-phosphorylated PLCγ1 normalised for total PLCγ1 expression. Data are presented as mean values +/− SEM. For (B, D, F, H and J), data are from n = 3 independent experiments, for I, n = 4 independent experiments. NS indicates p > 0.05. Data were analysed by ratio paired two-tailed t test (B, D, I, J), two-way ANOVA with Tukey’s multiple comparisons test (F), or unpaired two-tailed t test (H). PEAK1 and 14-3-3 blots in (C and J) are from the same experiment. Source data are provided as a Source Data file.
Fig. 3
Fig. 3. Mapping the CAMK2 binding region on PEAK1.
A Schematic structure of PEAK1 and various truncation mutants. WT, wildtype. B Association of CAMK2D with specific PEAK1 deletion mutants. The indicated Flag-tagged PEAK1 deletion mutants were expressed in HEK293T cells. Total cell lysates (TCL) and Flag IPs were subjected to Western blotting as indicated. Positions of size markers are indicated for both panels, sizes on the right. C Schematic representation of various PEAK1 N-terminal deletion mutants. Deleted regions of PEAK1 are indicated by red crosses. D, E. Fine structure mapping of N-terminal regions required for the association of PEAK1 with CAMK2D (D) or CAMK2G (E). Analysis was undertaken as in (B). The asterisk in 3D highlights degradation products present for the Δ261–300 and Δ261–324 mutants. F, G. PEAK1 binding to CAMK2 is required for CAMK2 activation. MDA-MB-231 cells were transfected with WT PEAK1 or the Δ301–324 PEAK1 construct. Cell lysates were Western blotted as indicated (F), with the dotted line in F indicating where the image was cropped to remove an irrelevant lane. Raw data for the full image are provided in the Source Data file. Relative CAMK2 activation, as determined by T287 phosphorylation, was then quantified (G). Data are expressed relative to vector control which was arbitrarily set at 1. All data in (B, D and E) are representative of at least n = 2 independent experiments. In (G), data are presented as mean values +/− SEM from n = 3 independent experiments. NS indicates p > 0.05. Data were analysed by one-way ANOVA with Tukey’s multiple comparisons test. Source data are provided as a Source Data file.
Fig. 4
Fig. 4. Characterisation of a conserved CAMK2 interaction motif (CIM) in PEAK1.
A Sequence alignment of the PEAK1 CIM with other CAMK2 binding partners. The critical residues for CAMK2 interaction (R297, L301 and R303 in PEAK1) are highlighted in yellow. The canonical motif numbering (A306 being 0) is shown above the alignment. B Representative ITC measurement of CAMK2 kinase domain binding to PEAK1 CIM peptide. The mean KD value from n = 3 independent experiments is indicated. C Comparative modelling of the PEAK1/CAMK2 interaction by AlphaFold. Surface representation of CAMK2 with PEAK1 amino acids 291–320 shown as ribbon (grey). The orientation is as in Supplementary Fig. 6. CAMK2 is coloured by electrostatic charge. The PEAK1 binding site on CAMK2 is noticeably negative, with key arginine residues of PEAK1 mediating interactions with CAMK2. The N- and C-termini are labelled as N and (C), respectively. D Surface representation of modelled PEAK1/CAMK2 interaction. CAMK2 is grey and PEAK1 amino acids 291–320 are purple. E, F Focused view of key predicted molecular interactions. Boxed regions from (D) illustrating predicted formation of salt bridges and electrostatic interactions (dotted lines) by specific PEAK1 residues across the surface of CAMK2. The canonical numbering of the PEAK1 motif is shown in white boxes. Source data are provided as a Source Data file.
Fig. 5
Fig. 5. The role of the PEAK1 CIM in CAMK2 activation.
A, B. Effect of CIM mutation on intracellular Ca2+ levels. Constructs expressing WT PEAK1 or the PEAK1 RR-EE mutant were stably expressed in MDA-MB-231_EcoR cells via retroviral transduction. PEAK1 expression levels were determined by Western blot (A) and Ca2+ levels (B) assayed as in Fig. 2G-H. In (A), the dotted line indicates where the image was cropped to remove an irrelevant lane. Raw data for the full image are provided in the Source Data file. Data in (B) represent mean Fluo-4 fluorescence ± SEM from n = 3 independent experiments. Statistical analysis utilised an unpaired one-tailed t test. C, D. Effect of CIM mutation on tyrosine phosphorylation of PLCγ1. The indicated plasmids were transiently transfected into HEK293 cells and cell lysates Western blotted as indicated (C). PLCγ1 tyrosine phosphorylation was normalised for total expression (D). Data in (D) are expressed relative to the vector control, which was arbitrarily set at 1 and represents the mean ± SEM of n = 3 independent experiments. Data were analysed by unpaired two-tailed t test. EG Effect of CIM mutation on CAMK2 activation. Plasmids encoding WT PEAK1 and the indicated mutants were transfected into MDA-MB-231 cells. Total cell lysates were Western blotted as indicated (E) and then relative CAMK2 activation was quantified (F, G). Data from n = 3 independent experiments are expressed relative to the vector (DsR) control which was arbitrarily set at 1. Data represent the mean ± SEM of n = 3 independent experiments. NS indicates p > 0.05. Data were analysed by one-way ANOVA with Dunnett’s multiple comparisons test. Source data are provided as a Source Data file.
Fig. 6
Fig. 6. CAMK2 phosphorylates PEAK1 to regulate the PEAK1 interactome.
A, B. RA306 inhibits PEAK1 serine/threonine phosphorylation. MDA-MB-231_EcoR cells stably expressing Flag-tagged PEAK1 were treated with RA306 (1 μM) for 24 h and cell lysates were directly Western blotted or subject to immunoprecipitation with Flag antibody prior to blotting as indicated (A). Relative serine/threonine phosphorylation of PEAK1, normalised for total PEAK1, is shown in the histogram, which presents the mean ± SEM of n = 3 independent experiments (B). In panel (B), data were analysed by ratio paired two-tailed t test. C CAMK2 phosphorylates PEAK1 in vitro. Flag-tagged versions of WT and mutant PEAK1 proteins were expressed in HEK293T cells. PEAK1 proteins were immunoprecipitated using anti-Flag antibody and following washing, immediately treated with SDS-PAGE sample buffer (SB) (no incubation) or incubated in kinase reaction buffer supplemented as indicated at 37 oC for 30 min. Reactions were terminated with SB. Samples were then Western blotted as indicated. The asterisk indicates a background band present in all CAMK2D-incubated samples, including the vector control while the arrowhead highlights phosphorylated PEAK1. D Impact of CIM mutations on heterotypic association with PEAK2. Flag-tagged WT PEAK1 or PEAK1 mutants were expressed in MDA-MB-231 cells and association with endogenous PEAK2 assayed by IP/Western. Data in (C, D) are representative of n = 3 independent experiments. Source data are provided as a Source Data file.
Fig. 7
Fig. 7. Role of CAMK2 in PEAK1-regulated TNBC biology.
A PEAK1 overexpression with CAMK2D and CAMK2G knockdown in MDA-MB-231 cells. Cells were transfected with a PEAK1 plasmid +/− siRNA-mediated CAMK2D or CAMK2G knockdown. Cell lysates were Western blotted as indicated. Data are representative of n = 3 independent experiments. B Role of CAMK2D/G in PEAK1-promoted MDA-MB-231 cell migration. Cells validated in (A) were subjected to a transwell migration assay. C, D Role of CAMK2 activation. MDA-MB-231 cells were transfected with a PEAK1 plasmid and subject to transwell migration assays +/− RA306 (C). Plasmids expressing WT PEAK1 and the Δ301–324 mutant that cannot activate CAMK2 were transiently transfected into MDA-MB-231 cells, and cells subjected to a transwell migration assay (D). E Role of PEAK1/CAMK2 signalling in TNBC xenograft growth. Control MDA-MB-231_HM cells (Cas9-control) or PEAK1 KO cells (Cas9-sgPEAK1) in combination with RA306 or vehicle control (captisol) were injected into the mammary fat pad. Left panel, representative whole body bioluminescent imaging (BLI) images. Right panel, quantification of xenograft growth. Each treatment group exhibited 9 mice. F Role of PEAK1/CAMK2 signalling in TNBC metastasis. Control MDA-MB-231_HM cells (Cas9-control) or PEAK1 KO cells (Cas9-sgPEAK1) in combination with RA306 or vehicle control (captisol) were injected into the mammary fat pad. At Day 19 post-injection with primary tumour size at ~ 100 mm3, they were resected, and tumour growth at secondary sites measured. Left panel, representative whole body and ex vivo lung BLI images from each group at Day 72 post-injection. Right panel, comparison of obvious metastatic growth (defined as BLI > 500 E + 05 p/s) across the different treatment groups. Data are presented as mean values +/− SEM from n = 3 independent experiments (BD) or from the individuals of each group (E). In (F), mouse numbers were: Cas9 control + captisol, 9; sgPEAK1 + captisol, 7; Cas9 control + RA306, 6; sgPEAK1 + RA306, 8. NS indicates p > 0.05. Data were analysed by two-way ANOVA with Tukey’s (B, C) or Dunnett’s (E) multiple comparisons tests, one-way ANOVA with Tukey’s multiple comparisons test (D), or Chi-square test (F). Source data are provided as a Source Data file.
Fig. 8
Fig. 8. Schematic representation of feed-forward regulation of CAMK2 by PEAK1.
PEAK1 enhances intracellular Ca2+ by promoting SFK-mediated tyrosine phosphorylation of PLCγ1. This leads to classical activation of CAMK2 by Ca2+/CaM and the αD helix rotates out. The PEAK1 CIM then binds to the CAMK2 substrate binding site and competes with the regulatory segment, effectively ‘locking’ CAMK2 in an active conformation. Sustained phosphorylation of PEAK1 and CAMK2 itself (on T287) then occurs as the PEAK1 CIM undergoes cycles of dissociation and re-association. However, other mechanisms may contribute to the observed effects on CAMK2 activation, as indicated on the figure. CIM-mediated recruitment of PEAK1 to the CAMK2 holoenzyme promotes serine/threonine phosphorylation of PEAK1 which in turn positively regulates heterotypic association with PEAK2.

Update of

References

    1. Reiterer, V., Eyers, P. A. & Farhan, H. Day of the dead: pseudokinases and pseudophosphatases in physiology and disease. Trends Cell Biol.24, 489–505 (2014). - PubMed
    1. Zeqiraj, E. & van Aalten, D. M. Pseudokinases-remnants of evolution or key allosteric regulators? Curr. Opin. Struct. Biol.20, 772–781 (2010). - PMC - PubMed
    1. Kung, J. E. & Jura, N. Prospects for pharmacological targeting of pseudokinases. Nat. Rev. Drug Discov.18, 501–526 (2019). - PMC - PubMed
    1. Hou, J. et al. Distinct PEAK3 interactors and outputs expand the signaling potential of the PEAK pseudokinase family. Sci. Signal15, eabj3554 (2022). - PubMed
    1. Patel, O., Roy, M. J., Murphy, J. M. & Lucet, I. S. The PEAK family of pseudokinases, their role in cell signalling and cancer. FEBS J.287, 4183–4197 (2020). - PubMed

MeSH terms

Substances

LinkOut - more resources