. 2025 Feb 21;16(1):1864.
doi: 10.1038/s41467-025-57126-9.

PGLYRP1-mediated intracellular peptidoglycan detection promotes intestinal mucosal protection

Affiliations

PGLYRP1-mediated intracellular peptidoglycan detection promotes intestinal mucosal protection

Shuyuan Chen et al. Nat Commun. .

Abstract

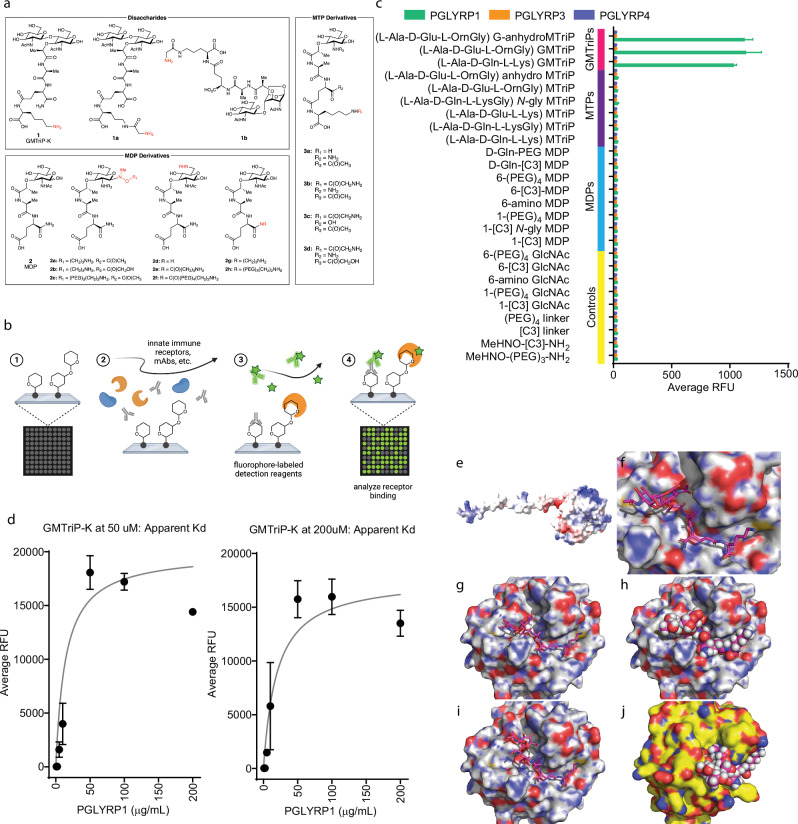
Peptidoglycan recognition proteins (PGLYRPs) are implicated in the control of the intestinal microbiota; however, molecular requirements for peptidoglycan (PGN) binding and receptor signaling mechanisms remain poorly understood. Here we show that PGLYRP1 is a receptor for the disaccharide motif of lysine N-acetylglucosamine N-acetylmuramic tripeptide (GMTriP-K). PGLYRP1 is required for innate immune activation by GMTriP-K but not muramyl dipeptide (MDP). In macrophages, intracellular PGLYRP1 complexes with NOD2 and GEF-H1, both of which are required for GMTriP-K-regulated gene expression. PGLYRP1 localizes to the endoplasmic reticulum and interacts at the Golgi with NOD2 upon GMTriP-K stimulation. PGLYRP1 and dependent gene expression signatures are induced in both mouse intestinal inflammation and human ulcerative colitis. Importantly, PGLYRP1 activation by GMTriP-K can result in the protection of mice from TNBS-induced colitis. Mammalian PGLYRPs can function as intracellular pattern recognition receptors for the control of host defense responses in the intestine.


Conflict of interest statement

Competing interests: The authors declare no competing interests.

Figures

Fig. 1
Fig. 1. PGLYRP1 specifically binds GMTriP-K.
a Peptidoglycan fragment library: GMTriP-K (1) and MDP (2); synthetic peptidoglycan fragments (1a-b, 2a-h and 3a-d) were all prepared with amine linkage points for attachment to the array surface via NHS-chemistry. b General workflow for the printing, incubation, and analysis of the PGN small fragment microarray (Created in BioRender. Putnik, R. (2025) https://BioRender.com/x50o125). c Microarray binding of PGLYRPs. PGLYRP1 binds to the disaccharide components of the array, whereas PGLYRP3 and PGLYRP4 show no association with the compounds on the array. d Determination of Apparent Dissociation Constant for PGLYRP1 to GMTriP-K (3 independent experiments were carried out with each experiment done in technical replicates). e Alphafold protein structure prediction of human PGLYRP1. fi Docking prediction of GMTriP-K to human PGLYRP1. j Docking-prediction of PGLYRP3 and GMTriP-K demonstrating shallow GlcNAc preventing interaction. For synthetic procedures and compound characterization (NMRs, HRMS), please see the SI. For (c), each condition was screened in at least biological triplicate and technical replicated (see SI for raw image files and other biologically replicate binding data). Data are presented as mean ± SEM. All experiments were repeated twice and yielded consistent results.
Fig. 2
Fig. 2. PGLYRP1 is required for GMTriP-K-mediated transcriptional regulation in the NOD2/GEF-H1 pathway.
a RNA-seq and volcano plot analysis of gene expression in BMDMs from wild type and Pglyrp1-/- mice after 18 h of stimulation with 25 µM GMTriP-K. b Volcano plot analysis of gene expression in BMDMs from wild type and NOD2-/- mice after 18 h of stimulation with 25 µM GMTriP-K. c Volcano plot analysis of gene expression in BMDMs from wild type mice after 18 h of stimulation with 25 µM GMTriP-K or 25 µM MDP. d Hierarchal cluster analysis of genes induced by either stimulus in wild type or Pglyrp1-/- BMDMs. e Hierarchical cluster analysis of genes induced by GMTriP-K in BMDMs from wild type, Pglyrp1-/-, Nod2-/-, or Arhgef2-/- mice. f qPCR analysis of gene expression in BMDMs from indicated mouse strains stimulated with 25 µM GMTriP-K or 25 µM GMDiP stimulation on BMDMs from wild type and Pylyrp1-/- mice for 18 h (n = 3). g, h Gene set enrichment analysis of the differentially expressed genes induced by indicated stimulus in wild type BMDM. g Top 25 enriched signaling pathways for the differentially expressed gene sets. h Gene set enrichment analysis summarized in mountain plots representing significantly enriched (left) or depleted (right) of genes for the indicated gene sets and collections. Data are presented as mean ± SEM with indicated P values analyzed by one-way ANOVA. All experiments were repeated twice and yielded consistent results.
Fig. 3
Fig. 3. PGLYRP1 is required for type I interferon induction by GMTriP-K.
a Hierarchal clustering of MDP induced genes in BMDMs from wild-type, Pglyrp1-/-, Nod2-/-, or Arhgef2-/- mice. b, c BMDMs from wild type, Pglyrp1-/, Nod2-/-, or Arhgef2-/- mice were stimulated with 25 μM GMTriP-K or 25 μM MDP and analyzed via western blotting with the indicated antibodies. d BMDMs from wild type or Ifnar1-/- mice were stimulated with 25 μM GMTriP-K or 25 μM MDP for 18 h and analyzed for STAT1 pathway activation with phospho-specific antibodies as indicated. e Wild type or GEF-H1-deficient BMDMs were treated with 100 ng/mL of IFNγ or IFNβ for 18 h and analyzed via western blotting with the indicated antibodies. f BMDMs from wild type, Pglyrp1-/, and Nod2-/- mice were stimulated with 25 μM GMTriP-K or 25 μM MDP, lysed, and analyzed via western blotting with the indicated antibodies. g qPCR analysis of gene expression in BMDMs from indicated mouse strains stimulated with 25 µM GMTriP-K or 25 µM GMDiP for 18 h. Data are presented as mean ± SEM with indicated P values analyzed by one-way ANOVA. All experiments were repeated twice and yielded consistent results.
Fig. 4
Fig. 4. PGLYRP1 localizes to the ER and Golgi.
ak Representative confocal microscopy images of HEK 293T cells expressing untagged (UT) or Flag-tagged PGLYRP1, orange fluorescent protein (OFP)-tagged SEC61β and GFP-tagged NOD2. Cells were transfected with PGLYRP1-UT (ad) or PGLYRP1-Flag (ek) and SEC61β-OFP and then probed with PGLYRP1 and GM130 antibodies. PGLYRP1, SEC61β-OFP, and GM130 were detected in Alexa Fluor 488 (green pseudo-color), mOrange (red), and Alexa Fluor 647 (blue) channels, respectively. ly Cells were transfected with PGLYRP1-UT and NOD2-GFP and stained for PGLYRP1 and GM130. NOD2-GFP, PGLYRP1, and GM130 were detected in EGFP (green pseudo-color), Rhodamine Red-X (red), and Alexa Fluor 647 (blue) channels, respectively. All channels were scanned sequentially, and images are pseudo-colored independent of channel wavelengths with nuclear counterstain in greyscale (Scale bars indicate 2 μm in (ad, lr) and 5 μm in (ek, sy)). Typically, 10-12 cells were analyzed for each condition. Data are presented as mean ± SEM Pearson’s coefficients were calculated in Imaris 10.1.1 image analysis software. All experiments were repeated twice and yielded consistent results.
Fig. 5
Fig. 5. PGLYRP1 interacts with NOD2 and GEF-H1 in ER- and Golgi-associated compartments.
a Western blot analysis of protein expression in BMDMs from wildtype, Arhgef2-/-, Pglyrp1-/-, and Nod2-/- mice. b Time course of protein interactions with GEF-H1 after GMTriP-K stimulation of BMDMs. c Analysis of protein interactions with PGLYRP1 or d NOD2 after GMTriP-K stimulation of BMDMs. e Input assessment of protein expression for the IPs in (c, d). f Assessment of protein interactions with GEF-H1 after stimulation with indicated immune stimuli. Representative experiments of at least three repeats are shown.
Fig. 6
Fig. 6. PGLYRP1 regulates immune responses in TNBS-induced colitis.
a Weight development of wild type and Pglyrp1-/- mice during TNBS-induced colitis (n = 4 per group). Immunofluorescence staining of PGLYRP1 and macrophages (F4/80) in colon sections of wild type and Pglyrp1-/- mice before (b), after TNBS induced colitis (c, d) TNBS colitis induction after 3 days of i.p. pretreatment with 100 μg of GMTriP-K in 50 μL PBS at day 9. e Quantitation of F4/80+ macrophages and percentage of PGLYRP1 expressing F4/80+ macrophages during TNBS colitis. Macrophages were counted in 4 independent regions per section and quantitated using Imaris 10.1.1 image analysis software. f Staining for PGLYRP1 and SEC61β in the colon of wild type mice with TNBS colitis. g qPCR analysis of gene expression in mesenteric lymph nodes of wild type and Pglyrp1-/- mice on day 9 of the TNBS and GMTPriP-K treatment protocol (n = 3–5). Scale bars represent 20 μm in (b, c, d) and 2 μm in (g). Data are presented as mean ± SEM with indicated P values analyzed by one-way ANOVA. All experiments were repeated twice and yielded consistent results.
Fig. 7
Fig. 7. The PGLYRP1 receptor system is regulated in ulcerative colitis.
a Immunofluorescence staining of PGLYRP1 and macrophages (CD68) in tissue sections of healthy human colon and active ulcerative colitis (arrow indicates immune cells that crossed the epithelial barrier, cr, Crypt.). b Quantitation of CD68+ macrophages and percentage of PGLYRP1 expressing CD68+ macrophages in the normal colon and ulcerative colitis lamina propria. Macrophages were counted in 4 independent regions per sample and quantitated using Imaris 10.1.1 image analysis software. c Hierarchal cluster analysis of genes that were significantly regulated in active, inactive ulcerative colitis and healthy control colons. d Volcano plot analysis of gene expression comparing gene expression in healthy control and active ulcerative colitis. e qPCR analysis of expression of indicated genes in healthy control (n = 6), inactive (n = 8), and active ulcerative colitis (n = 6) samples. Scale bars represent 25 μm. Data are presented as mean ± SEM with indicated P values analyzed by one-way ANOVA. Student’s test was used to compare control and UC samples. All experiments were repeated at least twice and yielded consistent results.
Fig. 8
Fig. 8. PGLYRP1 mediated recognition of peptidoglycans in macrophages controls mucosal inflammation.
PGLYRP1 is required for detection of GMTriP-K. PGLYRP1 localizes to the endoplasmic reticulum and Golgi and interacts with NOD2 and GEF-H1 to induce the expression of immune regulators that regulate intestinal inflammation (Created in BioRender. Reinecker, H. (2025) https://BioRender.com/i55t156).

Update of

References

    1. Caruso, R., Warner, N., Inohara, N. & Nunez, G. NOD1 and NOD2: signaling, host defense, and inflammatory disease. Immunity41, 898–908 (2014). - PMC - PubMed
    1. Werner, T. et al. A family of peptidoglycan recognition proteins in the fruit fly Drosophila melanogaster. Proc. Natl. Acad. Sci. USA97, 13772–13777 (2000). - PMC - PubMed
    1. Dziarski, R. & Gupta, D. Review: mammalian peptidoglycan recognition proteins (PGRPs) in innate immunity. Innate Immun.16, 168–174 (2010). - PubMed
    1. Dziarski, R., Platt, K. A., Gelius, E., Steiner, H. & Gupta, D. Defect in neutrophil killing and increased susceptibility to infection with nonpathogenic gram-positive bacteria in peptidoglycan recognition protein-S (PGRP-S)-deficient mice. Blood102, 689–697 (2003). - PubMed
    1. Saha, S. et al. PGLYRP-2 and Nod2 are both required for peptidoglycan-induced arthritis and local inflammation. Cell Host Microbe5, 137–150 (2009). - PMC - PubMed

MeSH terms

LinkOut - more resources