. 2025 Feb 21;16(1):1842.
doi: 10.1038/s41467-025-56934-3.

Exploring the principles behind antibiotics with limited resistance

Affiliations

Exploring the principles behind antibiotics with limited resistance

Elvin Maharramov et al. Nat Commun. .

Abstract

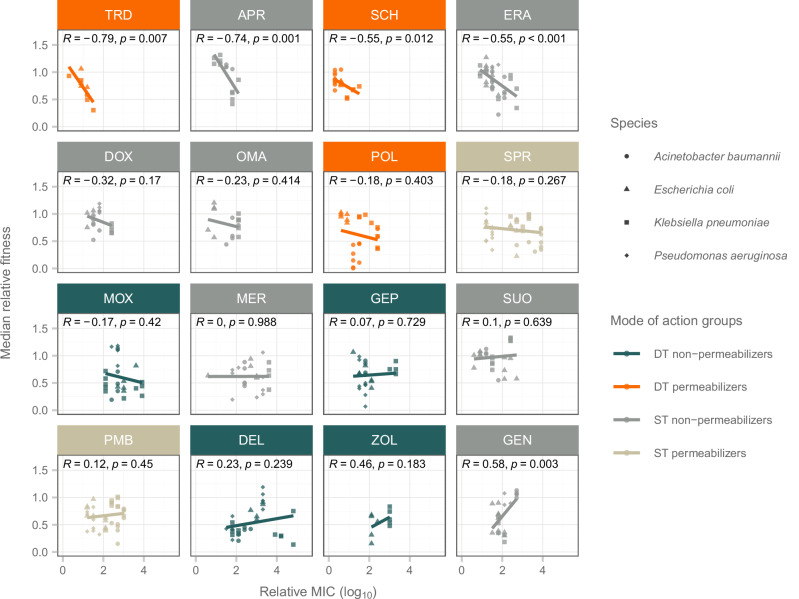
Antibiotics that target multiple cellular functions are anticipated to be less prone to bacterial resistance. Here we hypothesize that while dual targeting is crucial, it is not sufficient in preventing resistance. Only those antibiotics that simultaneously target membrane integrity and block another cellular pathway display reduced resistance development. To test the hypothesis, we focus on three antibiotic candidates, POL7306, Tridecaptin M152-P3 and SCH79797, all of which fulfill the above criteria. Here we show that resistance evolution against these antibiotics is limited in ESKAPE pathogens, including Escherichia coli, Klebsiella pneumoniae, Acinetobacter baumannii and Pseudomonas aeruginosa, while dual-target topoisomerase antibiotics are prone to resistance. We discover several mechanisms restricting resistance. First, de novo mutations result in only a limited elevation in resistance, including those affecting the molecular targets and efflux pumps. Second, resistance is inaccessible through gene amplification. Third, functional metagenomics reveal that mobile resistance genes are rare in human gut, soil and clinical microbiomes. Finally, we detect rapid eradication of bacterial populations upon toxic exposure to membrane targeting antibiotics. We conclude that resistance mechanisms commonly found in natural bacterial pathogens provide only limited protection to these antibiotics. Our work provides guidelines for the future development of antibiotics.


Conflict of interest statement

Competing interests: Authors declare no competing interests.

Figures

Fig. 1
Fig. 1. The four main modes of action groups used in our study.
The figure shows examples of the mechanisms of action for each group. Single target non-permeabilizers (ST non-permeabilizers) target a single cellular component without any effect on membrane integrity, exemplified by eravacycline, a protein synthesis inhibitor. Dual target non-permeabilizers (DT non-permeabilizers) have two main intracellular targets, without effect on membrane integrity, exemplified by gepotidacin, which targets DNA gyrase and topoisomerase IV. Single target permeabilizers (ST permeabilizers), such as polymyxins disrupt the bacterial cell membrane. Dual target permeabilizers (DT permeabilizers) target membrane integrity and an additional cellular pathway concurrently, exemplified by SCH79797, which disrupts both the cell membrane and folate synthesis. Created in BioRender. Czikkely, M. (2025) https://BioRender.com/k95g583.
Fig. 2
Fig. 2. Limited resistance to DT permeabilizers.
Resistance levels (a), after frequency of resistance assay and (b), after adaptive laboratory evolution were assessed by using relative Minimum Inhibitory Concentration (MIC) values calculated by dividing the MIC of the evolved line by that of the corresponding ancestor. Each data point represents an independent evolved line, with species differentiation denoted by shape. Significant variation in resistance levels was observed across different modes of action groups (Kruskal-Wallis test, a: n = 245, chi-squared = 28.312, df = 3, p = 3.12 × 10−6; b: n = 728, chi-squared = 205.014, df = 3, p =  3.48 × 10−4). Next, significant difference was observed in the relative MIC of DT permeabilizers compared to other groups (two-sided Dunn’s post-hoc test with Benjamini-Hochberg correction, ** / **** indicates p  <  0.01 / 0.0001, respectively). The boxplots show the median, first and third quartiles, with whiskers showing the 5th and 95th percentiles. Non-significant p-values were excluded from the figure. Source data are provided as a Source Data file. For mode of action groups, refer to Table 1.
Fig. 3
Fig. 3. Comparative antibiotic resistance profiles after adaptive laboratory evolution.
a Antibiotic-specific differences in resistance levels.The figure shows the resistance levels of different antibiotics, categorized by their action as DT permeabilizers, ST non-permeabilizers, DT non-permeabilizers, and ST permeabilizers (panels). The data suggest a significant variation in resistance development across all antibiotics (n = 728, Kruskal-Wallis chi-squared = 281.03, df = 15, p = 4.83 ×10 −51). b Species-specific differences in resistance levels. Species-specific resistance patterns were evident, particularly with POL7306 and SCH79797 (n = 60, Kruskal-Wallis chi-squared = 25.6, df = 3, p = 1.14 × 10 −5 and n = 30, chi-squared = 11.86, df = 2, p = 0.0027, respectively). A. baumannii and K. pneumoniae showed heightened resistance to POL7306, whereas K. pneumoniae exhibited increased resistance to SCH79797. Statistical analysis was performed using two-sided Dunn’s post-hoc test with Benjamini-Hochberg correction for multiple comparisons (****/ ***/ **/ * indicates p < 0.0001/ 0.001/ 0.01/ 0.05). The level of resistance was assessed using relative MIC values, calculated by dividing the MIC of the evolved line by that of the corresponding ancestor. Antibiotic-strain combinations with reduced initial susceptibility (MIC > 4 μg/mL) were excluded from evolution experiments. Each data point represents a unique adaptive laboratory-evolved line. Species distinction is indicated by shape, while mode of action group by color. The boxplots show the median, first and third quartiles, with whiskers showing the 5th and 95th percentiles. For detailed information on antibiotic and bacterial species, see Supplementary Data 1. Source data are provided as a Source Data file. For mode of action groups, refer to Table 1.
Fig. 4
Fig. 4. Correlation between bacterial resistance level and bacterial fitness.
The scatterplot shows the median relative fitness of each bacterial line plotted against the log10-transformed relative minimum inhibitory concentration (MIC). Relative bacterial fitness was determined by comparing the area under the growth curve of antibiotic-adapted lines (n = 385) to their ancestral strains in an antibiotic-free environment (see “Methods”). Each point represents an evolved bacterial line, with colors distinguishing lines adapted to different modes of action groups. A significant negative correlation between relative fitness and resistance level (relative MIC) was observed in lines adapted to tridecaptin M152-P3 and SCH79797 (both DT permeabilizers) with Pearson correlation coefficients of R = −0.79 and R = −0.55, respectively (two-sided significance test p = 0.007 / 0.012), and in lines adapted to apramycin sulfate and eravacycline (ST non-permeabilizers) with Pearson correlation coefficients of R = −0.74 and R = −0.55, respectively (two-sided significance test p = 0.001 / 0.0008). Source data are provided as a Source Data file.
Fig. 5
Fig. 5. Analysis of mutated genes found in ST and DT permeabilizer evolved lines.
a Overlap of mutated genes in response to ST (polymyxin B, SPR206) and DT permeabilizers (SCH79797, tridecaptin M152-P3, POL7306). The plot shows the sets of mutated genes identified for each antibiotic and their intersections. The vertical bars represent the number of mutated genes shared among the indicated antibiotics, as shown by the connected dots. A single dot indicates that the mutated genes are specific to a single antibiotic and are not shared with any others. Horizontal bars indicate the total number of mutated genes per antibiotic. The majority of the mutated genes are antibiotic specific (80%, n = 128), and none of the identified genes were shared among all five antibiotics. b Composite heatmap on the molecular functions and cellular localization of the fraction of frequently mutated genes among permeabilizer antibiotics. The heatmap shows the fraction of mutated genes across all species after laboratory evolution in response to ST and DT permeabilizer antibiotics (left panel). Genes are categorized based on their cellular localization using PSORT (Protein Subcellular Localization Prediction Tool). They are further classified according to their involvement in specific metabolic or resistance pathways using the KEGG (Kyoto Encyclopedia of Genes and Genomes) and COG (Clusters of Orthologous Genes) databases. These classifications are displayed in the additional panels on the right. Each row corresponds to a unique mutated gene, with color intensity indicating the fraction of adapted lines where a specific gene was mutated. This value is calculated by dividing the number of adapted lines where the gene was mutated by the total number of adapted lines sequenced for that antibiotic. Only genes that were mutated in at least three different adapted lines are displayed. The dendrogram represents the hierarchical clustering of antibiotics based on the mutational profile similarity of genes seen in this figure. The clustering was performed using the average linkage method, grouping antibiotics with similar mutated gene profiles together. For a detailed list of genes, refer to Supplementary Data 2. Source data are provided as a Source Data file. For antibiotic abbreviations, see Table 1.
Fig. 6
Fig. 6. The impact of AcrAB-TolC activity on antibiotic susceptibility.
E. coli strains with AcrAB-TolC depletion (BW25113-ΔacrB) and overexpression (BW25113: pUCacrAB) were treated with various antibiotics, and the level of resistance was determined as minimum inhibitory concentration (MIC) relative to a wild-type strain, presented on a logarithmic scale (log2). Each bar represents the mean resistance level (susceptibility, i.e., level of resistance < 0; and resistance, i.e., level of resistance > 0) to antibiotics induced by acrAB overexpression (blue bars; E. coli with a multicopy plasmid of the acrAB genes (pUCacrAB)) and acrB deletion (red bars; mutant E. coli with acrB gene deletion (ΔacrB)) compared to the wild-type. Data are presented as mean values of 3 biological replicates ± SD. The figure shows the differential impact of AcrAB-TolC expression on susceptibility to a range of antibiotics, with DT and ST permeabilizer antibiotics remaining unaffected, except for SCH79797 (SCH). Detailed information on antibiotic and bacterial strain abbreviations is provided in Supplementary Data 1. Source data are provided as a Source Data file. For information on mode of action groups, refer to Table 1.
Fig. 7
Fig. 7. Cross-resistance of polymyxin B resistant lines to ST and DT permeabilizer antibiotics.
The heatmap shows the relative MIC values (calculated by dividing the MIC of the evolved line by that of the corresponding ancestor then performing log10-transformation) of 12 polymyxin B-resistant lines against ST and DT permeabilizer antibiotics used in this study. 3 independently evolved lines from each investigated species were studied, including E. coli (EC), K. pneumoniae (KP), A. baumannii (AB), and P. aeruginosa (PA). Gray color of the main heatmap indicates combinations not tested due to intrinsic resistance of ancestor strain. The additional heatmap to the right depicts genes mutated in each polymyxin B-adapted line and their involvement in specific cellular processes based on KEGG (Kyoto Encyclopedia of Genes and Genomes) and COG (Clusters of Orthologous Genes) databases. The distances between antibiotics were computed using the Euclidean distance method based on the log-transformed MIC values. The clustering was performed using the complete linkage method. Polymyxin B-resistant strains exhibited increased resistance to various ST permeabilizer antibiotics (e.g., SPR206 (SPR) and additionally colistin (COL)), whereas DT permeabilizer antibiotics SCH79797 (SCH) and tridecaptin M152-P3 (TRD) maintained efficacy against polymyxin B-resistant strains. For detailed information on antibiotic and bacterial strain abbreviations, see Supplementary Data 1. Source data are provided as a Source Data file.
Fig. 8
Fig. 8. Impact of gene overexpression and foreign DNA on antibiotic resistance.
a The heatmap depicts genes that reduce antibiotic susceptibility upon overexpression. The panel on the left denotes the mode of action group of the antibiotics. Panels from top to bottom correspond to the number of antibiotic groups and the number of antibiotics a given gene confers reduced susceptibility when overexpressed. Only genes with over 1% read coverage relative to the total coverage for each antibiotic were included (Supplementary Data 3). b Impact of foreign DNA on antibiotic resistance. The barplot shows the impact of foreign DNA segments, derived from functional metagenomics screens, on resistance to different antibiotics. Functional selection identified 1045 distinct antibiotic resistance-conferring DNA segments (contigs), while 4.2% of these were detected in screens against DT permeabilizers, including 17 for SCH79797 (SCH) and 27 for POL7306 (POL). The bars represent the mean of distinct contigs that provide resistance to each group of antibiotics. Individual data points reflect specific antibiotics within these groups. Statistical analysis was performed using two-sided Dunn’s post-hoc test with Benjamini-Hochberg correction for multiple comparisons (* indicates p = 0.0423) following Kruskal-Wallis rank sum test (n = 16, chi-squared = 8.4475, df = 3, p = 0.038). c The prevalence of natural E. coli genomes containing putative antibiotic resistance genes (ARG). The barplot illustrates the proportion of natural E. coli genomes that contain at least one putative ARG across the four major groups of antibiotics. The bars represent the mean of the combined fraction of E. coli genomes with putative ARGs among habitats that provide resistance to each group of antibiotics. Individual data points reflect mean percentages of E. coli genomes with putative ARGs across antibiotics per habitat. Statistical analysis was performed using two-sided Dunn’s post-hoc test with Benjamini-Hochberg correction for multiple comparisons (* indicates p = 0.0364) following Kruskal-Wallis rank sum test (n = 12, chi-squared = 9.4917, df = 3, p = 0.023). Notable differences were identified in the frequency of natural E. coli genomes that possess at least one putative ARG. For antibiotic abbreviations, see Table 1. Source data are provided as a Source Data file.
Fig. 9
Fig. 9. Killing kinetics of the studied antibiotics.
a Bacterial survival rate in response to toxic antibiotic exposure. The survival rates of E. coli, A. baumannii, K. pneumoniae, and P. aeruginosa were assessed against antibiotics for which the strains demonstrated sensitivity (e.g., MIC ≤ 4 μg/mL). This evaluation was conducted after a 4-hour treatment period using antibiotic concentrations equivalent to 10 times the MIC. The bars indicate the survival rate (log10) compared to the untreated initial viable cell count (see “Methods”). Data are presented as mean values of 5 biological replicates ± SEM. The antibiotic group differentiation is denoted by color. DT permeabilizers, and especially SCH79797 (SCH) are among the antibiotics with the lowest bacterial survival rates. b Dose response curves of the studied antibiotics. The figure shows bacterial survival across different concentrations of antibiotics. Survival was estimated by measuring cell viability (colony-forming units/ml) of 2 biologically independent strains following a 4-hour exposure to different concentrations of 16 antibiotics on E. coli ATCC25922 (for further details, see “Methods”). The antibiotic concentration that kills 99.9% of the E. coli population is indicated as a vertical dotted line (see Supplementary Data 5). Error bars represent standard error calculated from the colony counts by Poisson’s model. A Hill function was fitted to the dose-response data from two biological replicates, producing sigmoidal curves (Supplementary Data 5). The Hill coefficient reflects how steeply the survival rate decreases in response to increasing antibiotic concentration (a lower value indicates lower survival). The log10—transformed Hill coefficient for DT permeabilizers was significantly lower than for DT non-permeabilizers and ST non-permeabilizers (two-sided Student’s t-test with Holm correction for multiple comparisons, p = 0.012 / 0.008, respectively), but statistically equivalent to that of ST permeabilizers (p = 0.218). X-axis label colors indicate mode of action groups. For detailed information on antibiotic and bacterial species, see Supplementary Data 1. Source data are provided as a Source Data file.

References

    1. Hoffman, P. S. Antibacterial discovery: 21st century challenges. Antibiotics9, 213 (2020). - PMC - PubMed
    1. Miethke, M. et al. Towards the sustainable discovery and development of new antibiotics. Nat. Rev. Chem.5, 726–749 (2021). - PMC - PubMed
    1. Lewis, K. The Science of Antibiotic Discovery. Cell181, 29–45 (2020). - PubMed
    1. Silver, L. L. Multi-targeting by monotherapeutic antibacterials. Nat. Rev. Drug Discov.6, 41–55 (2007). - PubMed
    1. Shukla, R. et al. An antibiotic from an uncultured bacterium binds to an immutable target. Cell186, 4059–4073.e27 (2023). - PubMed

MeSH terms

Substances

LinkOut - more resources