. 2025 Feb 21;16(1):122.
doi: 10.1038/s41419-025-07448-9.

CLDN6 triggers NRF2-mediated ferroptosis through recruiting DLG1/PBK complex in breast cancer

Affiliations

CLDN6 triggers NRF2-mediated ferroptosis through recruiting DLG1/PBK complex in breast cancer

Da Qi et al. Cell Death Dis. .

Erratum in

Abstract

We previously identified CLDN6 as a pivotal tumor suppressor in breast cancer and unexpectedly discovered that overexpression of CLDN6 resulted in characteristic ultrastructural alterations of ferroptosis. However, the exact mechanism by which CLDN6 triggers ferroptosis is still elusive in breast cancer. Our study showed that CLDN6 was associated with ferroptosis in breast cancer patients. The integration of CLDN6 and ferroptosis demonstrated remarkable predictive prognostic performance. We observed that CLDN6 triggers NRF2-mediated ferroptosis in vitro and in vivo. Mechanistically, CLDN6 enhanced nuclear export of NRF2 by regulating the PBK-dependent AKT/GSK3β/FYN axis. Further CLDN6 recruited PBK to the cell membrane through the endosomal pathway and bound with the DLG1/PBK complex, thereby promoted the degradation of PBK by the UPS. This study elucidates the previously unrecognized mechanism of CLDN6 triggering NRF2-mediated ferroptosis through recruiting DLG1/PBK complex. This study provides a reliable biomarker for predicting prognosis and is anticipated to guide the selection of therapies targeting ferroptosis in breast cancer.


Conflict of interest statement

Competing interests: The authors declare no competing interests. Ethics: The study was conducted according to the guidelines of the Declaration of Helsinki, and approved by the Experimental Animal Ethical Committee of Jilin University (protocol code 2021.237 and 2022.72), the Ethics Committee of Shanghai Outdo Biotech CO and Hunan Aifang Biological (protocol code YB M-05-02).

Figures
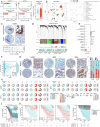
Fig. 1
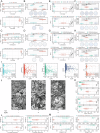
Fig. 1. Prognostic significance of integrating CLDN6 with ferroptosis.
A CLDN6 expression in four independent cohorts and one meta-cohort of breast cancer and normal tissue. B Feature plots display expression of CLDN6 across individual cells. C Representative IHC images of CLDN6 expression in para-carcinoma and breast cancer tissues. Scale bar, 200 µm (left), 20 µm (right). D The hierarchical gene dendrogram and module color of WGCNA, and heatmaps showed that CLDN6 co-expressed modules. E The KEGG analysis results of the genes co-expressed with CLDN6. F Correlation between CLDN6 and ferroptosis score in TCGA breast cancer cohort. G Representative IHC images of low and high CLDN6, NRF2, and GPX4 expression in breast cancer tissues. Scale bar, 200 µm (left), 20 µm (right). H The distribution of clinicopathologic features in low and high CLDN6, NRF2 and GPX4 groups. The total number of patients is shown in the pie diagrams. I The distribution of NRF2 and GPX4 in low and high CLDN6 groups. J Survival analysis showed differences in OS between patients with different CLDN6 expression and ferroptosis score in TCGA. K Survival analysis showed differences in OS between patients with different CLDN6, NRF2, GPX4 expression and C&F classifier in TMA.
Fig. 2
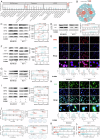
Fig. 2. CLDN6 triggers ferroptosis in breast cancer cells.
A Cell viability was measured in the indicated cells. B Clone formation assay in the indicated cells. C Cell viability was measured and IC50 was calculated by treating the indicated cells with an increased dose of sorafenib for 24 h. D Clone formation assay with sorafenib treatment in the indicated cells. E Cell viability was measured and IC50 was calculated, and Fer-1 (5 μM), NSA (10 μM), and Z-VAD-FMK (50 μM) were added to the indicated cells and treated for 24 h. F Clone formation assay in the indicated cells. G Cell viability was measured and IC50 was calculated by treating the indicated cells with an increased dose of sorafenib for 24 h. Meanwhile, Fer-1 (5 μM), NSA (10 μM), and Z-VAD-FMK (50 μM) were added to the indicated cells and treated for 24 h. H Clone formation assay in the indicated cells. I Correlation between CLDN6 and FINs. J The subcellular structure of MDA-MB-231 treated with Fer-1 (5 μM) was observed by TEM. Scale bar: 0.5 μm (K) ROS was measured by DCFH-DA staining. L Lipid peroxidation was measured by BODIPY-C11 staining. M GSH levels were measured in the indicated cells. ns, no significance, *P < 0.05, **P < 0.01, ***P < 0.001.
Fig. 3
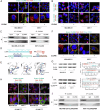
Fig. 3. CLDN6 promotes the NRF2 nuclear export to induce ferroptosis by the AKT/GSK3β/FYN axis.
A Results of enrichment analysis based on differentially expressed genes. B Predict and screen candidate transcription factors that regulate differentially expressed genes through ChEA3. C WB was used to assess NRF2, G6PD, GPX4, and CLDN6 expression levels in whole cell lysates from the indicated cells. D The NRF2 expression levels in the nuclear fraction from the indicated cells were analyzed using WB. E Fluorescent microscopy was used to observe the location of NRF2 in the indicated cells. Red: NRF2; Blue: DAPI. Scale bar: 50 μm. F and (G) WB was used to detect p-Akt (Ser473) and p-GSK3β (Ser9) and FYN in the nuclear fraction from the indicated cells. H FYN location in the indicated cells was observed using fluorescent microscopy. Green: FYN; Blue: DAPI. Scale bar: 50 μm. I NRF2, G6PD, and GPX4 expression levels from the indicated cells were assessed using WB. J Cell viability was measured and IC50 was calculated by treating the indicated cells with an increased dose of sorafenib for 24 h. Clone formation assay with sorafenib treatment. K ROS was measured by DCFH-DA staining. L Lipid peroxidation was measured by BODIPY-C11 staining. *P < 0.05, **P < 0.01, ***P < 0.001.
Fig. 4
Fig. 4. CLDN6 regulates the axis AKT/GSK3β/FYN axis through PBK.
A PBK expression levels from the indicated cells were assessed using WB. B PBK expression levels from the indicated cells were assessed using WB. Cells are collected with 10 μM MG-132 processing for 24 h. C The half-life of PBK in the indicated cells was assayed. Cells were incubated with 10 μM cycloheximide (CHX) and lysed at indicated time points followed by WB. D The ubiquitination level of PBK in the indicated cells was analyzed. The cells were incubated with or without 10 μM MG-132 for 24 h and then lysed to immunoprecipitate with anti-PBK antibody followed by WB with an anti-ubiquitin antibody. E WB was used to detect p-Akt (Ser473) and p-GSK3β (Ser9) and PBK from the indicated cells. F WB was used to detect FYN in the nuclear fraction from the indicated cells. G NRF2, G6PD, and GPX4 expression levels from the indicated cells were assessed using WB. H The NRF2 expression levels in the nuclear fraction from the indicated cells were analyzed using WB. I NRF2 location in the indicated cells was observed using fluorescent microscopy. Red: NRF2; Blue: DAPI. Scale bar: 50 μm. J NRF2, G6PD, and GPX4 expression levels from the indicated cells were assessed using WB (ML385, 10 μM). K Cell viability was measured and IC50 was calculated by treating the indicated cells with an increased dose of sorafenib for 24 h. Clone formation assay with sorafenib treatment. L ROS was measured by DCFH-DA staining. M Lipid peroxidation was measured by BODIPY-C11 staining. ns, no significance, *P < 0.05, **P < 0.01, ***P < 0.001.
Fig. 5
Fig. 5. The interaction between CLDN6 and the DLG1/PBK complex necessitates the endosomal pathways.
A The location of PBK and CLDN6 in the indicated cells was observed using fluorescent microscopy. Green: CLDN6; Red: PBK; Blue: DAPI. Scale bar: 3 μm. B VPS35, SNX27, and PBK location in the indicated cells was observed using fluorescent microscopy. Green: VPS35 or SNX27; Red: PBK; Blue: DAPI. Scale bar: 3 μm. C The interaction of CLDN6 and PBK or DLG1 was detected by co-IP assay in the indicated cells. D Schematic diagram showed the structure of CLDN6, DLG1, PBK and SNX27. E Molecular docking of PBM of CLDN6 with three PDZ domains of DLG1. Moreover, the tyrosine, asparagine, and lysine in the PBM of CLDN6 formed hydrogen bond interactions with the PDZ domain of DLG1 protein, respectively. F The location of DLG1 and CLDN6 in the indicated cells was observed using fluorescent microscopy. Green: CLDN6; Red: DLG1; Blue: DAPI. Scale bar: 3 μm. G DLG1 expression levels from the indicated cells were assessed using WB. H The location of PBK, DLG1 and CLDN6 in the indicated cells was observed using fluorescent microscopy. Green: CLDN6; Red: PBK or DLG1; Blue: DAPI. Scale bar: 3 μm. I PBK expression levels from the indicated cells were assessed using WB. J The interaction of CLDN6 and PBK or DLG1 was detected by Co-IP assay in the indicated cells. ns, no significance.
Fig. 6
Fig. 6. CLDN6 triggers breast cancer to undergo ferroptosis in vivo.
A and (B) The BALB/c nude mice were implanted into MDA-MB-231/Vector or MDA-MB-231/CLDN6 cells. After 10 d of implantation, mice were given 15 mg/kg sorafenib by gavage every day. After 7 d of the administration, mice were killed and the tumor weight was measured. C The subcellular structure of the xenograft tumor was observed by TEM. The mitochondria were shown by the blue arrow. Scale bar, 0.5 μm. D The representative IHC images showed CLDN6, NRF2, and GPX4 in xenograft tumor tissue. Scale bar, 20 μm. E The protein levels of CLDN6, NRF2, and GPX4 in tumor tissue of the xenograft tumor model were detected by WB. F PBK, DLG1, and CLDN6 location in the indicated cells was observed using fluorescent microscopy. Green: CLDN6; Red: PBK or DLG1; Blue: DAPI. Scale bar: 50 μm (left), 3 μm (right). *P < 0.05, **P < 0.01, ***P < 0.001.

References

    1. Li DS, Li YS. The interaction between ferroptosis and lipid metabolism in cancer. Signal Transduct Target Ther. 2020;5:10. - PMC - PubMed
    1. Sui SY, Xu SP, Pang D. Emerging role of ferroptosis in breast cancer: New dawn for overcoming tumor progression. Pharm Ther. 2022;232:27. - PubMed
    1. Zou Y, Xie J, Zheng S, Liu W, Tang Y, Tian W, et al. Leveraging diverse cell-death patterns to predict the prognosis and drug sensitivity of triple-negative breast cancer patients after surgery. Int J Surg (Lond, Engl). 2022;107:106936. - PubMed
    1. Dodson M, Castro-Portuguez R, Zhang DD. NRF2 plays a critical role in mitigating lipid peroxidation and ferroptosis. Redox Biol. 2019;23:7. - PMC - PubMed
    1. Anandhan A, Dodson M, Schmidlin CJ, Liu PF, Zhang DD. Breakdown of an Ironclad Defense System: The Critical Role of NRF2 in Mediating Ferroptosis. Cell Chem Biol. 2020;27:436–47. - PMC - PubMed