. 2025 Feb 22;16(1):1872.
doi: 10.1038/s41467-025-57042-y.

EccDNA atlas in male mice reveals features protecting genes against transcription-induced eccDNA formation

Affiliations

EccDNA atlas in male mice reveals features protecting genes against transcription-induced eccDNA formation

Xue Liang et al. Nat Commun. .

Abstract

eccDNA is a driver of many cancers and a potential intermediate in other age-related disorders. However, little is known about the mechanisms underlying eccDNA formation in healthy tissue and how aging affects these processes. Here, we present an atlas of eccDNA across seven tissues of male mice spanning four ages. EccDNA correlates with open chromatin characterized by signatures of H3K27ac and H3K4me1. Additionally, the mutational load of eccDNA on genes correlates with tissue-specific transcription and increases logarithmically as a function of transcript level. Still, a population of intron-dense genes with many splice forms remains sheltered from eccDNA formation. We also find that the total number of eccDNA molecules does not increase as mice age, unlike other types of mutations. Our data reveal a link between eccDNA formation and transcript level that may drive gene architecture in mammals.


Conflict of interest statement

Competing interests: B.R. is co-founder of CARE-DNA. X.L., Y.Q., P.H. are funded by Qingdao-Europe Advanced Institute for Life Sciences (QEI). J.M., Y.L., H.L. are or were employed by BGI. G.A., L.A.-G., J.M.H., S.H., A.R.-H., and H.P. declare that they have no known competing interests.

Figures

Fig. 1
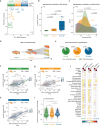
Fig. 1. eccDNA atlas overview.
a High Molecular Weight DNA was extracted from seven different tissues across 3, 12, and 22-month-old wildtype mice. Mitochondrial DNA was linearized using CRISPR-Cas9, and linear DNA was removed with exonuclease RecBCD enzyme. Remaining exonuclease resistant fraction was amplified using phi29 enzyme and sequenced using Circle-Seq. b Density size distribution of all detected eccDNA across samples, with a pie chart representing percentage in each size group. c Density size distribution of segment from 0 to 2 kilobase, with grey lines indicating periodicities for each peak. d Number of unique eccDNA detected in brain (cortex and hippocampus) and non-brain (muscle, liver, visceral adipose, subcutaneous adipose and pancreas) across embryo (n = 10, 11), 3 (n = 12, 49), 12 (n = 12, 40), and 22-month-old (n = 7, 13) age groups. The eccDNA number is normalized to million reads per million genomes and the number of genomes was estimated using averages between Qubit and qPCR estimates (see methods). Significance was assessed using two-side Kruskal–Wallis test with pairwise comparisons and Bonferroni correction (embryo: p = 0.057, 3-month-old: p = 0.98, 12-month-old: p = 0.32, 22-month-old: p = 0.99). The median is marked with a white line, with margins showing the interquartile range (IQR), whiskers extending up to 1.5 IQR, and outliers showing as individual data points. Only samples with ≥70% of reads mapped to the genome were included. e Number of unique eccDNA detected per tissue across 3 (n = 7, 5, 10, 11, 8, 9, 11), 12 (n = 5, 7, 6, 9, 7, 8, 10) and 22-month-old (n = 5, 2, 4, 2, 2, 2, 3) age groups. eccDNA number is normalized similarly. The eccDNA number is normalized to million reads per million genomes and the number of genomes was estimated using averages between Qubit and qPCR estimates. Significance was assessed using two-side Kruskal–Wallis test with pairwise comparisons and Bonferroni correction (tissue group: p = 0.09, age group: p = 0.33). f, g Number of eccDNA per each chromosome as a function of chromosome length (f) and number of eccDNA per gene as a function of gene length (g) with two-sided t test with Pearson regression. Pearson correlation (R), p-value, and gray shadow representing 95% confidence interval of the regression are shown.
Fig. 2
Fig. 2. A link between eccDNA formation and transcription.
a Schematic overview of RNA samples sequenced in liver. PCA plot of RNA profiles between age groups, with the percentage of variance explained by PC1 and PC2 components shown in brackets. b Euclidean distance between all samples across 3 age groups (3-month: n = 6; 12-month: n = 5; 22-month: n = 6) in the PCA space, assessed using two-side t test. Significance (***) is shown if p < 0.001 (3-month vs. 12-month: p = 8.8e−05, 3-month vs. 22-month: p = 1.6e06, 12-month vs. 22-month: p = 3.3e−05). The median is marked with a white line, with margins showing the interquartile range (IQR), whiskers extending up to 1.5 IQR, and outliers showing as individual data points. c Variance in the Sørensen-Dice Similarity Coefficient (SDC) assessing similarities between eccDNA profiles in each age group (see methods and Supplementary Fig. 5). Variance equality was tested using two-side F test. Significance (*) is shown if p < 0.05. d Schematic overview of RNA and eccDNA profiles showing variability increasingly different as liver aged. e Percentage of genes detected within eccDNA profiles and expressed in tissues and ages. Gray indicates genes detected in eccDNA profiles with no transcript detected. fh Logarithmic eccDNA number per Mb for each gene as a function of normalized read counts per Mb of liver. LOESS regression fitted (colored line) with kernel 2-densities plotted. Residual Standard Error (RSE) is shown for each LOESS regression. i eccDNA level at the same gene expression level: (log2 (eccDNA count per Mb/normalized RNA count per Mb)) across age groups. The Kruskal–Wallis test was used to assess significant differences (3 vs. 12-month: p = 0.0061; 3 vs. 22-month: p = 1.4e−15, 12 vs. 22-month: p = 4.4e−10). The white bar represents median values (3-month = −7.99, 12-month = −7.79, 22-month = −7.24). j Heatmap shows the association of eccDNA with interested genomic features within 50 kb genome windows. eccDNA+: exits eccDNA in 50 kb windows. eccDNA−: does not exist.
Fig. 3
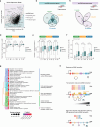
Fig. 3. Liver-specific intron-rich genes with many splice forms are protected against eccDNA formation.
a Schematic overview of a spline regression on eccDNA per gene as a function of normalized RNA read counts from the liver of 22-month-old mice. Genes between 10% and 90% quantiles are defined as bulk genes (grey), those above 10% quantiles are defined as eccDNA-exposed genes (light purple), while those below 90% quantiles are defined as eccDNA-protected genes (light green). b Venn diagram displaying the overlap and differences in eccDNA-protected genes across 3, 12, and 22-month-old mouse liver. Significance was assessed using one-side hypergeometric test, with p-values summarized in Supplementary Data 7. c Venn diagram displaying the overlap and differences in eccDNA-exposed genes across 3, 12, and 22-month-old mouse liver. Significance was assessed using one-side hypergeometric test, with p-values summarized in Supplementary Data 7. d A list of 11 recurrently protected from eccDNA formation across three ages. e Number of protein-coding genes within each specified exon number category (grouped). The recurrently protected set (dark green) shows the number of exons in the 11 genes. The expected set (gray) shows exon numbers from the 11 genes randomly selected from the mouse genome. f Relative density of intron among B (Bulk genes), P (Protected genes), and RP (Recurrently Protected genes) across 3 (n = 6), 12 (n = 5) and 22-month-old mouse liver (n = 2), calculated by dividing total intron length by gene length. g Relative level of transcripts isoforms from bulk, protected, and recurrently protected genes across 3 (n = 6), 12 (n = 5) and 22-month-old mouse liver (n = 2), measured by log10 (number of transcripts isoforms). h Relative level of isoforms from bulk, protected, and recurrently protected genes across 3 (n = 6), 12 (n = 5) and 22-month-old mouse liver (n = 2), measured by isoform per exon number per Mb. Significance was assessed using two-sided Kruskal–Wallis test with Wilcoxon multiple comparisons and Bonferroni correction, with p-values provided in Supplementary Data 9. The median is marked with a line across each box; box margins mark the interquartile range (IQR), and whiskers extend up to 1.5 IQR, with individual data points shown for outliers.
Fig. 4
Fig. 4. Hippocampus-specific intron-rich genes with many splice forms are protected against eccDNA formation.
a Schematic overview of a spline regression on eccDNA per gene as a function of normalized RNA read counts from the hippocampus of 22-month-old mice. Genes between 10% and 90% quantiles are defined as bulk genes (grey), those above 10% quantiles are defined as eccDNA-exposed genes (light purple), while those below 90% quantiles are defined as eccDNA-protected genes (light green). b Venn diagram displaying the overlap and differences in eccDNA-protected genes across 3, 12, and 22-month-old mouse hippocampus. Significance was assessed using one-side hypergeometric test, with p-values summarized in Supplementary Data 7. c Venn diagram displaying the overlap and differences in eccDNA-exposed genes across 3, 12, and 22-month-old mouse hippocampus. Significance was assessed using one-side hypergeometric test, with p-values summarized in Supplementary Data 7. d Relative density of intron from B (Bulk genes), P (Protected genes), and RP (Recurrently Protected genes across ages) across 3 (n = 4), 12 (n = 4) and 22-month-old mouse hippocampus (n = 4), calculated by dividing total intron length by gene length. e Relative level of transcripts isoforms from bulk, protected, and recurrently protected genes across 3 (n = 4), 12 (n = 4) and 22-month-old mouse hippocampus (n = 4), measured by log10 (number of transcripts isoforms). f Relative level of isoforms from bulk, protected, and recurrently protected genes across 3 (n = 4), 12 (n = 4) and 22-month-old mouse hippocampus (n = 4), measured by isoform per exon number per Mb. Significance was assessed using two-sided Kruskal–Wallis test with Wilcoxon multiple comparisons and Bonferroni correction, with p-values provided in Supplementary Data 9. The median is marked with a line across each box; box margins mark the interquartile range (IQR), and whiskers extend up to 1.5 IQR, with individual data points shown for outliers. g Gene ontology biological function terms of all protected genes across 3, 12, and 22-month-old mouse hippocampus. Significance was assessed using one-sided hypergeometric test. h Model of eccDNA formation in genes with low and high transcript levels, high intron density and alternative splicing.

References

    1. Paulsen, T., Kumar, P., Koseoglu, M. M. & Dutta, A. Discoveries of extrachromosomal circles of DNA in normal and tumor cells. Trends Genet.34, 270–278 (2018). - PMC - PubMed
    1. Møller, H. D. et al. Circular DNA elements of chromosomal origin are common in healthy human somatic tissue. Nat. Commun.9, 1069 (2018). - PMC - PubMed
    1. Henriksen, R. A. et al. Circular DNA in the human germline and its association with recombination. Mol. Cell82, 209–217.e7 (2022). - PMC - PubMed
    1. Paulsen, T., Shibata, Y., Kumar, P., Dillon, L. & Dutta, A. Small extrachromosomal circular DNAs, microDNA, produce short regulatory RNAs that suppress gene expression independent of canonical promoters. Nucleic Acids Res.47, 4586–4596 (2019). - PMC - PubMed
    1. Turner, K. M. et al. Extrachromosomal oncogene amplification drives tumour evolution and genetic heterogeneity. Nature543, 122–125 (2017). - PMC - PubMed

LinkOut - more resources