. 2025 Feb 21;15(1):6312.
doi: 10.1038/s41598-025-90024-0.

Generalizable deep neural networks for image quality classification of cervical images

Collaborators, Affiliations

Generalizable deep neural networks for image quality classification of cervical images

Syed Rakin Ahmed et al. Sci Rep. .

Abstract

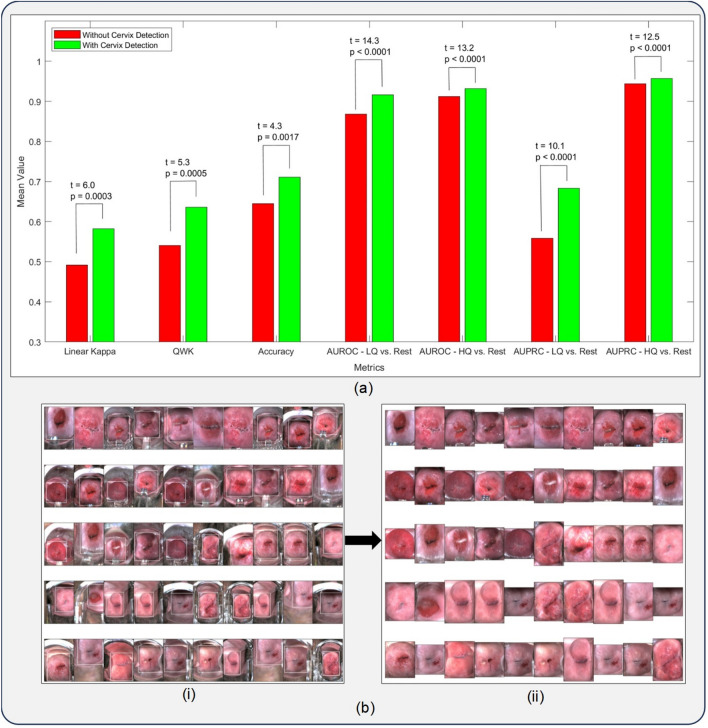
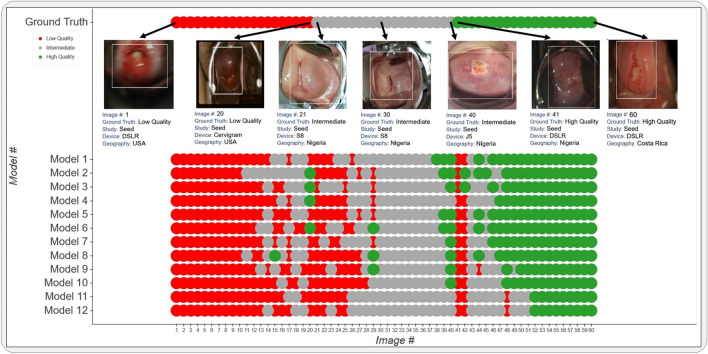
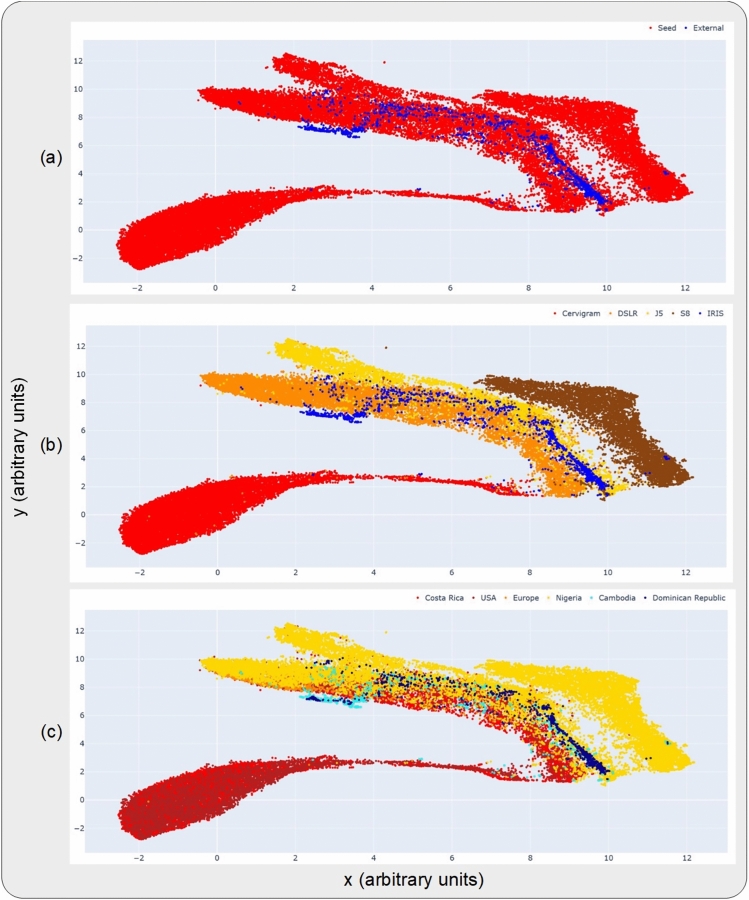
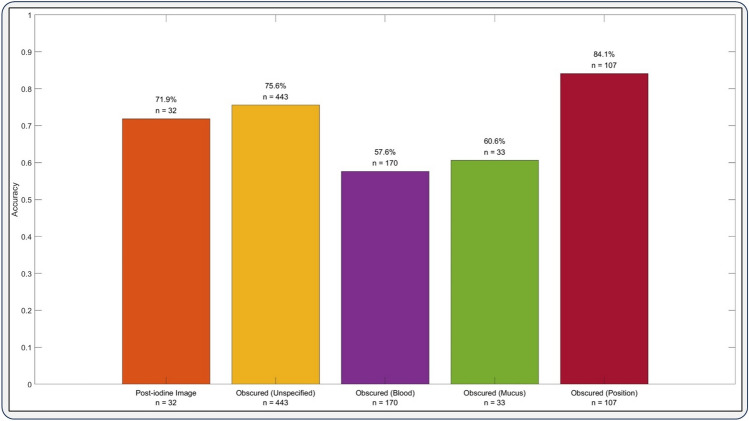
Successful translation of artificial intelligence (AI) models into clinical practice, across clinical domains, is frequently hindered by the lack of image quality control. Diagnostic models are often trained on images with no denotation of image quality in the training data; this, in turn, can lead to misclassifications by these models when implemented in the clinical setting. In the case of cervical images, quality classification is a crucial task to ensure accurate detection of precancerous lesions or cancer; this is true for both gynecologic-oncologists' (manual) and diagnostic AI models' (automated) predictions. Factors that impact the quality of a cervical image include but are not limited to blur, poor focus, poor light, noise, obscured view of the cervix due to mucus and/or blood, improper position, and over- and/or under-exposure. Utilizing a multi-level image quality ground truth denoted by providers, we generated an image quality classifier following a multi-stage model selection process that investigated several key design choices on a multi-heterogenous "SEED" dataset of 40,534 images. We subsequently validated the best model on an external dataset ("EXT"), comprising 1,340 images captured using a different device and acquired in different geographies from "SEED". We assessed the relative impact of various axes of data heterogeneity, including device, geography, and ground-truth rater on model performance. Our best performing model achieved an area under the receiver operating characteristics curve (AUROC) of 0.92 (low quality, LQ vs. rest) and 0.93 (high quality, HQ vs. rest), and a minimal total %extreme misclassification (%EM) of 2.8% on the internal validation set. Our model also generalized well externally, achieving corresponding AUROCs of 0.83 and 0.82, and %EM of 3.9% when tested out-of-the-box on the external validation ("EXT") set. Additionally, our model was geography agnostic with no meaningful difference in performance across geographies, did not exhibit catastrophic forgetting upon retraining with new data, and mimicked the overall/average ground truth rater behavior well. Our work represents one of the first efforts at generating and externally validating an image quality classifier across multiple axes of data heterogeneity to aid in visual diagnosis of cervical precancer and cancer. We hope that this will motivate the accompaniment of adequate guardrails for AI-based pipelines to account for image quality and generalizability concerns.

Keywords: Artificial intelligence; Cervical cancer screening; Deep learning; Image quality.


Conflict of interest statement

Declarations. Competing interests: The authors declare no competing interests.

Figures

Fig. 1
Fig. 1
Overview of dataset and model optimization strategy. We utilized a collated multi-device and multi-geography dataset, labelled “SEED” (orange panel), for model training and selection, and subsequently validated the performance of our chosen best-performing model on an external dataset, labelled “EXT” (blue panel), comprising of images from a new device and new geographies (see Table 1 and METHODS for detailed descriptions and breakdown of the datasets by ground truth). We split the “SEED” dataset 10% : 1% : 79% : 10% for train : validation : Test 1 (“Model Selection Set”) and Test 2 (“Internal Validation”), and subsequently investigated the intersection of model design choices in the bottom table on the train and validation sets. The models were ranked based on classification performance on the “Model Selection Set”, captured by the metrics highlighted on the center green panel. The “Internal Validation” set was subsequently utilized to further verify and confirm the ranked order of the models from the “Model Selection Set”. Finally, we validated the performance of our top model on “EXT”, conducting both an external validation and an interrater study (see METHODS). CE: cross entropy; QWK: quadratic weighted kappa; MSE: mean squared error, AUROC: area under the receiver operating characteristics curve.
Fig. 2
Fig. 2
(a) Comparison of model performances with (green bars) and without (red bars) cervix detection. The bars report mean values of the corresponding metrics on the x-axis across all models. Results from paired samples t-tests adjusted for the Bonferroni correction (t-statistic, p-value) are highlighted in the text above the bars, demonstrating statistically significant improvements in model performance with cervix detection. (b) (i) Bounding boxes generated from running the cervix detector, highlighted in white, around 50 randomly selected images from the external (“EXT”) dataset. The cervix detector utilized a YOLOv5 architecture trained on “SEED” dataset images, and (ii) Bound and cropped images of the cervix which are passed onto the diagnostic classifier.
Fig. 3
Fig. 3
Classification performance metrics on the “Internal Validation Set” (“Test Set 2”) for models investigated. The models are arranged from top to bottom in order of decreasing performance. Specifically, (a) highlights the discrete classification metrics: %extreme misclassifications (% ext. mis.), %high quality misclassified as low quality (%HQ as LQ) and %low quality misclassified as high quality (%LQ as HQ), (b) highlights the Kappa metrics (linear, quadratic weighted) and (c) highlights the area under the receiver operating characteristics curve (AUROC) for each of the low quality (LQ) versus rest and high quality (HQ) versus rest categories. While overall our top models performed reasonably similarly in terms of the continuous metrics (panel b and c), the discrete metrics (panel a) separated out the top performing model from its competitors. Our best performing model achieved an AUROC of 0.92 (LQ vs. rest) and 0.93 (HQ vs. rest), and a minimal total %EM of 2.8%. The model ranking is consistent to the ranking observed on the “Model Selection Set” (“Test Set 1”) (Supp. Fig. 1).
Fig. 4
Fig. 4
Model-level comparison across investigated models on the “Internal Validation Set” (“Test Set 2”). 60 images were randomly selected from this set (see METHODS/Model Training and Analysis/Model Selection and Internal Validation) and arranged in order of increasing mean score within each ground truth class in the top row (labelled “Ground Truth”). The model predicted class for the investigated models for each of these 60 images is highlighted in the bottom rows, where the images follow the same order as the top row. The color coding in the top row represents ground truth while in the bottom 12 rows represent the model predicted class. Red: Low Quality, Gray: Intermediate, and Green: High Quality, as highlighted in the legend. As we go from the worst model at the bottom to the best model at the top, identification and discrimination of both “intermediate” and “high” quality images steadily improve.
Fig. 5
Fig. 5
Uniform manifold approximation and projections (UMAP) highlighting the relative distributions of the datasets, devices and geographies investigated in this work. Each subplot highlights a different representation of the UMAP, where the color coding (highlighted in the corresponding legend at the top of each subplot) is at the (a) dataset-level (seed vs. external), (b) device-level and (c) geography-level. The datasets and devices occupy distinct clusters in (a) and (b), while the geographies are all clustered together within the same device in (c).
Fig. 6
Fig. 6
External validation of our best performing model on “EXT” dataset. Panel (a) highlights the strong out-of-the-box (OOB) performance of our model, where area under the receiver operating characteristics curve (AUROC) = 0.83 (low quality, LQ vs. rest) and 0.82 (high quality, HQ vs. rest), and %extreme misclassification (%Ext. Mis.) = 3.9% (a.i, blue bars), with the corresponding confusion matrix and ROC curve in (ii). Panel (a) further highlights the improvement in performance upon retraining, where AUROC = 0.95, 0.88 respectively; %Ext. Mis. = 1.8% on “EXT” test set (a.i, orange bars) and the absence of catastrophic forgetting, where AUROC = 0.92, 0.93 respectively; %Ext. Mis. = 3.2% on “SEED” Test Set 2 (a.i, yellow bars; confusion matrix and ROC curves in iii). Panel (b) highlights that our model is geography agnostic, with no meaningful difference in OOB performance on “EXT” between Cambodia (Cam.) and Dominican Republic (DR) (b.i, light and dark blue bars) and strong performance on DR for models trained on “SEED” + Cambodia and vice versa (b.i. light and dark green bars; confusion matrices and ROC curves depicted in ii and iii respectively).
Fig. 7
Fig. 7
Interrater assessment of our best performing model on 100 newly acquired, “EXT” dataset images (device = IRIS colposcope, geography = Cambodia), with respect to the ground truth denoted by two different raters. Rater 1 was one of the raters who had labelled images in the “SEED” dataset on which the model was trained, while Rater 2 was a completely new rater. Our model demonstrated strong performance out-of-the-box (OOB) on each individual rater’s ground truth, where for Rater 1: area under the receiver operating characteristics curve (AUROC) = 0.96 (low quality, LQ vs. rest), 0.85 (high quality, HQ vs. rest) respectively, and %extreme misclassifications (%Ext. Mis.) = 2% (panel (a), blue bars; ROC curves in panel (b)); and for Rater 2: AUROC = 0.87, 0.80 respectively, and %Ext. Mis. = 8% (panel (a), red bars; ROC curves in panel (b)). Panel (c) highlights the degree of concordance between the two rater’s ground truths (x-axis: Rater 1; y-axis: Rater 2) and the corresponding model prediction on each of the 100 images using a confusion matrix color-coded by model prediction (Red: low quality; Gray: intermediate quality and Green: high quality).
Fig. 8
Fig. 8
Analysis of diagnostic classifier performance by image quality class. Specifically, the x-axis represents the image quality label/ground truth (“Intermediate” and “High Quality”) while the y-axis represents the diagnostic classifier label/ground truth (“Normal”, “Gray Zone/Indeterminate” and “Precancer+”). Within each of the six coordinates (reflecting the six combinations of quality and diagnostic classifier ground truths), each color-coded bubble represents the diagnostic classifier model predictions, with the relative sizes of the bubbles indicating the relative ratio of predictions for each class within each of the six coordinates. The numbers in the center of each bubble represents the number predicted to be of the given color for diagnostic class, as highlighted in the legend on the top, where Green: Normal, Gray: Gray Zone/Indeterminate, and Red: Precancer+.
Fig. 9
Fig. 9
Analysis of quality classifier performance by available quality factor, where each bar represents the accuracy of the best performing quality classifier model (Model 1 in Fig. 3 and 4) within each of the specific quality factor category as denoted on the x-axis. The total number of images in each category are denoted both in the bottom and top of each bar. On the x-axis, “Obscured” indicates that the view of the cervix is obscured by the factor that is denoted in parenthesis.

References

    1. Esteva, A. et al. Dermatologist-level classification of skin cancer with deep neural networks. Nature542, 115–118 (2017). - PMC - PubMed
    1. Hannun, A. Y. et al. Cardiologist-level arrhythmia detection and classification in ambulatory electrocardiograms using a deep neural network. Nat. Med.25, 65–69 (2019). - PMC - PubMed
    1. Piccialli, F., Somma, V. D., Giampaolo, F., Cuomo, S. & Fortino, G. A survey on deep learning in medicine: Why, how and when?. Inf. Fusion66, 111–137 (2021).
    1. Topol, E. J. High-performance medicine: the convergence of human and artificial intelligence. Nat. Med.25, 44–56 (2019). - PubMed
    1. Sabottke, C. F. & Spieler, B. M. The effect of image resolution on deep learning in radiography. Radiol. Artif. Intell.2, e190015 (2020). - PMC - PubMed

MeSH terms