. 2025 Feb 21;15(1):6346.
doi: 10.1038/s41598-025-90860-0.

Disruption of functional network development in children with prenatal Zika virus exposure revealed by resting-state EEG

Affiliations

Disruption of functional network development in children with prenatal Zika virus exposure revealed by resting-state EEG

Ahmet Omurtag et al. Sci Rep. .

Abstract

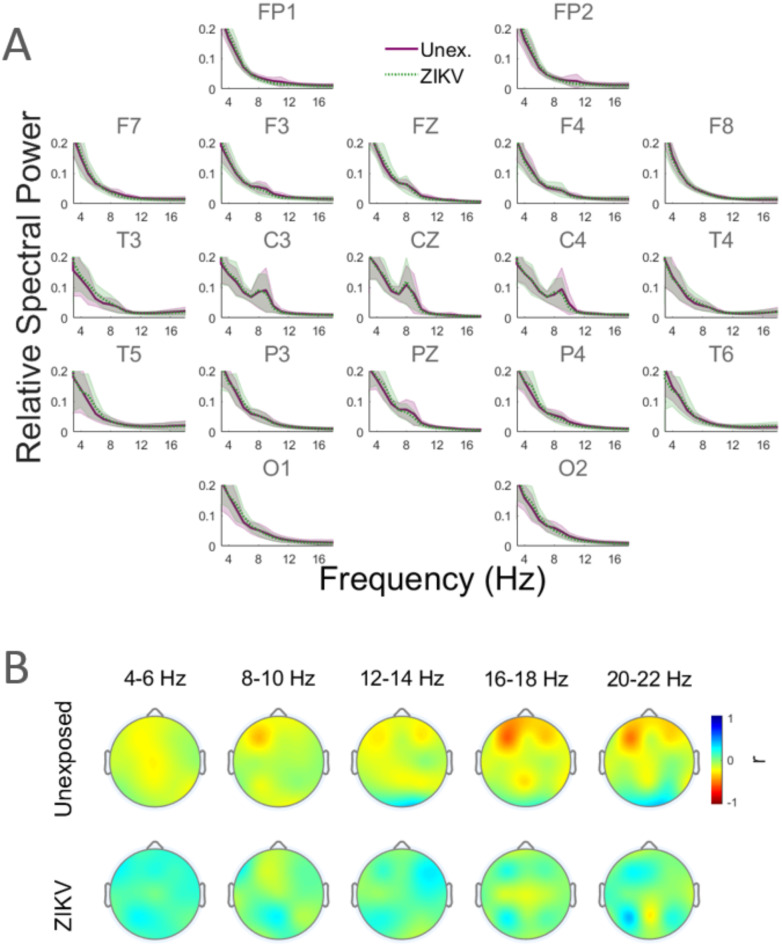
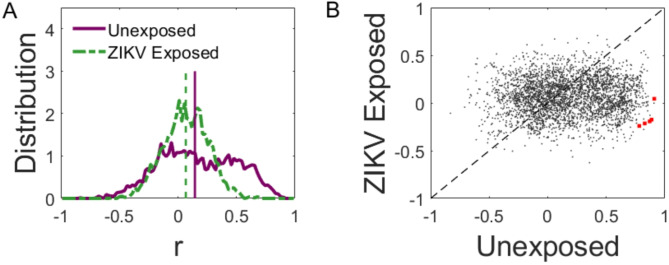
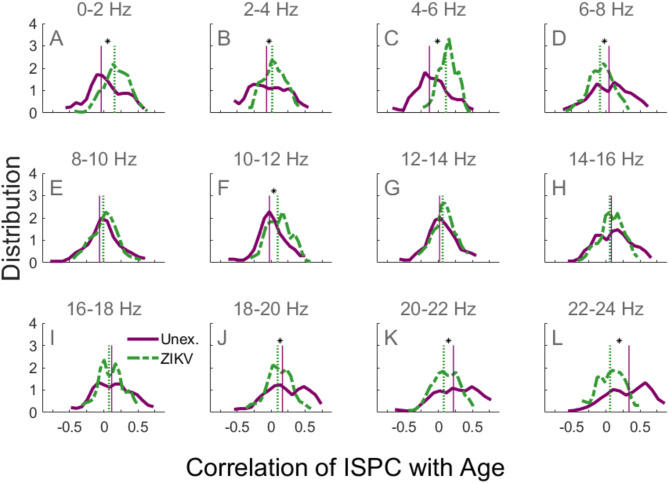
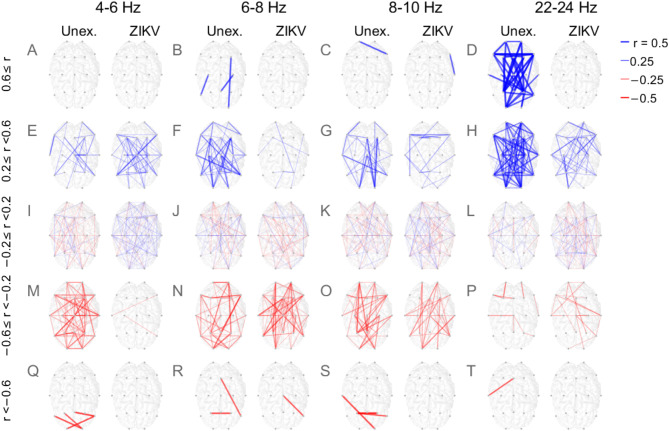
Children born to mothers infected by Zika virus (ZIKV) during pregnancy are at increased risk of adverse neurodevelopmental outcomes including microcephaly, epilepsy, and neurocognitive deficits, collectively known as Congenital Zika Virus Syndrome. To study the impact of ZIKV on infant brain development, we collected resting-state electroencephalography (EEG) recordings from 28 normocephalic ZIKV-exposed children and 16 socio-demographically similar but unexposed children at 23-27 months of age. We assessed group differences in frequency band power and brain synchrony, as well as the relationship between these metrics and age. A significant difference (p < 0.05, Bonferroni corrected) in Inter-Site Phase Coherence was observed: median Pearson correlation coefficients were 0.15 in unexposed children and 0.07 in ZIKV-exposed children. Results showed that functional brain networks in the unexposed group were developing rapidly, in part by strengthening distal high-frequency and weakening proximal lower frequency connectivity, presumably reflecting normal synaptic growth, myelination and pruning. These maturation patterns were attenuated in the ZIKV-exposed group, suggesting that ZIKV exposure may contribute to neurodevelopmental vulnerabilities that can be detected and quantified by resting-state EEG.


Conflict of interest statement

Declarations. Competing interests: SAB is an employee of Bio-Signal Group Inc. (BSG) which manufactures microEEG, the device used in this study, owns stock options in BSG and is a coinventor on US patent US9408575B2. AO was previously an employee of BSG and is a coinventor on US patent US9408575B2. All other authors declare no competing interests.

Figures

Fig. 1
Fig. 1
Relative band power and its age-dependence. (A) Relative frequency band power (FBP) as a function of frequency for each electrodes site. The UC (solid green line) and ZEC (dashed purple) averages are shown. Shaded regions are sample standard error. (B) Topographic illustration of the correlation of FBP with age for specific frequency ranges for the UC (top row) and ZEC (bottom).
Fig. 2
Fig. 2
Distribution of developmental change in synchrony. (A) Histograms of r, the correlation of ISPC with age in the UC (purple) and ZEC (green). Corresponding medians (0.15 and 0.07, respectively) are shown by the dashed vertical lines; (B) Scatter plot of rN and rZ, with each dot corresponding to an electrode pair and specific frequency, and the diagonal dashed line showing rN = rZ.
Fig. 3
Fig. 3
Developmental change in synchrony. The correlation strength between inter-site phase clustering (ISPC) and age in UC and ZEC are grouped into rows depending on their effect size in UC. (A) Rapidly increasing; (B) moderately increasing; (C) stagnating; (D) moderately decreasing; (E) rapidly decreasing. Columns 2–5 show randomly selected examples of electrode pairs, separated into UC (purple circles) and ZEC (green triangles) groups, together with their best-fit lines.
Fig. 4
Fig. 4
The distribution of the developmental change in synchrony in frequency bands. UC (solid purple) and ZEC (green dashed) for the frequency bands indicated above each subplot. Plots show histograms of r, the correlation between ISPC and age. The vertical lines indicate the medians of the corresponding distributions. Distributions whose medians differ significantly are indicated using an asterisk located between the vertical lines showing the medians (*p < 0.05, Bonferroni corrected).
Fig. 5
Fig. 5
Topographic illustration of the developmental changes in connectivity. The frequency band for each pair of columns is shown at the top. Within each pair of columns, UC (left) and ZEC (right) connectivity development are shown as lines. Each row corresponds to a different development speed. (AD) Rapidly developing; (EH) moderately developing; (IL) stagnating; (MP) moderately weakening; (QT) rapidly weakening. A line’s colour indicates the sign of the change (blue/red for increase/decrease in ISPC with age) and the line’s thickness is proportional to the magnitude of the change, as indicated in the figure legend at top right.
Fig. 6
Fig. 6
Graph theoretic characterisation of networks and their dependence on frequency. The characteristic path length (AD) and the clustering coefficient (FI), based on all pairs of channels at all frequency bands, in UC (purple solid) and ZEC (green dashed). The values for individual UC (circles) and ZEC (triangles) and their best fit lines are shown. The rightmost column shows the correlation of the path length (E) and of the clustering coefficient (J) with age, as a function of the frequency of the connection. The shaded regions around each curve indicate the sample standard deviation.
Fig. 7
Fig. 7
Dependence of connectivity development on frequency and cortical distance. Distances based on the MNI locations of primary neuronal populations in adult cortex associated with each electrode, for the UC (A) and ZEC (B). See Table 2 for selected electrode pairs and their values of ISPC at the numbered zones 1–10.

References

    1. Blackmon, K. et al. Epilepsy surveillance in normocephalic children with and without prenatal Zika virus exposure. PLoS Negl. Trop. Dis.14, e0008874 (2020). - PMC - PubMed
    1. Musso, D., Ko, A. I. & Baud, D. Zika virus infection—After the pandemic. N. Engl. J. Med.381, 1444–1457 (2019). - PubMed
    1. Nielsen-Saines, K. et al. Delayed childhood neurodevelopment and neurosensory alterations in the second year of life in a prospective cohort of ZIKV-exposed children. Nat. Med.25, 1213–1217 (2019). - PMC - PubMed
    1. Sobral da Silva, P. F. et al. Neurodevelopment in children exposed to zika virus: What are the consequences for children who do not present with microcephaly at birth?. Viruses13, 1427 (2021). - PMC - PubMed
    1. Gao, W., Lin, W., Grewen, K. & Gilmore, J. H. Functional connectivity of the infant human brain: Plastic and modifiable. Neurosci.23, 169–184 (2017). - PMC - PubMed

LinkOut - more resources