. 2025 Mar;27(3):438-448.
doi: 10.1038/s41556-025-01621-0. Epub 2025 Feb 21.

Blebbisomes are large, organelle-rich extracellular vesicles with cell-like properties

Affiliations

Blebbisomes are large, organelle-rich extracellular vesicles with cell-like properties

Dennis K Jeppesen et al. Nat Cell Biol. 2025 Mar.

Abstract

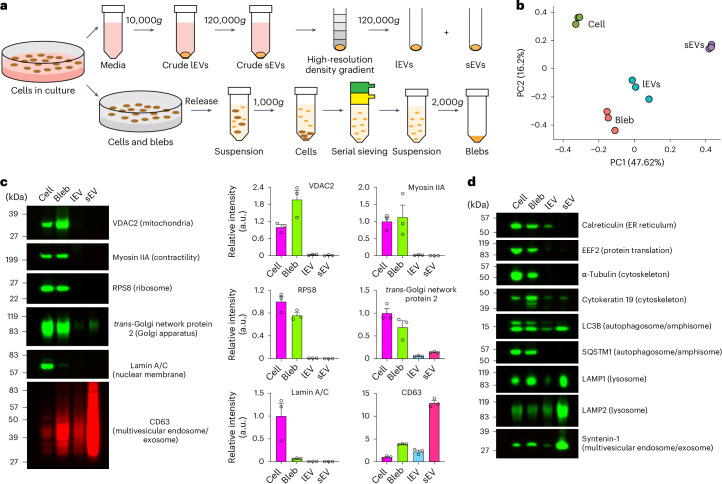
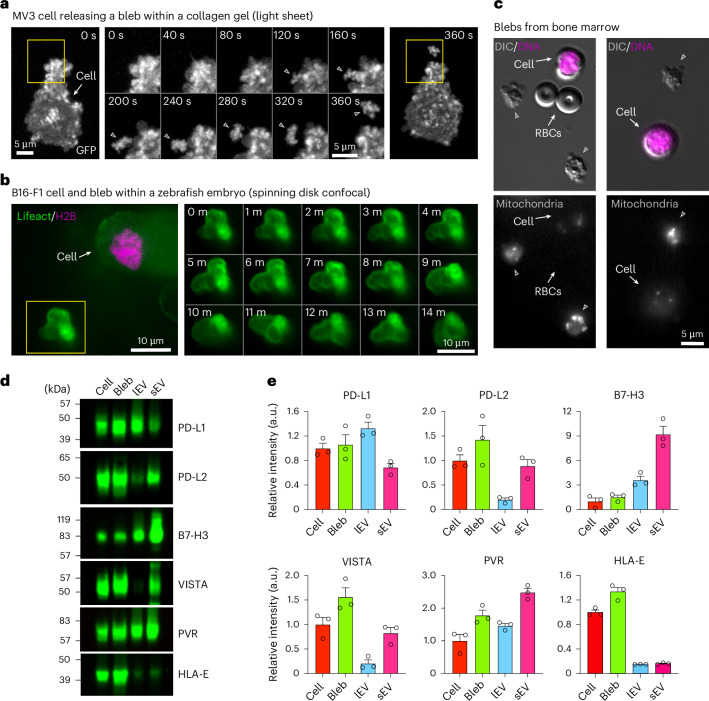
Cells secrete a large variety of extracellular vesicles (EVs) to engage in cell-to-cell and cell-to-environment intercellular communication. EVs are functionally involved in many physiological and pathological processes by interacting with cells that facilitate transfer of proteins, lipids and genetic information. However, our knowledge of EVs is incomplete. Here we show that cells actively release exceptionally large (up to 20 µm) membrane-enclosed vesicles that exhibit active blebbing behavior, and we, therefore, have termed them blebbisomes. Blebbisomes contain an array of cellular organelles that include functional mitochondria and multivesicular endosomes, yet lack a definable nucleus. We show that blebbisomes can both secrete and internalize exosomes and microvesicles. Blebbisomes are released from normal and cancer cells, can be observed by direct imaging of cancer cells in vivo and are present in normal bone marrow. We demonstrate that cancer-derived blebbisomes contain a plethora of inhibitory immune checkpoint proteins, including PD-L1, PD-L2, B7-H3, VISTA, PVR and HLA-E. These data identify a very large, organelle-containing functional EV that act as cell-autonomous mobile communication centres capable of integrating and responding to signals in the extracellular environment.


Conflict of interest statement

Competing interests: The authors declare no competing interests.

Figures

Fig. 1
Fig. 1. Blebbisomes form with functional mitochondria.
a, Representative blebbisomes imaged with DIC microscopy. The arrowheads show blebs. b, The diameter of blebbisomes. Average blebbisome diameter: 14.9 ± 3.0 s.e.m., 8.92 ± 0.8 s.e.m., 10.9 ± 1.2 s.e.m. in B16-F1, DKO-1 and MDA-MB-231 cells, respectively. n = 167, 183 and 236 blebbisomes for B16-F1, DKO-1 and MDA-MB-231 cells, respectively. c, An SEM micrograph of B16-F1 blebbisome displaying large characteristic bleb (arrowhead). d, Correlative light and electron microscopy of a B16-F1 blebbisome using iSIM (top and middle) and SEM (bottom). The colour bar denotes the relative Z height, and the dotted line denotes the height of the single z-slice. The arrowheads show the blebs. e, A timelapse DIC and epifluorescence (MitoTracker) microscopy time montage showing blebbisome formation. The arrow denotes the blebbisome formation, and the arrowhead denotes mitochondria. f, Imaging of actin filaments and mitochondria in blebbisomes by iSIM. The boxes indicate blebbisomes. Bottom: enlarged boxes are shown below (n = 3). g, TMRE fluorescence before and after FCCP treatment. The arrow shows a cell, and the arrowhead shows a blebbisome (n = 5). h, A timelapse of TMRE fluorescence before and after FCCP treatment. The fluorescence levels between the cells and blebbisomes after FCCP treatment were not significantly different as determined by a two-tailed Student’s t-test. For DKO-1 post FCCP treatment, blebbisome mean: 0.42 ± 0.46 s.e.m., cell mean: 0.35 ± 0.46 s.e.m. For B16-F1 post FCCP treatment, blebbisome mean: 0.55 ± 0.058 s.e.m, cell mean: 0.47 ± 0.058 s.e.m (n = 5 cells and blebbisomes each for both DKO-1 and B16-F1 cells). i, Kaplan–Meier survival curves for blebbisomes treated with DMSO, FCCP, staurosporine or raptinal. Time of death was denoted by a loss of membrane integrity (Supplementary Video 7). The mean survival time for DMSO, FCCP, staurosporine and raptinal are 23.18 ± 1.23 s.e.m., 19.59 ± 1.57 s.e.m., 20.36 ± 1.46 s.e.m. and 20.46 ± 1.68 s.e.m., respectively. DMSO was significantly different from FCCP, staurosporine and raptinal with a P value of 2.3 × 10−5, 0.00041 and 0.00040, respectively, as determined by a two-tailed Student’s t-test (n = 29 for DMSO, 41 for FCCP, 29 for staurosporine and 39 for raptinal; across three independent experiments). Source data
Fig. 2
Fig. 2. Blebbisomes are distinct from other EVs at the protein level.
a, A simplified experimental setup for purification of blebbisomes (blebs), lEVs and sEVs. b, A principal component analysis of normalized MDA-MB-231 proteomic mass spectral counts for cells, blebs, lEVs and sEVs (n = 3). c, Immunoblot analysis of MDA-MB-231 cells, bleb, lEV and sEV for select proteins (left) and quantification of relative fluorescence signal intensity (right). Each data point represents one independent experiment (see Extended Data Fig. 4b for replicate immunoblots) (n = 3 and data are displayed as mean ± s.e.m.). The images are representative of three independent experiments. d, An immunoblot analysis of MDA-MB-231 cells, bleb, lEV and sEV for select proteins. The images are representative of three independent experiments. a.u., arbitrary units. Source data
Fig. 3
Fig. 3. Blebbisomes are distinct from large oncosomes.
a, A large oncosome and a blebisome from purified preparations stained with CellMask Deep Red to label the plasma membrane. b, Proteomics comparison of TUFM between blebbisomes and lEVs was shown to be significant by a Student’s t-test. The mean spectral counts for blebbisomes is 21.33 ± 1.45 s.e.m. and for lEVs 7.00 ± 1.53 s.e.m. (n = 3 separate isolation preps). c, Maximum intensity projections of purified large oncosomes and a blebbisome labelled for actin filaments (magenta) and TUFM (green). d, An immunofluorescence comparison based on the integrated density of maximum intensity projections of the extracellular vesicle (n = 35 blebbisomes and 35 large oncosomes; representing three independent experiments each). Mean integrated fluorescent density, blebbisomes: 72,825.715 ± 11,992.082 s.e.m., oncosomes mean: 22,202.855 ± 3,901.163 s.e.m. (n = 30 blebbisomes and 30 large oncosomes; representing three independent experiments each). e, Maximum intensity projections of a large oncosome and a blebbisome stained with CellMask Deep Red to label the plasma membrane (magenta) and TMRE (green) to stain for active mitochondria. f, The TMRE fluorescence was normalized on the basis of maximum intensity per N and then compared between blebbisomes and large oncosomes. Normalized fluorescence, blebbisomes mean: 0.55 ± 0.044 s.e.m., oncosomes mean: 0.066 ± 0.014 s.e.m. (n = 35 blebbisomes and 35 large oncosomes; representing three independent experiments each). The average diameter of large oncosomes was 4.72 ± 0.28 μm. The P values displayed in the graphs were derived from a two-tailed Student’s t-test. Source data
Fig. 4
Fig. 4. Blebbisomes contain multiple organelles.
a, Immunofluorescence imaging of GM130, myosin IIA and RPS10 in B16-F1, DKO-1 and MDA-MB- 231 blebbisomes stained for actin by iSIM. The images are representative of three independent experiments. b, TEM imaging of purified MDA-MB-231 blebbisome. The coloured arrowheads indicate organelles or ultrastructures as indicated, the black arrows show endocytosis and the red arrows show actin protusions. c, A TEM image of a purified MDA-MB-231 blebbisomes (left) and a colour-coded (false colour) image (right). Yellow, mitochondria; green, Golgi apparatus; purple, ER; and turquoise, autophagosome–lysosome. Example micrographs from n = 2 independent blebbisome purifications are shown.
Fig. 5
Fig. 5. Blebbisomes take up extracellular vesicles.
a, iSIM images of the uptake of EVs labelled with Alexa-647 in actin-stained blebbisomes released by B16-F1, DKO-1 and MDA-MB-231 cells or in prepurified samples of MDA-MB-231 blebbisomes. In the maximum projections, there are horizontal and vertical yellow lines that denote the XZ and YZ orthogonal view. The images are representative of three independent experiments. b, A quantification of the percentage of blebbisomes that contained EV-Alexa-647 signal. The per cent of blebbisomes containing EVs: 53 ± 9% s.e.m., 65 ± 8% s.e.m., 82 ± 11% s.e.m., 43 ± 5% s.e.m. in B16-F1, DKO-1, MDA-MB-231 and prepurified MDA-MB-231 blebbisomes, respectively. The data are from three independent experiments. c, A quantification of the number of EV-Alexa-647 puncta per blebbisome. The number of puncta per blebbisome: 1.31 ± 0.06 s.e.m., 1.61 ± 0.39 s.e.m., 2.75 ± 1.22 s.e.m., 1.19 ± 0.36 s.e.m. in B16-F1, DKO-1, MDA-MB-231 and prepurified MDA-MB-231 blebbisomes, respectively. The data are from three independent experiments. Bleb, purified MDA-MB-231 blebbisomes. Source data
Fig. 6
Fig. 6. Blebbisomes secrete exosomes and microvesicles.
a, A TEM micrograph of purified MDA-MB-231 blebbisome displaying MVE. The MVEs are pseudo-coloured magenta. Inset: enlarged box of a single MVE displaying multiple ILVs. b, Immunofluorescence imaging by iSIM of CD63 and actin in a MDA-MB- 231 blebbisome. c, Immunoblot analysis of control media (Con) and EVs secreted from purified MDA-MB-231 blebbisomes for select EV marker proteins. The images are representative of three independent experiments. d, A quantification of relative signal intensity from c. Each data point represents one independent experiment (see Extended Data Fig. 7d for replicate immunoblots) (n = 3 and data are displayed as mean ± s.e.m.). Source data
Fig. 7
Fig. 7. Blebbisome-like EVs are present in vivo and contain immune checkpoint ligands.
a, A timelapse axially swept light sheet microscopy montage showing blebbisome (bleb) formation from MV3 cells embedded in collagen. Boxes: areas of bleb formation and release. Middle: the timelapse is for the enlarged area in the yellow box. b, A timelapse spinning-disk confocal montage of a bleb released from B16-F1 cell implanted in a zebrafish embryo and stained for actin (Lifeact) and Histone H2B. Box: a blebbisome displaying blebbing behavior. c, A DIC microscopy montage showing bleb in bone marrow. RBC, red blood cell (n = 3 independent isolations). d, An immunoblot analysis of MDA-MB-231 cells, blebs, lEV and sEV for inhibitory immune checkpoint proteins. e, A quantification of relative signal intensity from d. Each data point represents one independent experiment (see Extended Data Fig. 5c for replicate immunoblots) (n = 3, and data are displayed as mean ± s.e.m). Source data
Extended Data Fig. 1
Extended Data Fig. 1. Scanning electron microscopy images of blebbisomes.
Scanning electron microscopy (SEM) micrographs of B16-F1 blebbisomes displaying characteristic blebs. Open arrowheads denote blebs that are likely retracting and closed arrowheads denote blebs that are likely growing. Lower right panel shows a potential blebbisome still attached to or just released from the parent cell. The arrow denotes the separation between the blebbisome and cell, which could have been an artifact of specimen preparation. SEM was performed 2 times independently with similar results.
Extended Data Fig. 2
Extended Data Fig. 2. Blebbisomes form with functional mitochondria.
a, Average blebbisome area: 89.4 + /- 18.6 SEM, 36.0 + /- 6.1 SEM, 51.2 + /- 9.1 SEM µm2 for B16-F1, DKO-1 and MDA-MB-231 cells, respectively. n = 167, 183 and 236 blebbisomes across three independent experiments for B16-F1, DKO-1 and MDA-MB-231 cells, respectively. b, Imaging of nucleus, actin filaments and mitochondria in cells and blebbisomes by iSIM. Boxes indicate blebbisomes. Higher magnification version of images from Fig. 1f. c, Imaging of mitochondria and myosin IIa in blebbisomes by expansion microscopy using iSIM (Ex-iSIM). Box indicate a blebbisome. Enlarged inset is display on the right. Source numerical data are available in source data. Source data
Extended Data Fig. 3
Extended Data Fig. 3. NMIIB is necessary for blebbisome formation.
a, Quantification of blebbisomes produced by MDA-MB-231 cells after siRNA knockdown of CHMP2A, CHMP4B and NMIIB. The mean ratio of blebbisomes/cell, siControl: 0.01 + /− 0.0, siCHMP2A: 0.001 + /- 0.00, siCHMP4B: 0.01 + /- 0.00, and siNMIIB 0 + /- 0.00. n = 3 independent experiments. b, Immunoblots of NMIIB and beta Actin in MDA-MB-231 cells following NMIIB siRNA knockdown. c, Immunoblots of CHMP2A, CHMP4B and beta Actin in MDA-MB-231 cells following CHMP2A and CHMP4B siRNA knockdown. Data are from three independent siRNA knockdown experiments. P values displayed in graphs were derived from a two-tailed student’s t-test. Source numerical data are unprocessed western blots are available in source data. Source data
Extended Data Fig. 4
Extended Data Fig. 4. Purified blebbisomes and immunoblots of select proteins.
a, DIC image of MDA-MB-231 blebbisomes purified as outlined in Fig. 2a. Enlarged inset is display on the right. b, Replicative immunoblot experiments of MDA-MB-231 cells, purified blebbisomes (bleb), large Evs (lEV) and small Evs (sEV) for select proteins. Related to Fig. 2c. c, Immunoblot analysis of MDA-MB-231 (breast cancer), Gli36 (glioblastoma) and B16-F1 (melanoma) cells, blebbisomes (bleb), large Evs (lEV) and small Evs (sEV) for select proteins. Images are representative of three independent experiments. d, Summary of common protein expression pattern for MDA-MB-231, B16-F1 and Gli36 cells, purified blebbisomes, lEVs and sEVs based validation by immunoblot analysis. Based on data from Fig. 2c, d and Extended Data Fig. 3b, c. TGN38 is Trans Golgi Network Protein 2. Source numerical data and unprocessed blots are available in source data. Source data
Extended Data Fig. 5
Extended Data Fig. 5. Further comparison between blebbisomes and large oncosomes.
a, Proteomics comparison of proteins known to be enriched in large oncosomes (MYH9, MYH10, KRT18, and APEX1) as well as CD63 to serve as a known EV marker. MYH9 (p = 0.002), blebbisome mean: 196.00 + /- 4.58 SEM, large EV mean: 239.67 + /- 3.84 SEM. MYH10, blebbisome mean:18.33 + /- 2.60 SEM, large EV mean: 22.67 + /- 2.40 SEM. CD63, blebbisome mean: 3.33 + /− 0.88 SEM, large EV mean: 4.33 + /- 1.20 SEM. KRT18 (p-value = 0.007), blebbisome mean: 37.00 + /- 1.73 SEM, large EV mean: 25.67 + /- 1.33 SEM. APEX1, blebbisome mean: 0.00, large EV mean:1.33 + /- 0.88 SEM. n = 3 independent isolation preps. b, Immunofluorescence comparison based on the integrated density of maximum intensity projections of the blebbisome and large oncosome. The proteins chosen are known to be enriched in large oncosomes (MYH9, MYH10, KRT18, and APEX1) as well as CD63 to serve as a known EV marker. MYH9 (p-value < 0.0001), Blebbisome mean: 109857.81 + /- 14895.17 SEM, Large oncosome mean: 22157.01 + /- 6882.76 SEM. MYH10 (p-value = 0.0001), Blebbisome mean: 11796.96 + /- 2742.26 SEM, Large oncosome mean: 6285.41 + /- 1027.22 SEM. CD63 (p-value = 0.0066), Blebbisome mean: 5904.93 + /- 1592.75 SEM, Large oncosome mean: 2730.8 + /- 445.56 SEM. KRT18, Blebbisome mean: 4145.94 + /- 516.41 SEM, Large oncosome mean: 1943.83 + /- 105.23 SEM. APEX1 (p-value < 0.0001), Blebbisome mean: 11969.16 + /- 4898.36 SEM, Large oncosome mean: 4703.29 + /- 1537.73 SEM. n = 3 independent isolation preps. c, Maximum intensity projections of blebbisomes and large oncosomes stained for actin (magenta) and a protein of interest (green). P-values displayed in graph were determined using a two tailed student’s t-test. Source numerical data are available in source data.
Extended Data Fig. 6
Extended Data Fig. 6. Blebbisomes contain RNA.
RNA molecules in cultures of MDA-MB-231 cells were labeled by fluorescence in situ hybridization (FISH) using probes directed towards poly-A sequences (cyan). NMIIA (magenta) was localized to facilitate the identify of blebbisomes. Arrows denote cells and Ns denote nuclei in the field of view. Blebbisomes are denoted by yellow boxes and insets show high magnification images. Images are representative of three independent experiments.
Extended Data Fig. 7
Extended Data Fig. 7. Blebbisomes contain RAB proteins and EV marker proteins.
a, TEM micrograph of purified MDA-MB-231 blebbisome displaying a multivesicular endosome. The MVE are pseudo-colored magenta. Box represents enlarged inset of a single MVE displaying multiple intraluminal vesicles. b, Immunoblot analysis of select proteins in MDA-MB-231 and B16-F1 cells, purified blebbisomes (bleb), large EVs (lEV) and small EVs (sEV). c, Immunoblot analysis of annexin A2-positive microvesicles secreted from MDA-MB-231 blebbisomes. n = 3 and data are displayed as mean ± s.e.m. Images represents three independent experiments. d, Replicative immunoblot experiments of EVs secreted from purified MDA-MB-231 blebbisomes. Related to Fig. 5d. Con, control media; EV, secreted EVs from blebbisomes. Source numerical data and unprocessed blots are available in source data. Source data
Extended Data Fig. 8
Extended Data Fig. 8. Blebbisomes contain inhibitory immune checkpoint ligands.
a, Immunoblot analysis of human breast cancer cells (MCF-7, T-47D, SK-BR-3, MDA-MB-231) and pro-monocytic, human histiocytic lymphoma cells (U-937) for inhibitory immune checkpoint proteins. b, Immunoblot analysis of Gli36 and B16 cells, blebbisomes (bleb), large EVs (lEV) and small EVs (sEV) for inhibitory immune checkpoint proteins. c, Replicative immunoblot experiments of MDA-MB-231 cells, purified blebbisomes (bleb), large EVs (lEV) and small EVs (sEV) for immune checkpoint proteins. Related to Fig. 6d, e. d, Immunoblot analysis of control media (Con) and EVs secreted from purified MDA-MB-231 blebbisomes for B7-H3 and PVR from three independent experiments. Rep, replicate. e, Quantification of relative signal intensity from (d). Each data point represents one independent immunoblot experiment (replicate immunoblots). n = 3 and data are displayed as mean ± s.e.m. Source numerical data and unprocessed blots are available in source data. Source data
Extended Data Fig. 9
Extended Data Fig. 9. Quantification of blebbisome and migrasome formation.
a, Number of EVs formed per cells in each field of view over 24 h. EVs formed, blebbisome mean: 1.13 + /− 0.59 SEM, migrasome mean: 2.77 + /- 1.44 SEM. n = 3 independent experiments. b, Number of EVs formed during each cellular retraction event that formed either a blebbisome or migrasomes. EVs formed, blebbisome mean: 1 + /− 0 SEM, migrasome mean: 2.08 + /− 0.51 SEM. n = 3 independent experiments. Quantifications from DIC time-lapse movies. Source numerical data are available in source data. Source data

References

    1. Jeppesen, D. K. et al. Reassessment of exosome composition. Cell177, 428–445 e418 (2019). - PMC - PubMed
    1. Jeppesen, D. K., Zhang, Q., Franklin, J. L. & Coffey, R. J. Extracellular vesicles and nanoparticles: emerging complexities. Trends Cell. Biol.10.1016/j.tcb.2023.01.002 (2023). - PMC - PubMed
    1. Mathieu, M., Martin-Jaular, L., Lavieu, G. & Thery, C. Specificities of secretion and uptake of exosomes and other extracellular vesicles for cell-to-cell communication. Nat. Cell Biol.21, 9–17 (2019). - PubMed
    1. van Niel, G. et al. Challenges and directions in studying cell-cell communication by extracellular vesicles. Nat. Rev. Mol. Cell Biol.23, 369–382 (2022). - PubMed
    1. van Niel, G., D’Angelo, G. & Raposo, G. Shedding light on the cell biology of extracellular vesicles. Nat. Rev. Mol. Cell Biol.19, 213–228 (2018). - PubMed

LinkOut - more resources