. 2025 Mar;26(3):484-496.
doi: 10.1038/s41590-025-02089-8. Epub 2025 Feb 21.

STIM1-mediated NFAT signaling synergizes with STAT1 to control T-bet expression and TH1 differentiation

Affiliations

STIM1-mediated NFAT signaling synergizes with STAT1 to control T-bet expression and TH1 differentiation

Li Zhong et al. Nat Immunol. 2025 Mar.

Abstract

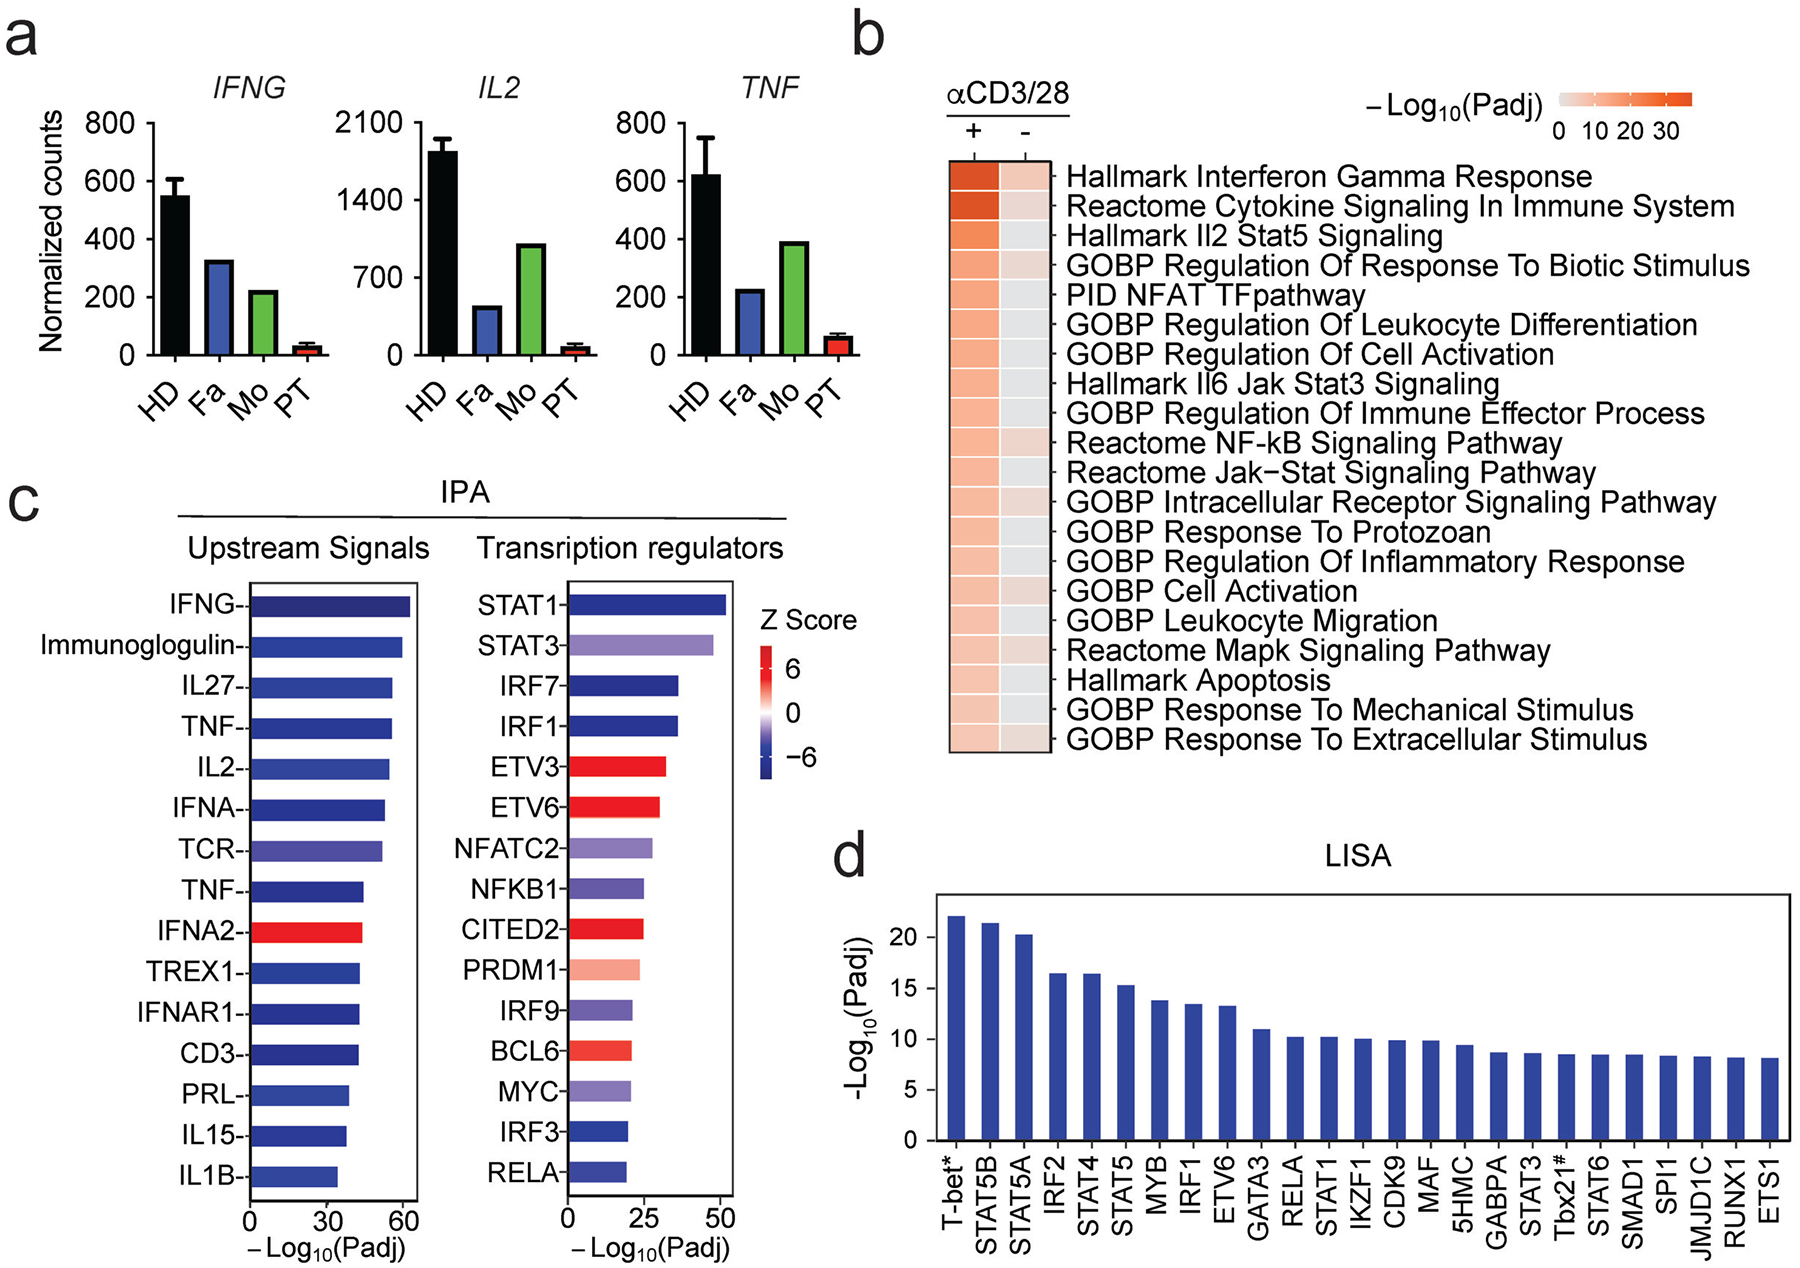
Stromal interaction molecule 1 (STIM1) is critical for store-operated Ca2+ entry (SOCE) and T cell activation. T helper 1 (TH1) cells, which express T-bet (encoded by TBX21), mediate immunity to intracellular pathogens. Although SOCE is known to regulate other TH lineages, its role in Th1 differentiation remains unclear. Here, we report a patient with an intronic loss-of-function mutation in STIM1, which abolishes SOCE and causes immunodeficiency. We demonstrate that SOCE promotes nuclear factor of activated T cells (NFAT) binding to conserved noncoding sequence (CNS)-12 in the TBX21 enhancer and enables NFAT to synergize with STAT1 to mediate TBX21 expression. While SOCE-deficient CD4+ T cells have reduced expression of TBX21 in the absence of interleukin-12 (IL-12), their expression of IL-12 receptors β1 and β2 is increased, sensitizing them to IL-12 signaling and allowing IL-12 to rescue T-bet expression. Our study reveals that the STIM1-SOCE-NFAT signaling axis is essential for the differentiation of Th1 cells depending on the cytokine milieu.


Conflict of interest statement

Competing interests: S.F. is a scientific cofounder and consultant of Calcimedica, and an inventor on a patent Regulators of NFAT (WO/2007/081804) related to this paper. The other authors declare no competing interests.

Figures

Extended Data Fig. 1.
Extended Data Fig. 1.. Clinical findings in patient with STIM1 c.497+776A>G mutation.
a, Anhidrosis of palm after exertion. b, Persistent dental hypoplasia of newly formed adult teeth of the PT at 6 years of age. c, Dilation of pupils in both eyes.
Extended Data Fig. 2.
Extended Data Fig. 2.. Altered gene expression in CD4+ T cells of STIM1-deficient patient.
a, Principal component analysis (PCA) of differentially expressed genes (DEGs) detected by RNA-Seq. CD4+ T cells from the patient (PT) with STIM1 c.497+776A>G mutation and a healthy donor (HD) were left unstimulated or stimulated with anti-CD3/28 for 6 hours. b, Venn diagram of up- and down-regulated DEGs after stimulation of CD4+ T cells from HD and the PT. An adjusted P value < 0.05 and absolute log2 fold change (LFC) > 0.5 were used as cut-off. c, Gene set enrichment analysis (GSEA) of DEGs in CD4+ T cells from the PT and a HD. Normalized enrichment score (NES) and adjusted P values are as indicated for the following datasets: NFAT TF pathway (M60: PID), P<0.01; alpha/beta T cell differentiation (GO: 0046632), P<0.05; Hallmark IFN-gamma response (M5913), P<0.001. d, LFC in expression levels of DEGs related to the NFAT TF pathway (M60: PID). Data are from one experiment with 2 samples per cohort and stimulation condition. e, mRNA levels of CD44, NR4A1/Nur77 and CD38 in CD4+ T cells from the PT, his father (Fa), mother (Mo) and a HD stimulated with anti-CD3/28 for 6 hours and analyzed by RNA-seq.
Extended Data Fig. 3.
Extended Data Fig. 3.. Attenuated IFN-γ and T-bet response in CD4+ T cells of STIM1 deficient patient.
a, mRNA levels of IFNG, IL2 and TNF in CD4+ T cells from the patient (PT), his father (Fa), mother (Mo) and a HD stimulated with anti-CD3/28 for 6 hours and analyzed by RNA-seq. b, Metascape analysis of all downregulated differentially expressed genes (DEGs) in HD, Fa, Mo vs. the PT. c, IPA upstream regulator analysis of DEGs in CD4+ T cells from the PT vs. all three controls (HD, Fa and Mo) ranked by P value and separated by upstream signaling molecules and transcription factors. Colors indicate the activation Z score. d, Epigenetic Landscape In Silico deletion Analysis (LISA) of transcriptional regulators of downregulated DEGs in T cells from the PT vs. all three controls (HD, Fa and Mo) ranked by P value. Note that LISA uses different ChIP-Seq datasets to identify transcriptional regulators; T-bet is identified as “T” using GSE81881 (human Th1 cells) indicated here as T-bet*, and as Tbx21 using GSE33802 (mouse Th1 cells) indicated as Tbx21#. Fold changes were shrunk using the apeglm method. DEGs were considered significant if shrinkage of the log2 fold change (LFC) absolute value was > 0.5, and the adjusted P value < 0.05.
Extended Data Fig. 4.
Extended Data Fig. 4.. SOCE is required for T-bet expression in human and mouse CD4+ T cells.
a, Venn Diagram (left) of differential gene expression of potential T-bet targets in anti-CD3/28 stimulated CD4+ T cells (6 hours) from the STIM1 deficient PT and a HD (left). T-bet targets were identified by (i) T-bet binding using ChIP-Seq, (ii) positive regulation by T-bet using RNA-Seq, and (iii) reduction of H3K4me1 histone methylation in T-bet-deficient cells. Z scores of mRNA expression of T-bet target gene that fulfill all three selection criteria (right). b, GSEA analysis (left) and heatmap of DEGs (right) related to Th1 specific genes77. c, Cytokine expression in CD4+ T cells from a HD and the PT restimulated with 20 nM PMA and 1 μM ionomycin for 6 hours. Bar graphs showing relative median fluorescence intensities (rel. MFI) in the patients T cells normalized to HD. d, Intracellular Ca2+ levels in HD T cells treated with DMSO or 1 μM BTP2. Cells were loaded with 2 μM Fura-2 and stimulated with 1 μM Thapsigargin (TG) in Ca2+ free Ringer solution, followed by perfusion with 2 mM extracellular Ca2+. e, T-bet protein levels in anti-CD3/28 stimulated CD4+ T cells from a HD with DMSO or 1 μM BTP2 (24 hours). Bar graphs showing relative delta MFI (rel. DMFI) of T-bet levels in stimulated HD T cells normalized to cells treated with DMSO. f, Intracellular Ca2+ levels in murine WT CD4+ T cells treated with DMSO or 1 μM BTP-2. g, T-bet protein levels in anti-CD3/28 stimulated CD4+ T cells from WT mice with DMSO or 1 μM BTP-2. Data are the means ± SEM for c, e and g. Data are from at least 3 independent experiments. Statistical analysis is performed by two-sided Student’s t test. * P < 0.05.
Extended Data Fig. 5.
Extended Data Fig. 5.. Regulation of TBX21 expression by CNS-12.
a, Analysis of chromatin accessibility of Tbx21 locus in murine CD4+ T cell by DNase I hypersensitive sites sequencing (DNase-seq). Cells were stimulated with 20 ng/ml phorbol myristate acetate (PMA) and 2 μM calcium ionophore (CaI) for 4 hours (GSE67451)95. b, Analysis of chromatin accessibility of Tbx21 locus in murine CD8+ T cells by ATAC-Seq. Cells were left untreated or pretreated with 2 μM cyclosporin A (CsA) for 15 mins and stimulated with 10 ng/ml PMA and 0.5 μM ionomycin (Iono) or left unstimulated (resting) for 2 hours (GSE93014)96. c, Analysis of chromatin accessibility, RNA polymerase II (pol II) and H3K27ac binding in TBX21 gene locus in human CD4+ and CD8+ T cells. Top two rows show ATAC-Seq data of human naive CD4+ T cells left unstimulated or stimulated with anti-CD3/CD28 for 1 day (GSE161096)97. Two middle rows show ATAC-seq data of human naïve CD8+ T cells left unstimulated or stimulated with anti-CD3/CD28 for 2 days (GSE212699). Bottom rows show ChIP-Seq analysis of Pol II and H3K27ac binding to the TBX21 gene locus in human T cells activated with anti-CD3/CD28 Dynabeads for 24 hours (GSE183883)98. d, Analysis of NFATc2 binding to CNS-12 of Tbx21 in CD4+ T cells from WT and Stim1/2CD4 mice by ChIP-qPCR. T cells were stimulated with anti-CD3/CD28 and cultured for 5 days, then restimulated with 20 nM PMA and 1 μM ionomycin for 1 hour followed by ChIP-qPCR. e, ChIP-Seq analysis of p300, H3K27ac and JUNB binding to the Tbx21 gene locus in mouse CD4+ T cells. Top three rows are from murine CD4+ T cell stimulated with anti-CD3/CD28 antibodies for 5 days (GSE207265)99. Bottom rows are from murine CD4+ T cells stimulated with 20 ng/ml phorbol myristate acetate (PMA) and 2 μM calcium ionophore (CaI) for 4 hours (GSE67443)95. The statistical significance of differences between ChIP-seq peaks of test and control groups was calculated using MACS2 v2.1.1., and for all ATAC-seq peaks using the DESEQ2 package. ***P < 0.001; **P < 0.01; *P < 0.05.
Extended Data Fig. 6.
Extended Data Fig. 6.. Effects of NFAT and STAT1 on Tbx21 transcription.
a, Two-step model of T-bet expression. b-c, Representative flow cytometry plots (left) and relative median fluorescence intensities (Rel. MFI, right) of T-bet (b), and percentage of T-bet+ cells (c). CD4+ T cells from WT mice were pretreated with DMSO or 1 μM FK506 for 30 min and then stimulated with anti-CD3/CD28 antibodies with or without exogenous IL-12 (10 ng/ml) or IFN-γ (100 ng/ml) and/or anti-IL-4 antibodies (5 ug/ml) for 3–4 days. The bar graph in (b) shows relative MFI of T-bet normalized to T-bet levels in DMSO-treated CD4+ T cells without exogenous IL-12 or IFN-γ. d, T-bet protein levels in CD4+ T cells from a HD and the PT with STIM1 mutation after stimulation of cells with anti-CD3/CD28 for 4 days in the absence or presence of exogenous IFN-γ (100 ng/ml). Shown are relative delta MFI (Rel. ΔMFI) levels of T-bet normalized to T-bet in HD T cells without IFN-γ. e-f, Tbx21 mRNA (e) and T-bet protein (f) levels in mouse CD4+ T cells from WT mice that were pretreated with anti-IFN-γ antibodies or left untreated for 1 hour followed by anti-CD3/CD28 stimulation for 24 hours (analysis by RT-qPCR) or 3–4 days (analysis by flow cytometry). The bar graph in (f) shows relative MFI of T-bet normalized to T-bet levels in DMSO-treated CD4+ T cells. g, ChIP-seq analysis of H3K27ac binding to the Tbx21 locus in mouse CD4+ T cells. Cells were activated by anti-CD3/CD28 stimulation either under neutral conditions (nc, with anti-IFN-γ and anti-IL-4 antibodies) or treatment with 100 ng/ml IFN-γ for 3 days (GSE96724) 94. h, ChIP-Seq analysis of H3K27ac binding to the Tbx21 locus in murine naïve CD4+ T cells, Th1, Th2 and Th17 cells (GSE144586)100. Data are the means ± SEM for b to f. Data are from at least 3 independent experiments. Statistical analysis is performed by two-sided Student’s t test. *** P < 0.001; **P < 0.01; *P < 0.05.
Extended Data Fig. 7.
Extended Data Fig. 7.. Regulation of Il12rb1 and Il12rb2 genes.
a-b, ChIP-Seq analysis of HDAC1, 4 and 7 binding to Il12rb1 (a) and Il12rb2 (b) loci in mouse Th17 cells (GSE92531). Boxes highlight potential gene regulatory regions. c, Analysis of HDAC1 binding to the promoter of Il12rb1 by ChIP-qPCR using mouse CD4+ T cells. Cells from WT mice were stimulated with anti-CD3/CD28 for 5 days, incubated with DMSO or 1 μM FK506 for 30 min and restimulated with 20 nM PMA and 1 μM ionomycin for 1 hour. d, Il12rb1 and Il12rb2 mRNA levels in CD4+ T cells from WT or Stim1/2CD4 mice that were cultured with DMSO or 100 nM TSA for 24 hours in the presence of 10 ng/ml IL-12. e, Analysis of chromatin accessibility, T-bet binding and GATA3 binding to the Il12rb2 locus. Top two rows show ATAC-Seq data from CD4+ T cells of WT OTII (WT) and Orai1/2CD4 (Orai1fl/fl Orai2/ Cd4Cre) OT-II mice that had been injected into TCRα/ host mice followed by infection with the PR8-OVA strain of influenza A virus (IAV) for 8 days. The middle two rows show ATAC-Seq data of CD8+ T cells from WT mice that were left untreated or pretreated with 2 μM cyclosporin A (CsA) for 15 mins and stimulated with 10 ng/ml PMA and 0.5 μM ionomycin (iono) or left unstimulated (resting) for 2 hours (GSE93014)96. Bottom rows show ChIP-Seq data from naïve mouse CD4+ T cells and Th1 cells (GSE204946)101. Boxes highlight potential gene regulatory regions. The table in e (right) summarizes information about chromatin accessibility and TF binding to the Il12rb2 locus. Data in c-d are the means ± SEM; statistical analysis was performed by two-sided Student’s t test. ***P < 0.001; **P < 0.01; *P < 0.05.
Extended Data Fig. 8.
Extended Data Fig. 8.. Model of SOCE- and NFAT-dependent T-bet expression and Th1 differentiation.
In CD4+ T cells, TCR engagement activates STIM1 to induces SOCE through ORAI1 Ca2+ channels. Increased intracellular Ca2+ activates NFAT to promote the production of IFN-γ, which binds to the IFN-γ receptor (IFNGR) and activates STAT1. Moreover, NFAT directly binds to CNS-12 of TBX21. STAT1 and NFAT synergize to induce T-bet expression and thus, Th1 differentiation. NFAT also binds to IL12RB1 and IL12RB2 genes and inhibits their expression, likely by acting as a partner of HDAC proteins (IL12RB1) and other negative regulators (IL12RB2). Lack of SOCE following TCR stimulation impairs T-bet expression when IL-12 is not present, but sensitizes T cells to IL-12 signaling by enhancing the expression of IL-12Rβ1 and IL-12Rβ2, thus promoting TBX21 expression and Th1 differentiation when IL-12 is available. Created with BioRender.com.
Fig. 1.
Fig. 1.. STIM1 c.497+776A>G splice acceptor site mutation in an immunodeficient patient.
a-b, Pedigree (a) and genomic DNA sequence (b) of the patient. The black square depicts the patient with a single nucleotide mutation in STIM1 (c.497+776A>G). Both parents are heterozygous. The genotype of a healthy brother is unknown (?). c, STIM1 mRNA expression in T cells from the patient (PT) and a healthy donor (HD) analyzed by RNA-seq and visualized by Integrative Genomics Viewer (IGV). d, RT-PCR of STIM1 exon 3–5 in T cells from the HD and PT. e, STIM1 exon structure (top) and mRNA sequences (bottom) from a HD and the PT. The new exon (4b) derived from intronic DNA in the PT’s cells is indicated in red. Stop codons are shown in bold. Coloring of exons 1–12 represents functional protein domains in STIM1 (abbreviations: cEF, canonical EF hand; hEF, hidden EF hand; SAM, sterile alpha motif; TM, transmembrane; CC, coiled-coil; P/S, proline/serine-rich; K, lysine-rich). Data are representative of 2 technical replicates of 5 biological replicates for (d). T cells from different batches or expansion cycles are considered to be biological replicates.
Fig. 2.
Fig. 2.. STIM1 mutation abolishes protein expression and SOCE.
a-b, RT-qPCR analysis of STIM1 (a, Exon 3/5, P=0.0007; Exon 1/2, P=0.0012; Exon 5/6, P=0.0006), STIM2 and ORAI1 (b, STIM2, P=0.2796; ORAI1, P=0.0913) mRNA levels in T cells from a healthy donor (HD) and the patient (PT). c, RT-PCR analysis of STIM1 mRNA levels in HD and PT T cells treated with or without CHX (100 ng/ml, 4 hours). d, Immunoblots of STIM1 protein levels in HD and PT T cells probed with antibodies recognizing STIM1 N- or C-terminal epitopes. e-f, Flow cytometry analysis of STIM1 (e, CD4+, P=0.0011; CD8+, P=0.0016) and ORAI1 (f, CD4+, P=0.0981; CD8+, P=0.9742.) protein levels in T cells. g, Analysis of SOCE by Fura-2 fluorescence in T cells from a HD, the PT and his mother (Mo) and father (Fa). Cells were stimulated with thapsigargin (TG, 1 μM) in the absence of extracellular Ca2+, followed by readdition of 2 mM Ca2+. h, Lymphocyte proliferation after phytohemagglutinin (PHA), concanavalin A (Con A) or pokeweed mitogen (PWM) stimulation, determined by 3H-thymidine incorporation. SI, stimulation index (counts per minute mitogen / CPM media alone). PHA, P=0.0008; Con A, P<0.0001; PWM, P=0.0066. Data in a, b, e, f, g, and h are the means ± SEM from at least two independent experiments with 4 biological replicates for a and 3 biological replicates for b, e, f, and h. Data are representative of 3 technical replicates of 2 biological replicates for c, d and g. Statistical analysis in a, b, e, f and h was performed by two-sided Student’s t-test. *P < 0.05; **P < 0.01; ***P < 0.001.
Fig. 3.
Fig. 3.. Transcriptional dysregulation in T cells with STIM1 c.497+776A>G mutation.
a, RNA-seq analysis of differentially expressed genes (DEGs) in CD4+ T cells from the patient (PT) vs. healthy donor (HD) that were left untreated or stimulated with anti-CD3/CD28 for 6 hours. b, Pathway and network analysis of the Molecular Signature Database with DEGs (downregulated pathways in blue). c, Top 20 dysregulated pathways by Metascape analysis of downregulated genes. d, Expression levels of DEGs related to α/β T cell differentiation (Gene set GO:0046632). e, IPA upstream regulator analysis of DEGs ranked by P value and separated by upstream signaling molecules and transcription factors. Colors indicate activation Z score. f, Epigenetic Landscape In Silico deletion Analysis (LISA) of transcriptional regulators of downregulated DEGs ranked by P value. * denotes T-bet from GSE81881 labeled as “T” by LISA. Data are from one experiment with 2 samples per cohort and stimulation condition. Fold changes were shrunk using the apeglm method, DEGs were considered significant if shrinkage of the log2 fold change (LFC) absolute value was > 0.5, and adjusted P value < 0.05. Statistical analysis in (a) by Wald t-test and correction using the Benjamini-Hochberg method; in (b) by similarity matrix calculated via a jaccard similarity coefficient method; in (c, e) by a right tailed fisher exact test; in (f) by one-sided Wilcoxon rank-sum test.
Fig. 4.
Fig. 4.. SOCE regulates T-bet expression and Th1 differentiation.
a-b, ATAC-seq analysis of chromatin accessibility at Ifng (a) and Tbx21 (b) loci in CD4+ T cells isolated from WT and Orai1/2CD4 (Orai1fl/fl Orai2/ Cd4Cre) mice and injected into TCRα/ host mice followed by infection with the PR8-OVA strain of influenza A virus (IAV) for 8 days (top). Data for in vitro cultured murine Th1, Th2 and Th17 cells from dataset GSE157597 (bottom). c, TBX21 mRNA levels in CD4+ T cells from the patient (PT) and healthy donor (HD) with or without anti-CD3/CD28 stimulation. P<0.0001 d, Representative flow cytometry plots and quantification of T-bet mean fluorescence intensity (MFI) in anti-CD3/CD28 stimulated CD4+ T cells from the PT and HD. P=0.0015. e, TBX21 mRNA levels in CD4+ T cells from a HD that were left untreated or stimulated with anti-CD3/CD28 with or without BTP2 (1 μM). P<0.0001. f-g, Representative flow cytometry plots of T-bet expression and quantification of MFIs in anti-CD3/CD28 stimulated CD4+ T cells from WT (Stim1/2fl/fl), Stim1/2CD4 (Stim1/2fl/fl Cd4Cre) and Orai1/2CD4 (Orai1/2fl/fl Cd4Cre) (f, Stim1/2CD4, P=0.0111; Orai1/2CD4, P=0.0072) or Stim1CD4 (Stim1fl/fl Cd4Cre) (g, P=0.0278) mice. h, Experimental protocol: WT, Stim1/2CD4 and Orai1/2CD4 mice were infected with IAV (PR8-OVA). Flow cytometry plots are gated on CD4+ CD44+ antigen experienced T cells from mediastinal lymph nodes (mLNs) at day 10 (Stim1/2CD4) or 15 (Orai1/2CD4) post-infection. i-l, Representative flow cytometry plots and summary bar graphs showing the frequencies of T-bet+ or CXCR3+ cells among CD4+ CD44+ T cells of WT and Stim1/2CD4 mice (i-j) or Orai1/2CD4 mice (k-l). Bar graphs in d, f, g show relative MFI values normalized to controls set to 1. Data in c-g and i-l are means ± SEM. Data in c-g are from at least three independent experiments. Data in i-l are representative of one experiment with 3–5 mice (i-j) and 6–10 mice (k-l) per cohort. Each data point indicates a biological replicate, 4 for a, 5 for d, 3 for e, 4–6 for f-g, 3–5 for i-j and 6–10 for k-l. Statistical analysis was performed by two-way ANOVA (c, e) or two-sided Student’s t-test (d, f-g, i-l). *P < 0.05; **P < 0.01; ***P < 0.001.
Fig. 5.
Fig. 5.. NFAT binds to CNS-12 to control T-bet expression.
a, ChIP-seq analysis of NFATc1 and NFATc2 binding at Tbx21 locus in mouse CD8+ T cells,. Boxes highlight potential gene regulatory regions. b-c, ChIP-qPCR analysis of NFATc2 binding to potential gene regulatory regions in Tbx21 gene. CD4+ T cells were stimulated with anti-CD3/CD28 for 4 days and restimulated with 20 nM PMA and 1 μM ionomycin for 1 hour. CD4+ T cells in (b) were treated with DMSO or 1 μM FK506. b, P<0.0001. c, P=0.0337. d-e, Tbx21 mRNA (d, P<0.0001) and T-bet protein (e, P=0.0036) levels in WT mouse CD4+ T cells that were pretreated with DMSO or FK506 for 30 mins followed by anti-CD3/CD28 stimulation for 6 hours (RT-qPCR) or 24 hours (flow cytometry). f, Tbx21 mRNA levels in WT mouse CD4+ T cells pretreated with DMSO or 11R-VIVIT peptide (1 μM, 3 hours) followed by anti-CD3/CD28 stimulation (6 hours). P=0.0009. g-h, T-bet protein levels in human CD4+ (g, P=0.0075) and CD8+ (h, P=0.0046) T cells that were pretreated with DMSO or FK506 followed by anti-CD3/CD28 stimulation (24 hours). i, CRISPR/Cas9 editing of NFAT binding region in CNS-12 of Tbx21 using sgRNA1 (“1-NGFR”) and sgRNA2 (“2-Amt”) using IRES-NGFR and IRES-Amt plasmids. j, Frequencies of NGFR+ Amt+ primary mouse CD4+ T cells after sorting. P=0.3416. k, Tbx21 and Il2 mRNA levels in sorted CD4+ T cells with or without anti-CD3/CD28 stimulation for 24 hours. Tbx21, P=0.0014; Il2, P=0.8541. Representative flow cytometry plots in e, g, and h and quantified relative MFI values normalized to controls set to 1. Data in b-h and j-k are means ± SEM. Data in b, d, g and h are from at least 3 independent experiments; data in e-f are from 2 independent experiments with three (e) and four mice (f). j-k show data from one representative experiment and 3 mice (of two experiments and 6 mice in total). Statistical analysis was performed by two-way ANOVA (b-d, f, k) or two-sided Student’s t-test (e, g-h, j). *P < 0.05; **P < 0.01; ***P < 0.001.
Fig. 6.
Fig. 6.. NFAT synergizes with STAT1 to induce T-bet expression.
a-b, Tbx21 mRNA levels in CD4+ T cells from Stim1/2CD4 or WT mice (a) and WT mice (C57BL/6) pretreated with 1 μM FK506 or DMSO for 30 min (b). T cells were stimulated with anti-CD3/CD28 with or without exogenous IFN-γ (100 ng/ml) or IL-12 (10 ng/ml) for 6 and 24 hours. P values (6 hours/24hours) in a: aCD3/28 (P=0.0015/P<0.0001), IFN-γ (P=0.0028/P<0.0001), IL-12 (P=0.0466/ P=0.1826); in b, aCD3/28 (P=0.0097/P<0.0005); IFN-γ (P<0.0001/P<0.0012), IL-12, (P=0.0016/ P=0.0216). c, T-bet protein levels in anti-CD3/CD28 stimulated CD4+ T cells from HD and the PT with or without exogenous IL-12 (10 ng/ml, 4 days). HD vs. PT: – IL-12 (P<0.0001); + IL-12 (P=0.0016). PT with or without IL-12 (P=0.0066). PT + IL-12 vs. HD without IL-12 (P=0.1625). d, STAT1 levels in anti-CD3/CD28 stimulated WT mouse CD4+ T cells (24 hours) with DMSO or FK506 (P=0.0381). e, ChIP-seq of STAT1 binding to Tbx21 in anti-CD3/28 stimulated mouse CD4+ T cells under neutral conditions (nc, with anti-IFN-γ and anti-IL-4 antibodies) or treated with 100 ng/ml IFN-γ for 3 days. STAT1 binding site highlighted in box. f, Conserved NFAT (red) and STAT (blue) binding motifs in CNS-12 site of human TBX21 and mouse Tbx21 genes. g, Tbx21, Stat1, Irf1 mRNA levels in WT mouse CD4+ T cells left untreated or stimulated with 0.3 μM ionomycin, 100 ng/ml IFN-γ, or both for 6 hours. Tbx21 (P=0.0003 and 0.0017); Stat1 (P=0.0001); Irf1 (P<0.0195). h, Tbx21 mRNA levels in untreated and anti-CD3/CD28 stimulated CD4+ T cells from Stim1/2CD4 or WT mice with or without 50 ng/ml IFN-β for 6 and 24 hours. 6 hours (P<0.0001), 24 hours (P=0.0049). i. A synergistic model for the induction of T-bet expression by NFAT and STAT1. Bar graphs in c, d show relative MFI values normalized to controls set to 1. Data in a-d, and g-h are means ± SEM. Data in a-c and g-h are from at least 3 independent experiments. Each data point indicates a biological replicate, 3 for a, b, g, h and 7 for c. Data in d is from 2 independent experiments with five mice. Statistical analysis was performed by two-way ANOVA (a-b) or two-sided Student’s t-test (c-d, g-h). *P < 0.05; **P < 0.01; ***P < 0.001.
Fig. 7.
Fig. 7.. The SOCE-calcineurin-NFAT pathway suppresses IL-12 receptor expression.
a-c, Il12rb1 and Il12rb2 mRNA levels in CD4+ T cells from WT and Stim1/2CD4 mice (a, Il12rb1, P=0.0152; Il12rb2, P=0.0255), WT mouse CD4+ T cells pretreated with FK506 (b, Il12rb1, 0.0107; Il12rb2, 0.0011) and CD4+ T cells from the patient (PT) and healthy donor (HD) (c, IL12RB1, 0.0244; IL12RB2, 0.0249) stimulated with anti-CD3/CD28 and 10 ng/ml exogenous IL-12 (24 hours). d, IL-18Rα protein levels in CD4+ T cells from WT mice polarized under Th1 conditions (anti-CD3/CD28 stimulation in the presence of 10 ng/ml exogenous IL-12 and 5 μg/ml anti-IL-4 antibodies) and treated with either DMSO or FK506 for 3–4 days. The bar graph shows relative MFI values normalized to the DMSO control set to 1 (P=0.0016). e-h, NFATc1 and NFATc2 binding to Il12rb1 and Il12rb2 gene loci. ChIP-seq analysis of NFATc1 and NFATc2 binding to Il12rb2 (e) and Il12rb1 (g) in mouse CD8+ T cells,. Boxes highlight NFAT binding sites and potential gene regulatory regions. ChIP-qPCR analysis of NFATc2 binding to Il12rb2 (f, both P<0.0001) and Il12rb1 (h, both P<0.0001) in DMSO and FK506-treated mouse CD4+ T cells followed by PMA plus ionomycin stimulation (1 hour). i, Il12rb1 and Il12rb2 mRNA levels in DMSO and TSA-treated WT mouse CD4+ T cells cultured with anti-CD3/28 antibodies and 10 ng/ml IL-12 (24 hours). Il12rb1 (P=0.0008); Il12rb2 (P=0.7383). j, Model of negative regulation of IL-12 receptor expression by the SOCE-calcineurin-NFAT pathway. Data in a-d, f, h, and i are means ± SEM. Data are from at least 3 independent experiments. Each data point indicates a biological replicate, 6 for a, 5 for b and i, 3 for c, d, f-h. Statistical analysis was performed by two-sided Student’s t-test (a-d) or two-way ANOVA (f, h-i). *P < 0.05; **P < 0.01; ***P < 0.001.

References

    1. Szabo SJ, et al. A novel transcription factor, T-bet, directs Th1 lineage commitment. Cell 100, 655–669 (2000). - PubMed
    1. Lazarevic V & Glimcher LH T-bet in disease. Nature Immunology 12, 597–606 (2011). - PMC - PubMed
    1. Yang R, et al. Human T-bet Governs Innate and Innate-like Adaptive IFN-gamma Immunity against Mycobacteria. Cell 183, 1826–1847 e1831 (2020). - PMC - PubMed
    1. Pritchard GH, Kedl RM & Hunter CA The evolving role of T-bet in resistance to infection. Nature Reviews Immunology 19, 398–410 (2019). - PMC - PubMed
    1. Lighvani AA, et al. T-bet is rapidly induced by interferon-gamma in lymphoid and myeloid cells. P Natl Acad Sci USA 98, 15137–15142 (2001). - PMC - PubMed

METHODS-ONLY REFERENCES

    1. Kaufmann U, et al. Selective ORAI1 Inhibition Ameliorates Autoimmune Central Nervous System Inflammation by Suppressing Effector but Not Regulatory T Cell Function. J Immunol 196, 573–585 (2016). - PMC - PubMed
    1. Tsvilovskyy V, et al. Deletion of Orai2 augments endogenous CRAC currents and degranulation in mast cells leading to enhanced anaphylaxis. Cell Calcium 71, 24–33 (2018). - PubMed
    1. McKenna A, et al. The Genome Analysis Toolkit: a MapReduce framework for analyzing next-generation DNA sequencing data. Genome Res 20, 1297–1303 (2010). - PMC - PubMed
    1. Li H & Durbin R Fast and accurate short read alignment with Burrows-Wheeler transform. Bioinformatics 25, 1754–1760 (2009). - PMC - PubMed
    1. Desmet FO, et al. Human Splicing Finder: an online bioinformatics tool to predict splicing signals. Nucleic Acids Res 37, e67 (2009). - PMC - PubMed

MeSH terms

LinkOut - more resources