. 2025 Mar;5(3):450-467.
doi: 10.1038/s43587-024-00791-0. Epub 2025 Feb 21.

A primary cilia-autophagy axis in hippocampal neurons is essential to maintain cognitive resilience

Affiliations

A primary cilia-autophagy axis in hippocampal neurons is essential to maintain cognitive resilience

Manon Rivagorda et al. Nat Aging. 2025 Mar.

Abstract

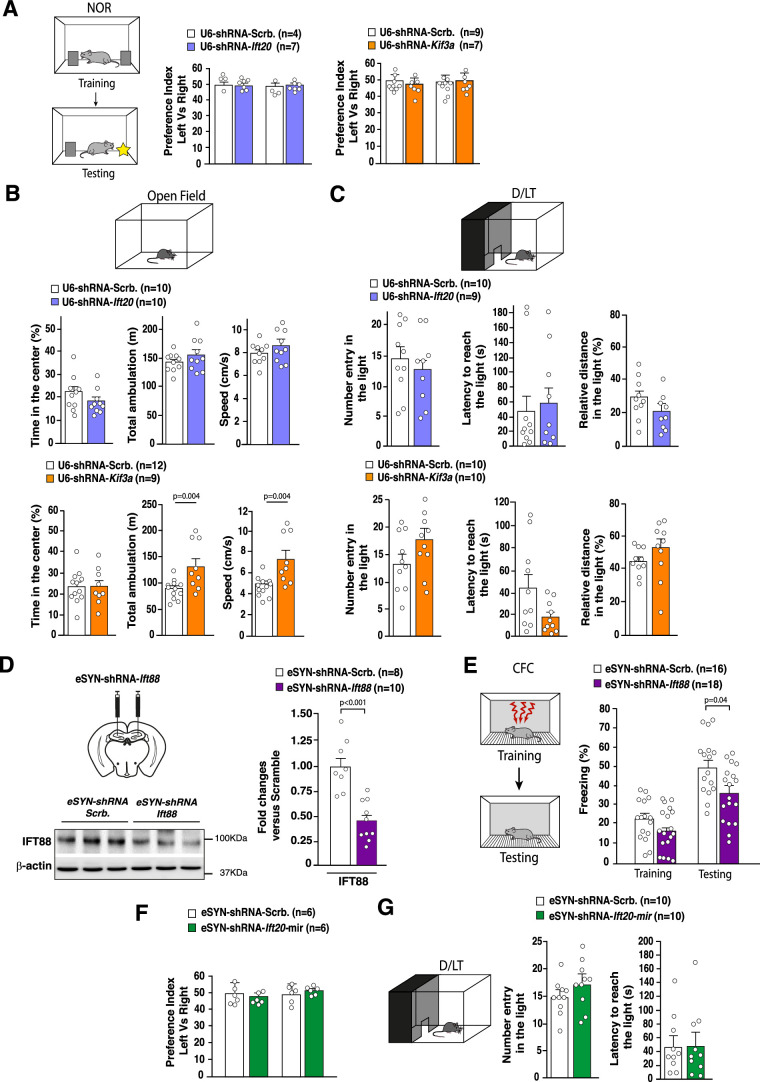
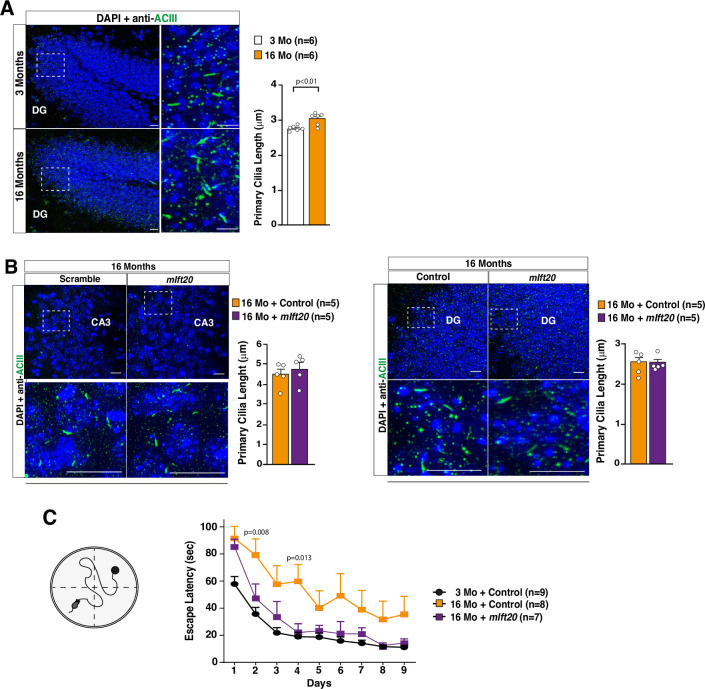
Blood-borne factors are essential to maintain neuronal synaptic plasticity and cognitive resilience throughout life. One such factor is osteocalcin (OCN), a hormone produced by osteoblasts that influences multiple physiological processes, including hippocampal neuronal homeostasis. However, the mechanism through which this blood-borne factor communicates with neurons remains unclear. Here we show the importance of a core primary cilium (PC) protein-autophagy axis in mediating the effects of OCN. We found that the OCN receptor GPR158 is present at the PC of hippocampal neurons and mediates the regulation of autophagy machinery by OCN. During aging, autophagy and PC core proteins are reduced in neurons, and restoring their levels is sufficient to improve cognitive impairments in aged mice. Mechanistically, the induction of this axis by OCN is dependent on the PC-dependent cAMP response element-binding protein signaling pathway. Altogether, this study demonstrates that the PC-autophagy axis is a gateway to mediate communication between blood-borne factors and neurons, and it advances understanding of the mechanisms involved in age-related cognitive decline.


Conflict of interest statement

Competing interests: The authors declare no competing interests.

Figures

Fig. 1
Fig. 1. GPR158 localized in PC of hippocampal neurons.
a, Volcano plot showing protein fold change between vehicle-treated and OCN-treated hippocampi. b, Protein ontology network showing enrichment for PC core proteins in the hippocampus treated with OCN versus vehicle. c, 2D image (left) and 3D rendering (right) of GPR158 (green) localization in PC from primary hippocampal neurons treated with vehicle or OCN. Scale bar, 1 µm. Graph bar represents the quantification of GPR158 spots in PC (vehicle n = 12, OCN n = 10, from two independent experiments). d, Co-immunoprecipitation of TULP3 with GPR158 or IFT20 in N2a cells and representative image of co-immunofluorescence of GPR158 (green) and TULP3 (white) in the PC stained with ACIII (orange) of hippocampal neurons. Scale bar, 1 µm. e, 2D image (top) and 3D rendering (bottom) of GPR158 (green) localization in PC from Gpr158−/− primary hippocampal neurons infected with WT or mutated Gpr158 and treated or not with OCN. Scale bar, 1 µm. Quantification of GPR158 spots found in each neuronal PC from three independent cultures (in 10–25 neurons per dot). PC was stained by ACIII in each corresponding panel. Data are represented as mean ± s.e.m. The P value was determined by two-tailed Student’s t-test compared to control group (c) or by one-way ANOVA followed by a post hoc Sidak correction (e). Source data
Fig. 2
Fig. 2. OCN–GPR158 coupling system requires core PC proteins to induce autophagy machinery in hippocampal neurons.
a, Western blot and quantification analysis of TULP3, KIF3A, IFT20, IFT88 and LCB-I/II protein levels. b, Top panels are representative fluorescent images of brain cross-sections 3 weeks after injections with AAV-eSYN-shRNAmir-scramble expressing eGFP. Left panel is a panoramic view; right panels are focus views on the DG, CA3 and cornu ammonis 1 (CA1) regions, respectively. Scale bar, 100 µm. Top right panel is the relative expression of Ift20 mRNA level in the dorsal hippocampus of mice 3 weeks after injection with AAV-eSYN-shRNA-scramble-mir or AAV-eSYN-shRNAmir-Ift20. Bottom panels represent western blot 3 weeks after hippocampal injections with AAV-eSYN-shRNA-scramble-mir or AAV-eSYN-shRNAmir-Ift20 and respective quantification of IFT20 (eSYN-Scrb n = 8 and eSYN-shRNA-Ift20 n = 9) and GPR158 (eSYN-Scrb n = 8 and eSYN-shRNA-Ift20 n = 7). c, Western blot and quantification of IFT20 (eSYN-Scrb+veh n = 4, eSYN-Scrb+OCN n = 5, eSYN-shRNA-Ift20+OCN n = 5), LC3B-I/II (eSYN-Scrb+veh n = 4, eSYN-Scrb+OCN n = 5, eSYN-shRNA-Ift20+OCN, n = 5) and Beclin-1 (eSYN-Scrb+veh n = 4, eSYN-Scrb+OCN n = 4, eSYN-shRNA-Ift20+OCN, n = 5) proteins in hippocampi, 3 weeks after injections with AAV-eSYN-shRNA-scramble-mir or AAV-eSYN-shRNA-Ift20-mir and upon stereotactic injection of vehicle or OCN. Quantification is relative to injection with AAV-eSYN1-shRNA-scramble-mir treated with vehicle. β-actin was used as a loading control for each sample in all western blot analyses. All data are expressed as mean ± s.e.m., and P values were determined by one-tailed (b, top) or two-tailed (a and b, bottom) Student’s t-tests compared to vehicle or eSYN-Scbr. In c, the P values were determined by one-way ANOVA followed by Tukey’s multiple comparison test. Source data
Fig. 3
Fig. 3. Downregulation of PC core proteins impairs autophagy machinery in hippocampal neurons.
a, LC3B and SQSTM1/p62 immunofluorescence and puncta quantification performed on brain cross-sections at the level of the hippocampal CA3 region from 3-month-old mice, 3 weeks after local stereotactic injections with AAV-U6-shRNA-Ift20, AAV-U6-shRNA-Kif3a or AAV-U6-shRNA-scramble. Scale bar, 20 µm. b, Representative western blot image and quantification of LC3B-II accumulation in 3-month-old mouse hippocampi, 3 weeks after local stereotactic injections with either eSYN-shRNA-Ift20mir or eSYN-shRNA-scramble-mir (two independent cohorts). β-actin was used as a loading control for each sample. c, SQSTM1/p62 immunofluorescence (blue) and punctae quantification in the CA3 region of the hippocampi of 3-month-old mice, 3 weeks after local stereotactic injections of AAVs expressing either eSYN-shRNA-Ift20-mir or eSYN-shRNA-scramble-mir. NeuN staining (purple) was used to label neuronal nucleus. Scale bar, 25 µm. Data were obtained from two independent cohorts. d, PC immunofluorescent staining (green, stained by ACIII) and PC length measurement in the CA3 region of mouse after stereotactic injections with either eSYN-shRNA-Ift20-mir or shRNA-scramble-mir. The length of the PC was measured and quantified in 3D using Imaris software. The length is expressed in µm, and 2–4 brain sections (n = 50–150 neurons per section) were analyzed per mouse. Scale bar, 10 µm. All data are expressed as mean ± s.e.m., and P values were determined by one-tailed (a) or two-tailed (bd) Student’s t-tests compared to Scrb. Source data
Fig. 4
Fig. 4. Selective downregulation of PC core proteins in hippocampal neurons leads to severe learning and memory impairments.
ac, Behavioral analyses performed in 3-month-old mice after hippocampal stereotactic injections with AAV-U6-shRNA-Ift20, AAV-U6-shRNA-Kif3a or their respective AAV-U6-shRNA-scramble. NOR test (a), CFC (b) and MWM test (c) were assessed 3 weeks after local AAV injections. For the NOR, discrimination and preference indexes were measured 24 h after the training phase to assess memory performances. For the CFC, the percentage of freezing was measured for the training and testing phases. For the MWM, the graph shows the time to localize a submerged platform in the swimming area. All behavioral tests were performed in two independent cohorts of animals for each group and their respective control. df, The same behavioral analyses (NOR (d); CFC (e); MWM (f)) were performed in 3-month-old mice, 3 weeks after hippocampal stereotactic injections with either eSYN-shRNA-Ift20mir (eSYN-shRNA-Ift20) or eSYN-shRNA-scramble-mir (eSYN-shRNA-Scrb.). This analysis was performed in two independent cohorts of animals for each group, for each behavioral test. g, Representative western blot and quantification of LC3B-II accumulation (LC3B-II/β-actin ratio) in mouse hippocampi stereotactically injected with either eSYN-shRNA-Ift20-mir or eSYN-shRNA-scramble-mir and after five consecutive days of daily infusion with either TAT-scramble or TAT-Beclin-1. β-actin was used as a loading control for each sample. The quantification is relative to eSYN-shRNA-scramble-mir mice injected with TAT-scramble. h, NOR performed in the same experimental conditions as Fig. 4a, in 3-month-old mice after hippocampal stereotactic injections with eSYN-shRNA-scramble-mir + TAT-scramble, eSYN-shRNA-Ift20-mir + TAT-scramble or eSYN-shRNA-Ift20mir + TAT-Beclin-1. This analysis was performed in one cohort of animals for each group. Data are expressed as mean ± s.e.m. P values were determined by one-tailed (g) or two-tailed (a, b, d, e) Student’s t-tests compared to shRNA-Scrb. The P values were determined by one-way (h) or two-way (c, f) ANOVA. Source data
Fig. 5
Fig. 5. PC core protein levels are reduced during brain aging, and their restoration is sufficient to improve age-related memory decline.
a, Relative expression of Ift20, Ift25, Ift88 and Kif3a in WT dorsal mouse hippocampi at 3, 6, 12, 16 and 23 months of age. Quantification of mRNA expression is relative to the 3-month-old WT mouse group (n = 6 per group except for 23-month-old where n = 5 for ift20, n = 5 for Ift88 and n = 4 for Kif3A). b, Representative western blot of IFT20, IFT88 and KIF3A protein levels in WT dorsal mouse hippocampi at 3, 6, 12 and 16 months of age. c, PC immunofluorescent staining (green, stained by ACIII) in the CA3 region of the hippocampus of young (3-month-old) and aged (16-month-old) mice. The length of the PC was measured and quantified in 3D using Imaris software. Scale bar, 5 µm. d, Western blot image and quantification of IFT20 protein in 3-month-old or 16-month-old mice, 3 weeks after stereotactic injections with either AAV-GFP (control) or AAV-mIft20 (expressing mouse Ift20 cDNA). e, Western blot images and quantification of IFT25, IFT88 and KIF3A levels in the same experimental groups as in d. These measurements were performed in two independent experiments. f, LC3B and SQSTM1/p62 immunofluorescence (LC3B in red and p62 in green) and puncta quantification performed on brain cross-sections, at the level of the hippocampal CA3 region of 3-month-old or 16-month-old mice, 3 weeks after stereotactic injections with AAV-GFP (control) or AAV-mIft20 cDNA. Scale bars, 20 µm. g, NOR performed in 3-month-old or 16-month-old mice, after hippocampal stereotactic injections with AAV-GFP (control) or AAV-mIft20 cDNA. Discrimination and preference indexes were measured 24 h after the training phase to assess memory performances. The NOR was performed in two independent experiments for each group of mice. β-actin was used as a loading control for each sample in all western blot analyses. Data are expressed as mean ± s.e.m., and P values were determined by one-tailed (f) or two-tailed (ce) Student’s t-tests or by one-way ANOVA (a, g). Mo, month-old. Source data
Fig. 6
Fig. 6. The PC core protein IFT20 is required to mediate the rejuvenating effects of OCN on age-related memory deficits.
a,b, Stereotactic injections with AAV-eSYN-shRNA-scramble-mir or AAV-eSYN-shRNA-Ift20-mir were performed on 3-month-old or 16-month-old mice before 28-d peripheral infusion with vehicle or OCN. In a, western blot analysis and quantification of LC3B-I/II and SQSTM1/p62 accumulation from hippocampi. In b, discrimination and preference indexes of the NOR test. The NOR test was performed in two independent experiments for each group of mice. Data are expressed as mean ± s.e.m., and P values were determined by one-tailed Student’s t-test compared to control groups (a) and by one-way ANOVA with Tukey’s multiple comparison test (b). c, Graph theory and network analysis to determine elements within the network. Nodes represent pathways or protein expression. By analyzing connections between nodes, we can identify central and peripheral nodes within a cluster (or the entire network). Central nodes are associated with the core functionality of the cluster, whereas nodes positioned at the periphery of the cluster are associated with the nodes contributing to communication coordination. d, Pathway interaction graph based on the analysis of differentially expressed proteins from our proteomic data with KEGG databases, using a graph theory approach. Pathways were ordered based on their importance within the overall network using three parameters as detailed in the main text. Pathways with a combined coefficient greater than 0.35 are listed. *: pathways closely associated with those of zone A; **: pathways belonging to zone A. e, Graph illustrating the link between PC and autophagy-related pathways. A direct link could come through a KIF3A–PRKACA interaction. f, Identification of coordinated expression patterns within pathways in d. Only proteins with a significant impact within the network connectivity were taken into account. Rap1, Ras and PI3K/Akt pathways were the closest ones to localize near the identified zone A. Within the zone A, the most representative expressed proteins were involved in the cAMP signaling pathway. g, Histogram showing the strength of coordinated expression pattern in differentially expressed proteins from the ranked signaling pathway list in d. Mo, month-old. Source data
Fig. 7
Fig. 7. CREB signaling pathway is required to mediate the autophagy machinery regulation by OCN.
a, Representative western blot and quantification of phospho-CREB and CREB protein levels in the hippocampus of 3-month-old mice, after stereotactic injections of vehicle or OCN. b, Representative western blot and quantification of LC3B-II accumulation (LC3B-II/β-actin ratio) in mature primary hippocampal neurons treated for 4 h with vehicle, OCN, CREB inhibitor (666-15) or OCN + CREB inhibitor. These measurements were obtained from two independent experiments. c, Western blot analysis and quantification of phospho-CREB and CREB in the hippocampus of 3-month-old and 16-month-old mice after stereotactic injections of vehicle or OCN. d, Western blot and quantification of phospho-CREB and CREB in 3-month-old mice previously injected in the hippocampus with AAV-eSYN1-shRNA-Ift20, AAV-U6-shRNA-Kif3a or AAV-U6/eSYN1-shRNA-scramble. e, Representative images of phospho-CREB immunofluorescence staining (red) performed at the level of the hippocampal CA3 region. Scale bar, 20 µm. Brain cross-sections of 3-month-old and 16-month-old mice collected 3 weeks after hippocampal stereotactic injections with either AAV-GFP (control) or AAV-mIft20 cDNA were used. Relative intensity quantification was measured relative to the 3-month-old mice injected with AAV-CMV-GFP. f, Western blot analysis and quantification of phospho-CREB and CREB in the hippocampus of 3-month-old and 16-month-old mice, after hippocampal stereotactic injections of either AAV-eSYN-shRNA-scramble-mir or AAV-eSYN-shRNA-Ift20-mir and peripheral chronic infusion with vehicle or OCN. The quantification is relative to 3-month-old mice injected with AAV-eSYN-shRNA-scramble-mir and treated with vehicle. These measurements were obtained from two independent cohorts of mice for each group. β-actin was used as a loading control for each sample in all western blots. Data are expressed as mean ± s.e.m., and P values were determined by two-tailed Student’s t-tests (bd, f) or by one-way ANOVA followed by Tukey’s multiple comparison test (e). Mo, month-old. Source data
Extended Data Fig. 1
Extended Data Fig. 1. GPR158 is present at the PC of hippocampal neurons.
A) PCA biplot showing that the proteomic datasets collected after stereotactic injections with either vehicle (NaCl) or OCN are orthogonal to each other. B) Bar graph representation of the top upregulated signaling pathways in differential analysis of hippocampi 4 h after stereotactic injections with either vehicle or OCN. C) Protein ontology network associated to PC-core proteins and PC functions enriched in the hippocampus after OCN treatment. D) Western blot analysis and quantification of LC3B-II accumulation in primary neurons infected with lentivirus expressing either shRNA-Gpr158 or shRNA-scramble. Independent neuronal cultures (n = 3) were treated with either vehicle, OCN, bafilomycin A1 (Baf), or OCN + Baf. E) Western blot analysis of LC3B-I, LC3B-II and IFT20 in WT and Gpr158-/- mouse hippocampi 4 h after hippocampal stereotactic injections with either vehicle or OCN. F) Schematic representation of the 5 discrete ciliary targeting (VXPX motif) sequences in the C-terminal tail of GPR158. We have generated a mutated Gpr158 version. G) Proportion of neuronal primary cilium presenting GPR158+ and ACIII+ puncta. H) Representative images of GPR158 staining in hippocampal cultures derived from either WT or Gpr158-/- mice. Scale bar=10μm. I-J) Representative images of co- immunofluorescence for GPR158 (green) and ACIII (orange) in hippocampal neurons from 3 independent experiments (I) and in WT hippocampal cross-section of the CA3 region of mice treated with OCN from 2 independent experiments (J). 1, 2, and 3 squares in I are 3D rendering images of GPR158 localization in PC from mature hippocampal neurons treated with vehicle or OCN. Scale bar=5μm. In all western blots, β-actin was used as a loading control for each sample. Data are expressed as mean ± SEM. The p values were determined by a one-tailed Student’s t-test. Source data
Extended Data Fig. 2
Extended Data Fig. 2. OCN enhances the level of core PC-proteins.
A) Representative Western blot and quantification of IFT20, IFT88, IFT25, KIF3A and TULP3 in the hippocampus 4 h after local stereotactic injections of vehicle or OCN. B) Representative Western blot and quantification of KIF3A, IFT20 and LC3B-II accumulation in 3-month-old WT, Ocn-/- or Gpr158-/- mouse hippocampi. In all western blots, β-actin was used as a loading control for each sample. The p values were determined by a one-tailed (B) or two-tailed (A) Student’s t-test. Source data
Extended Data Fig. 3
Extended Data Fig. 3. Reciprocal regulation of the GPR158-OCN coupling system and core PC protein levels.
A-C) Relative gene expression of Ift20, Ift88, Ift25, Kif3a and Tulp3 in the hippocampus of either Ocn-/- (A), Gpr158-/- (B) or WT after stereotactic injections of OCN (C). The quantification is relative to WT (A-B) or WT after vehicle stereotactic injections (C). D-E) Relative gene expression (RT-qPCR) of either Ift20 or Kif3a and representative Western blots of IFT20, KIF3A and GPR158 in 3-month-old mice hippocampi, 3 weeks after hippocampal stereotactic injections with either AAV-U6-shRNA-Ift20 (D), AAV-U6-shRNA-Kif3a (E) or their respective controls. β-actin was used as a loading control for WB analyses. F) LC3B and SQSTM1/p62 immunofluorescence and punctae quantification performed on brain cross sections at the level of the hippocampal Dentate Gyrus (DG) performed in 3-month-old mice, 3 weeks after local stereotactic injections with either AAV-U6-shRNA-Ift20, AAV-U6-shRNA-Kif3a or AAV-U6-shRNA-Scramble. Scale bar: 7 μm. Data are expressed as mean ± SEM. The p-values were determined by a two-tailed Student’s t-test compared to control (vehicle or U6-shRNA-Scrb depending on the experiment). Source data
Extended Data Fig. 4
Extended Data Fig. 4. Hippocampal downregulation of core-PC proteins does not affect exploratory- and anxiety-like behaviors.
A) As control, preference index for the (left versus right) object location during the training phase of the NOR was measured in 3-month-old mice, 3 weeks after hippocampal stereotactic injections with either AAV-U6-shRNA-Ift20, AAV-U6-shRNA-Kif3a, or their respective AAV-U6-shRNA-Scramble. The NOR was performed in two independent experiments for each group and its respective control. B-C) Open field test (OFT) (B) and Light-dark test (LDT) (C) performed in 3-month-old mice, 3 weeks after hippocampal stereotactic injections with either AAV-U6-shRNA-Ift20, AAV-U6-shRNA-Kif3a, or their respective AAV-U6-shRNA-Scramble. For the OFT, time spent in the center of the arena (%), total ambulation (meter), and speed (cm/s) were measured. For the LDT, number of entries in the light compartment, latency to reach the light box (seconds) and distance spent in the light box (%) were measured. These analyses were performed on 1 cohort of mice for each group. D) Representative western blot and quantification of IFT88 in mouse hippocampi, 3 weeks after stereotactic injections with either eSYN-shRNA-Ift88-mir or eSYN-shRNA-Scramble-mir. β-actin was used as a loading control for each sample. This analysis was performed on 2 independent cohorts of mice for each group. E) Contextual Fear Conditioning test (CFC) performed in 3-month-old mice, 3 weeks after stereotactic injections with either eSYN-shRNA-Ift88-mir or eSYN-shRNA-Scramble-mir. Percent freezing was measured for the training and testing phases. The CFC was performed in 2 independent cohorts of mice. F-G) Preference index for the (left versus right) object location during the training phase of the NOR (F), and number of entries in the light compartment and latency to reach the light box (seconds) during the Light-dark test (LDT) (G) performed in 3 month-old mice, 3 weeks after hippocampal stereotactic injections with either eSYN-shRNA-Ift20-mir or eSYN-shRNA-Scramble-mir. Data are expressed as mean ± SEM.The p values were determined by a two-tailed Student’s t-test compared to U6-shRNA-Scrb in B and C or to eSYN-shRNA-Scrb in D, E and G. Source data
Extended Data Fig. 5
Extended Data Fig. 5. Restoration of neuronal IFT20 levels in old hippocampi reverses age-related cognitive deficits, without changing PC size.
A) Primary cilia immunofluorescent staining (ACIII antibody) in the DG region of the hippocampus of from young (3Mo) and aged (16Mo) mice. The length of the primary cilia was measured and quantified in 3D using the Imaris software. Scale bar: 5 μm. B) Primary cilia length quantification obtained after immunofluorescent staining (ACIII) in the CA3 (left panel) and DG (right panel) regions of the hippocampus of 16 month-old mice, 3 weeks after local stereotactic injections with either AAV-Ift20 cDNA (mIft20) or AAV-GFP (Control). The length of the primary cilia was measured and quantified in 3D using the Imaris software. Scale bar: 10 μm. C) Morris water maze test (MWM) performed in 3- and 16-month-old mice, 3 weeks after local stereotactic injections with either AAV-Ift20 cDNA or AAV-GFP (Control). The MWM was performed in 1 cohort of mice. Data are expressed as mean ± SEM. The p values were determined by a two-tailed Student’s t-test compared to 3 Mo in A and by a Two-way ANOVA with multiple comparison in C. Source data
Extended Data Fig. 6
Extended Data Fig. 6. OCN treatment in old mice improves core PC-protein levels in hippocampus, without reversing PC length.
A) Representative western blot image and quantification of IFT20, KIF3A, and TULP3 in 16- month-old mice 4 h after hippocampal stereotactic injection of either vehicle or OCN. β-actin was used as a loading control for each sample. The quantification is relative to Veh. injected group. B) Primary cilia length quantification obtained after immunofluorescent staining (ACIII antibody) in the CA3 (left panel) region of the hippocampus of 3 and 16- month-old mice after peripheral chronic infusion (peripheral osmotic minipumps) with either vehicle or OCN. The length of the primary cilia was measured and quantified in 3D using the Imaris software. Scale bar: 10 μm. Data are expressed as mean ± SEM. The p values were determined by a two-tailed Student’s t-test compared to veh in A and by a one-way ANOVA with multiple comparison followed by a Tukey test in B. Source data
Extended Data Fig. 7
Extended Data Fig. 7. OCN enhances CREB phosphorylation and LC3B levels in the CA3 region of hippocampus.
A-B) Phospho-CREB (A) and LC3B (B) immunofluorescence and quantification (relative intensity) performed on brain cross-sections (hippocampal CA3, Dentate Gyrus (DG) and CA1 regions) of 3-month-old mice 4 h after hippocampal stereotactic injection with either vehicle or OCN. Puncta analysis was performed using Icy Software. Scale bar: 50 μm. C) Phospho-CREB immunofluorescence and quantification (relative intensity) performed on brain cross-sections (hippocampal DG region) of 3- and 16-month-old mice, 3 weeks after local stereotactic injections with either AAV-GFP (Control) or AAV-mIft20 cDNA. The analysis was performed in 1 cohort of mice. Scale bar: 20 μm. D) Relative gene expression of c-Fos in the hippocampi of 3-month-old mice previously injected in the hippocampus with either AAV-eSYN-shRNA-Ift20mir or eSYN-shRNA-Scramble-mir. The mice were subjected to stereotactic injection of either vehicle or OCN. Data are expressed as mean ± SEM. The p values were determined by a one-tailed (A, B, D) or a two-tailed (C) Student’s t-test. Source data

References

    1. Lopez-Otin, C., Blasco, M. A., Partridge, L., Serrano, M. & Kroemer, G. Hallmarks of aging: an expanding universe. Cell186, 243–278 (2023). - PubMed
    1. Kramer, A. F. et al. Ageing, fitness and neurocognitive function. Nature400, 418–419 (1999). - PubMed
    1. Bishop, N. A., Lu, T. & Yankner, B. A. Neural mechanisms of ageing and cognitive decline. Nature464, 529–535 (2010). - PMC - PubMed
    1. Fan, X., Wheatley, E. G. & Villeda, S. A. Mechanisms of hippocampal aging and the potential for rejuvenation. Annu. Rev. Neurosci.40, 251–272 (2017). - PubMed
    1. Bartsch, T. & Wulff, P. The hippocampus in aging and disease: from plasticity to vulnerability. Neuroscience309, 1–16 (2015). - PubMed

Substances

LinkOut - more resources