. 2025 Apr;44(7):2106-2133.
doi: 10.1038/s44318-025-00390-8. Epub 2025 Feb 21.

Different Ras isoforms regulate synaptic plasticity in opposite directions

Affiliations

Different Ras isoforms regulate synaptic plasticity in opposite directions

Esperanza López-Merino et al. EMBO J. 2025 Apr.

Abstract

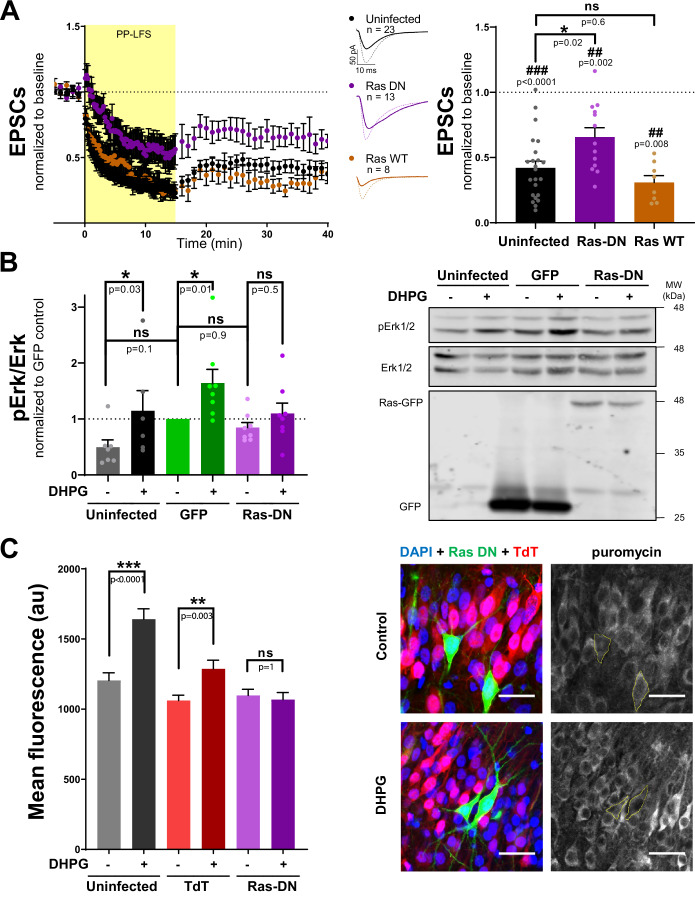
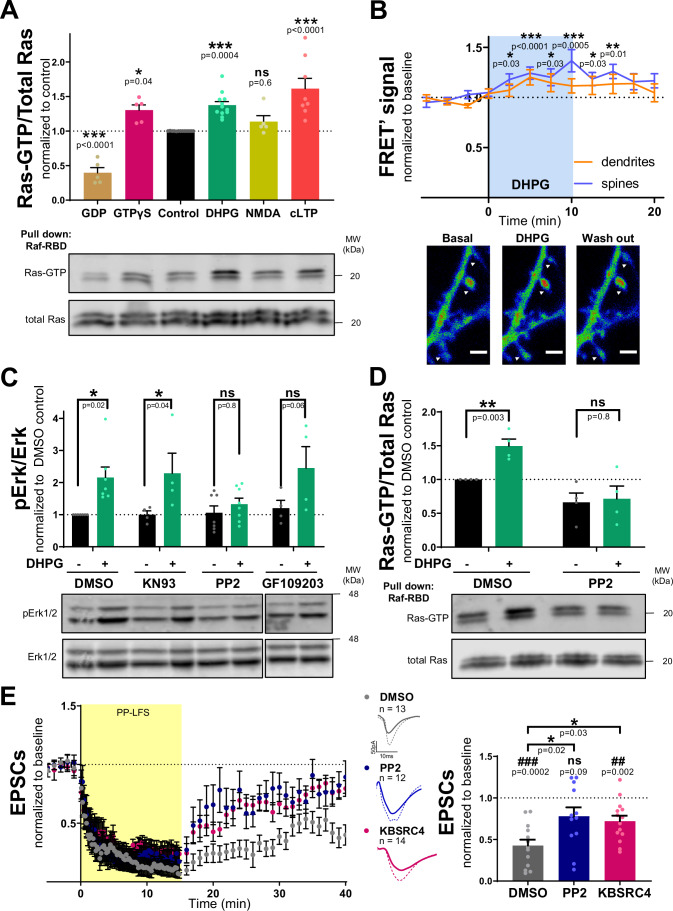
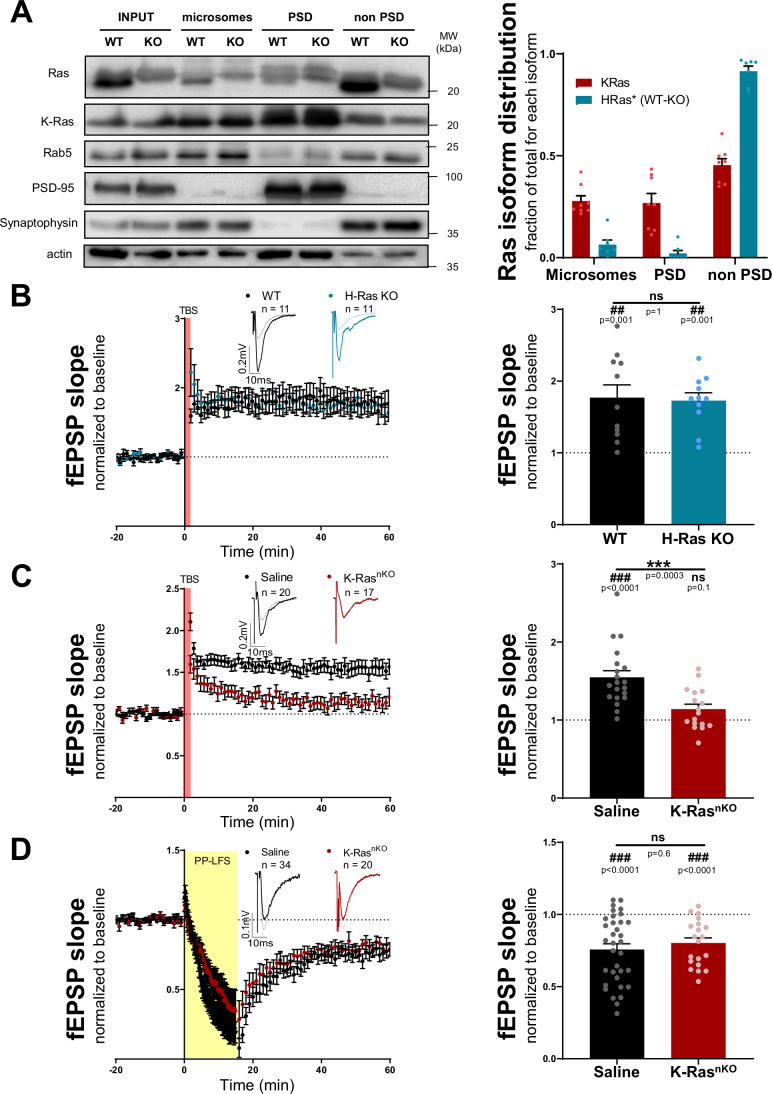
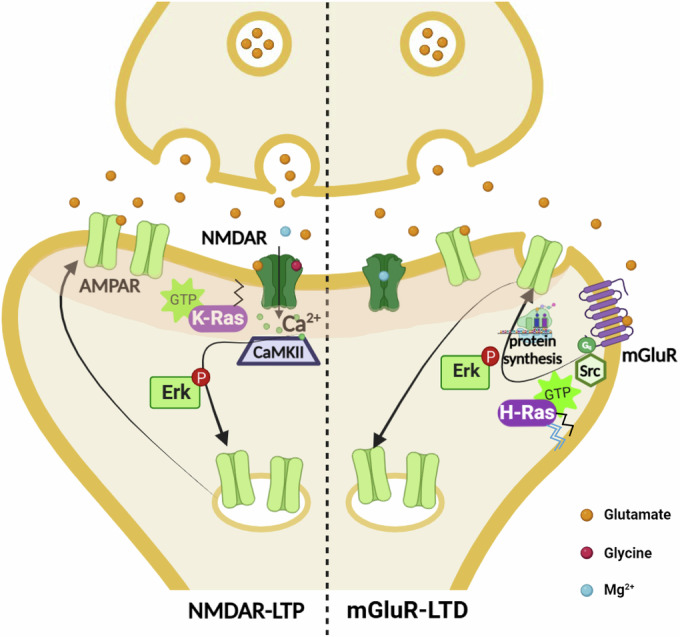
The small GTPase Ras is an intracellular signaling hub required for long-term potentiation (LTP) in the hippocampus and for memory formation. Genetic alterations in Ras signaling (i.e., RASopathies) are linked to cognitive disorders in humans. However, it remains unclear how Ras controls synaptic plasticity, and whether different Ras isoforms play overlapping or distinct roles in neurons. Using genetically modified mice, we show here that H-Ras (the most abundant isoform in the brain) does not promote LTP, but instead long-term depression mediated by metabotropic glutamate receptors (mGluR-LTD). Mechanistically, H-Ras is activated locally in spines during mGluR-LTD via c-Src, and is required to trigger Erk activation and de novo protein synthesis. Furthermore, H-Ras deletion impairs object recognition as well as social and spatial memory. Conversely, K-Ras is the isoform specifically required for LTP. This functional specialization correlates with a differential synaptic distribution of the two isoforms H-Ras and K-Ras, which may have important implications for RASopathies and cognitive function.

Keywords: Hippocampus; Memory; RASopathies; Spine; mGluR.


Conflict of interest statement

Disclosure and competing interests statement. The authors declare no competing interests.

Figures

Figure 1
Figure 1. Effect of blocking Ras activity on mGluR-LTD and its related signaling.
(A) Time course (left) of normalized AMPAR-mediated EPSCs during baseline and up to 40 min after mGluR-LTD induction (PP-LFS, 1 Hz) of CA1 hippocampal neurons from organotypic slices expressing Ras-DN (purple), Ras WT (orange) or control (uninfected) neurons. Representative traces are shown for baseline responses (dashed line) and for the last 10 min of the recording (thick line). Quantification (right) of the extent of depression 30–40 min after induction. Results are normalized to baseline and expressed as mean ± SEM; individual values are also represented. Wilcoxon signed-rank test (#) was used to statistically assess the extent of depression. Krustal-Wallis [H(2,44) = 10.0, p = 0.007] + Dunn’s post-test (*) was used to evaluate significant differences between conditions. (B) Quantification (left) and representative Western blot (right) of phospho-Erk (pErk) and Erk signals from CA1 region of hippocampal slices uninfected (black) or infected with Sindbis viruses expressing GFP (green) or Ras-DN-GFP (purple) and stimulated with DHPG. Phospho-to-total ratio was calculated and normalized to GFP control condition. Results are expressed as mean ± SEM and individual values are also represented, n = 6–8 independent slice batches. Mixed effects analysis [F(1,7) = 19, p = 0.003] + Sidak’s post-test (*) was used to evaluate DHPG effect for each condition. (C) Quantification (left) and representative images (right) of protein synthesis levels, measured as puromycin labeling from cultured hippocampal slices. Scale bars 30 μm. 80–156 neurons uninfected or infected with Sindbis viruses expressing TdTomato (TdT) or Ras-DN-GFP were analyzed. 10 control slices and 14 DHPG stimulated were used. Yellow lines circle Ras-DN-infected neurons. Results are represented as mean ± SEM. Mixed effects analysis [F(1,696) = 22.8, p < 0.0001] + Sidak’s post-test (*) was used to evaluate DHPG effect for each condition. ns, non-significant. Source data are available online for this figure.
Figure 2
Figure 2. Ras activation during mGluR-LTD.
(A) Quantification (upper panel) and representative Western blot (lower panel) of active Ras pulled-down vs total Ras from hippocampal slice cultures after inducing different chemical plasticity protocols. Both Ras bands were quantified together and results were normalized to control, non-stimulated slices (dashed line) and expressed as mean ± SEM, n = 5–13 independent slice batches; individual values are also represented. One-way ANOVA [F(5,42) = 23.7, p < 0.0001] + Dunnett’s post-test (*) was used to evaluate Ras activation compared to control. (B) Time course of Ras activity upon DHPG stimulation in spines (blue, n = 50) and dendrites (orange, n = 15) of CA1 pyramidal cells (n = 10) evaluated by FRET. Results are represented as mean ± SEM. Representative images of the FRET signal from dendritic branches of CA1 neurons coexpressing H-Ras-GFP and FRas2-M obtained during the time course are shown. Scale bars 2 μm. White arrows point dendritic spines. Kruskal–Wallis [H(11,571) = 53.8, p < 0.0001 for spines, and H(11,178) = 14.1, p = 0.2 for dendrites] + Dunn’s post-test (*) was used to evaluate differences across time (comparing to baseline). (C) Quantification (upper panel) and representative Western blot (lower panel) of phospho-Erk (pErk) and Erk signals from hippocampal slices treated with vehicle (DMSO) or inhibitors of CaMKII (KN93), Src family (PP2) or PKC (GF109203) in response to DHPG stimulation (green columns). The phospho-to-total ratio was calculated and normalized to DMSO control condition. Results are expressed as mean ± SEM and individual values are also represented, n = 4–8 independent slice batches. Mixed effects analysis [F(1,7) = 30.0, p = 0.0009] + Sidak’s post-test (*) was used to evaluate DHPG effect for each condition. (D) Quantification (upper panel) and representative Western blot (lower panel) of active Ras pulled-down vs total Ras from hippocampal slice cultures treated with vehicle DMSO or PP2 and stimulated with DHPG. Results are normalized to vehicle non-stimulated slices and expressed as mean ± SEM, n = 4 independent slice batches; individual values are also represented. Mixed effects analysis [F(1,6) = 18.6, p = 0.005] + Sidak’s post-test (*) was used to evaluate DHPG effect for each condition. (E) Time course (left) of normalized AMPAR-mediated EPSCs from baseline to 40 min after mGluR-LTD induction (PP-LFS, 1 Hz) from organotypic slices treated with DMSO (gray), Src family inhibitor PP2 (blue) or c-Src inhibitor KBSRC4 (pink). Representative traces are shown for baseline responses (dashed line) and for the last 10 min of the recording (thick line). Quantification (right) of the extent of depression 30–40 min after induction. Results are normalized to baseline and expressed as mean ± SEM; individual values are also represented. Wilcoxon signed-rank test (#) was used to assess statistically the extent of depression. Kruskal–Wallis [H(2,39) = 8.2, p = 0.02] + Dunn’s post-test (*) was used to evaluate significant differences between conditions. ns, non-significant. Source data are available online for this figure.
Figure 3
Figure 3. H-Ras KO mice have altered object recognition, spatial and social memory.
(A) Distance traveled in the open field test, divided in 1 min intervals and diagram of the open field arena (upper inset). (B) Total time spent in the different open field areas. (C) Spontaneous alternation index in the Y-maze test. (D) Quantification of time sniffing the objects during the reexposure phase, compared to the familiarization phase (left) and discrimination index for the novel object in the third phase (right) (diagram above the graphs). (E) Contextual fear conditioning test diagram (upper left) and percentage of time spent freezing upon reexposure to the context 24 h after training (lower left). Cued fear conditioning test diagram (upper right) and percentage of time spent freezing upon reexposure to the shock-paired tone 24 h after training (lower right). (F) Social preference task diagram (upper left) and discrimination index of the subject (lower left). Social novelty preference diagram (upper right) and discrimination index of the novel subject (lower right). Mixed effects analysis was used for (A, B) [F(1,27) = 0.2, p = 0.7 for (A) and F(1,28) = 1.3, p = 0.3 for (B)]. For (CF), Wilcoxon signed-rank test (#) was used to assess statistically the pertinent learning index (spontaneous alternation, reduction in exploration or discrimination indexes). Mann-Whitney test (*) was used to evaluate differences between genotypes; ns, non-significant. (AD, F): n = 15 mice for WT and 14 mice for H-Ras KO. (E) Context memory: n = 10 mice for WT and 11 mice for H-Ras KO. (E) Cued memory: n = 15 mice for WT and 11 mice for H-Ras KO. Source data are available online for this figure.
Figure 4
Figure 4. H-Ras is required postsynaptically for mGluR-LTD.
(A) Input/output curves of fEPSP slopes vs stimulation intensities from acute hippocampal slices performed in CA1 area. Representative traces are shown in the upper part. Mean ± SEM; Mixed effects analysis [F(1,98) = 6.0, p = 0.02] + Sidak’s post-test (*) was used to evaluate differences between genotypes. (B) Quantification of the paired-pulse ratio of fEPSPs. Mean ± SEM and individual values are represented. Representative traces are shown in the upper part. Wilcoxon signed-rank test (#) was used to assess statistically the degree of facilitation. Mann-Whitney test (*) was used to evaluate significant differences between genotypes. n = 27 (WT) and 29 (H-Ras KO) slices. (C) Time course (left) of normalized fEPSPs from baseline to 60 min after mGluR-LTD induction (PP-LFS, 1 Hz). Representative traces of baseline responses (dashed line) and for the last 10 min of the recording (thick line) are shown as inset. Quantification (right) of the extent of depression 50–60 min after induction. Results are normalized to baseline and expressed as mean ± SEM; individual values are also represented. Wilcoxon signed-rank test (#) was used to assess statistically the depression. Mann-Whitney test (*) was used to evaluate statistical differences between genotypes. (D) Whole-cell voltage-clamp recordings of CA1 pyramidal neurons from hippocampal organotypic slices of H-Ras KO animals. Recordings were carried out from uninfected neurons (blue) and neighboring neurons infected with Sindbis virus expressing Ras WT (orange) or Ras C181,184S (green). Time course (left) of normalized AMPAR-mediated EPSCs from baseline to 40 min after mGluR-LTD induction (PP-LFS, 1 Hz). Representative traces of baseline responses (dashed line) and for the last 10 min of the recording (thick line) are shown as inset. Quantification (right) of the extent of depression 30–40 min after induction. Results are normalized to baseline and expressed as mean ± SEM; individual values are also represented. Wilcoxon signed-rank test (#) was used to assess statistically the extent of depression. Kruskal–Wallis [H(2,30) = 7.2, p = 0.03] + Dunn’s post-test (*) was used to evaluate significant differences between conditions. (E) Quantification of GFP-Ras spine/dendrite ratio (left) n = 25 (H-Ras) and 32 (H-Ras C181,184S) spines. Results are expressed as mean ± SEM. Representative images (right) of CA1 pyramidal neurons and its dendritic branches expressing GFP-Ras WT and GFP-Ras C181,184S. Scale bars 15 (left) and 2 (right) μm. White arrows point dendritic spines. Mann-Whitney test (*) was used to assess statistical differences. ns, non-significant. (F) Comparative scheme of the protein sequence at the C-terminal hypervariable region for the different Ras isoforms, including amino acid residues that undergo post-translational modifications such as farnesylation and palmitoylation. Modified from (Prior and Hancock, 2001). Source data are available online for this figure.
Figure 5
Figure 5. K-Ras, not H-Ras, is required for NMDAR-LTP.
(A) Representative Western blot (left) of hippocampal total Ras, K-Ras, Rab5, PSD-95 and synaptophysin subcellular fractionation. H- and K-Ras distribution in microsomes, PSD and non-PSD fractions (right) were quantified as percentage of total protein (from inputs) for each isoform. H-Ras signal was obtained by subtracting total Ras signal of H-Ras KO mice from that of WT mice. Results expressed as mean ± SEM, n = 7–8 animals per condition; individual values are also represented. (BD) Time course (left) of normalized fEPSPs from baseline to 60 min after NMDAR-LTP induction (TBS) (B, C) or mGluR-LTD induction (PP-LFS, 1 Hz) (D), recorded from H-Ras KO mice (B) or K-Ras neuronal KO mice (C, D). Representative traces of baseline responses (dashed line) and for the last 10 min of the recording (thick line) are shown as insets. Quantification (right) of the extent of potentiation/depression 50–60 min after induction. Results are normalized to baseline and expressed as mean ± SEM; individual values are also represented. Wilcoxon signed-rank test (#) was used to assess statistically the potentiation/depression. Mann-Whitney test (*) was used to evaluate statistical differences between genotypes. ns, non-significant. Source data are available online for this figure.
Figure 6
Figure 6. Schematic model for Ras signaling and isoform specificity during NMDAR-LTP and mGluR-LTD.
NMDAR-LTP is mediated by K-Ras, coupling Ca2+ and CaMKII activity to Erk signaling and AMPAR delivery into synapses (Araki et al, ; Chen et al, ; Qin et al, 2005). Conversely, mGluR-LTD involves Src-mediated H-Ras activation and subsequent stimulation of Erk signaling and protein synthesis leading to removal of synaptic AMPAR. Created with Biorender.
Figure EV1
Figure EV1. Effect of Ras dominant negative on basal synaptic transmission.
Scatter plot of simultaneous recordings of AMPAR- or NMDAR-mediated responses from uninfected and Ras-DN (A) or Ras WT (B) infected neurons (left). Representative traces (middle). Quantification of AMPA/NMDA ratio (right) represented as mean ± SEM; individual values are also plotted. Mann-Whitney test was used to evaluate significant differences. ns, non-significant.
Figure EV2
Figure EV2. H-Ras-GFP and FRas2-M fluorescence during DHPG treatment.
Left. Time course of H-Ras-GFP and FRas2-M signal in spines (n = 50) and dendrites (n = 15) of CA1 pyramidal cells (n = 10) upon DHPG stimulation. Results are represented as mean ± SEM. Kruskal–Wallis test was used to evaluate differences across time. [H(11,571) = 15.1, p = 0.2 for FRas2-M and H(11,571) = 18.8, p = 0.06 for Ras-GFP]. Right. Representative images of dendritic branches of CA1 neurons coexpressing H-Ras-GFP (green channel) and FRas2-M (red channel) constructs. Scale bars 2 μm. White arrows point dendritic spines.
Figure EV3
Figure EV3. Hippocampal levels of different synaptic and signaling proteins and animal behavior in H-Ras KO mice.
(A) Representative Western blots (upper) and quantification (lower) of Ras proteins and different Ras effectors, signaling molecules and glutamate receptors. Some blots have been reused from Fig. 5 (inputs of K-Ras, Rab5, PSD-95, synaptophysin), as they come from the same experiment/animal. Unless otherwise indicated, each sample is normalized to actin levels and results are referred to WT animals and represented as mean ± SEM, n = 6 animals per condition. Wilcoxon signed-rank test (*) was used to evaluate changes; non-significant differences were found except for total Ras levels. (B) Total distance traveled in the open field test and in the different subsections of the arena. Mean ± SEM; individual values are also represented. Mixed effects analysis was used to evaluate differences between genotypes [F(1,27) = 0.2, p = 0.7]. (C) Mean speed in the open field test. Mean ± SEM; individual values are also represented. Mann-Whitney test was used to evaluate differences between genotypes (p = 0.9). (B, C) n = 15 mice for WT and 14 mice for H-Ras KO. (D) Percentage of time spent freezing during fear conditioning training session. T, tone; ITI, inter-tone interval. Mean ± SEM is represented. Mixed effects analysis was used to evaluate differences between genotypes [F(1,45) = 0.1, p = 0.8]. n = 25 mice for WT and 22 mice for H-Ras KO.
Figure EV4
Figure EV4. Analysis of basal transmission and Ras activity in H-Ras KO mice.
(A) Fiber volley responses over increasing stimulation intensities during input/output curve measurements shown in Fig. 4A. Mean ± SEM; Mixed effects analysis [F(1,92) = 0.1, p = 0.8]. (B) Quantification (lower panel) and representative blot (upper panel) of active Ras pulled-down vs total Ras from acute hippocampal slices of WT and H-Ras KO mice 10 min after DHPG treatment. Results are normalized to control non-stimulated slices (in WT or KO mice) and expressed as mean ± SEM, n = 7–9 independent slices/mice. Wilcoxon signed-rank test (*) was used to assess statistically the effect of DHPG. ns, non-significant. (C) Representative blot of Ras and GFP in organotypic hippocampal slices infected with H-Ras WT and H-Ras C181,184S, or uninfected (uninf.). Note that both endogenous Ras (~21 KDa) and recombinant Ras-GFP (~48 KDa) were detected at their appropriate sizes. Actin was used a protein loading control.
Figure EV5
Figure EV5. Analysis of Ras distribution, expression, and activity in H-Ras and neuronal K-Ras KO mice.
(A) Representative blots (lower pannel) of total Ras and K-Ras in different subcellular compartments following DHPG stimulation in hippocampal slices from WT and H-Ras KO mice. H- and K-Ras distribution in microsomes, PSD and non-PSD fractions was quantified (upper panel) as percentage of total protein (from inputs) for each isoform. H-Ras signal was obtained by subtracting total Ras signal of H-Ras KO mice from that of WT mice. Results expressed as mean ± SEM, n = 6–8 animals per condition (controls from Fig. 5A were included in the quantification); individual values are also represented. Mann-Whitney test was used to evaluate DHPG effect in each fraction compared to control, non-stimulated slices. (B) Representative image of mCherry fluorescence (red) and DAPI staining (blue) of a hippocampal slice from AAV-CaMKII-mCherry-Cre-infected K-Rasflox/flox mice (lower panels: zoom-in images of CA1 region). Scale bars 200 (upper) and 20 (lower) μm. (C) Representative Western blots (left) and quantification (right) of K-Ras and total Ras hippocampal levels. Results are normalized to saline average levels and expressed as mean ± SEM; individual values are also represented. Mann-Whitney test (*) was used to evaluate statistical differences. n = 9 (WT) and 10 (K-Ras nKO) mice. (D) Input/output curves of fEPSP slopes vs stimulation intensities. Representative traces are shown in the upper part. Mean ± SEM; Mixed effects analysis was used to assess statistical differences between genotypes [F(1,132) = 1.0, p = 0.3]. (E) Quantification (left) and representative blot (right) of active K-Ras pulled-down vs total K-Ras from mouse organotypic hippocampal slices 10 min after cLTP treatment. Results are normalized to control non-stimulated slices and expressed as mean ± SEM, n = 9. Wilcoxon signed-rank test (*) was used to assess statistically the effect of cLTP induction. ns, non-significant.

References

    1. Agudo-Ibáñez L, Herrero A, Barbacid M, Crespo P (2015) H-Ras distribution and signaling in plasma membrane microdomains are regulated by acylation and deacylation events. Mol Cell Biol 35:1898–1914 - PMC - PubMed
    1. Araki Y, Rajkovich KE, Gerber EE, Gamache TR, Johnson RC, Tran THN, Liu B, Zhu Q, Hong I, Kirkwood A, Huganir R (2024) SynGAP regulates synaptic plasticity and cognition independently of its catalytic activity. Science 383:eadk1291 - PMC - PubMed
    1. Araki Y, Zeng M, Zhang M, Huganir RL (2015) Rapid dispersion of SynGAP from synaptic spines triggers AMPA receptor insertion and spine enlargement during LTP. Neuron 85:173–189 - PMC - PubMed
    1. Banko JL, Hou L, Poulin F, Sonenberg N, Klann E (2006) Regulation of eukaryotic initiation factor 4E by converging signaling pathways during metabotropic glutamate receptor-dependent long-term depression. J Neurosci 26:2167–2173 - PMC - PubMed
    1. Barbacid M (1987) ras genes. Annu Rev Biochem 56:779–827 - PubMed

MeSH terms

LinkOut - more resources