. 2025 May;12(18):e2405914.
doi: 10.1002/advs.202405914. Epub 2025 Feb 22.

Spatiotemporal Transcriptomic Profiling Reveals the Dynamic Immunological Landscape of Alveolar Echinococcosis

Affiliations

Spatiotemporal Transcriptomic Profiling Reveals the Dynamic Immunological Landscape of Alveolar Echinococcosis

Zhihua Ou et al. Adv Sci (Weinh). 2025 May.

Abstract

Alveolar echinococcosis (AE) is caused by the chronic infection of E. multilocularis, whose tumor-like growth can lead to high fatality if improperly treated. The early diagnosis of infection and the treatment of advanced AE remain challenging. Herein, bulk RNA-seq, scRNA-seq, and spatial transcriptomics technologies are integrated, to reveal the host immune response mechanism against E. multilocularis both spatially and chronologically, collecting mouse liver samples at multiple timepoints up to 15 months post infection. These results unveil an unprecedented high-resolution spatial atlas of the E. multilocularis infection foci and the functional roles of neutrophils, Spp1+ macrophages, and fibroblasts during disease progression. The heterogeneity of neutrophil and macrophage subpopulations are critical in both parasite-killing and the occurrence of immunosuppression during AE progression. These findings indicate the transition of parasite control strategy from "active killing" to "negative segregation" by the host, providing instructive insights into the treatment strategy for echinococcosis.

Keywords: Echinococcus multilocularis; macrophages; neutrophils; single‐cell RNA sequencing; spatial transcriptomics.


Conflict of interest statement

A.C., S.L., and X.X. have patents associated with Stereo‐seq technology. The other authors declare no competing interests.

Figures
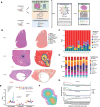
Figure 1
Figure 1
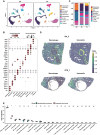
Spatiotemporal transcriptomic profiling of mouse liver infected with Echinococcus multilocularis. A) Workflow of this study. n indicates the number of samples. B) Cell type annotation results of three representative Stereo‐seq slides. H&E staining was performed using the tissue section immediately adjacent to the tissue section used for Stereo‐seq. The star mark indicates protoscoleces (PSCs), while the arrow indicates the microcyte of Echinococcus multilocularis. Analytical unit for Stereo‐seq slides: bin100 (49.72 × 49.72 µm). D0_1: 0 day post infection, sample No.1; D4_2: 4 days post infection, sample No.2; D79_1: 79 days post infection, sample No.1. Cho: cholangiocyte; HsPC: hepatic stem/progenitor cell; MoMF: monocyte‐derived macrophages. C) Cell compositions of mouse liver samples collected at different timepoints based on Stereo‐seq data. D) Cell compositions of mouse liver samples collected at different timepoints (n = 55). The cell types were deconvoluted based on bulk RNA‐seq data. EC: endothelial cell; Gran: granulocyte. E) The numbers of macrophages, neutrophils, and fibroblasts were significantly increased in mouse liver after E. multilocularis infection. The cell types were deconvoluted based on bulk RNA‐seq data (n = 55). Data are displayed as boxplots. Statistical significance was determined by unpaired two‐tailed Wilcoxon rank‐sum test. Asterisks indicate the level of statistical significance between groups: *p < 0.05; **p < 0.01; ***p < 0.001. F) Schematic graph showing the layer distribution from the AE lesion center to distal region, based on Sample D4_2. G) Gene Set Variation Analysis (GSVA) scores showing the distribution of neutrophils, fibroblasts, Spp1+ MoMFs, and hepatocytes from the center to the distal region of the AE lesions of different timepoints.
Figure 2
Figure 2
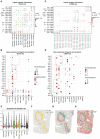
Cellular composition differences between the distal‐ and peri‐lesion region of AE lesions in the liver. A) UMAP of cells identified from the scRNA‐seq data of liver tissues (n = 4) collected from two mice infected by Echinococcus multilocularis for 15 months. DL: distal‐lesion (left); PL: peri‐lesion (right). B) Expression of cell‐type marker genes by the cell types identified from the scRNA‐seq data of mouse livers. C) Comparison of cell type compositions between uninfected liver, DL, and PL groups. D) Deconvolution of neutrophils and macrophages in Stereo‐seq data with Tangram using the scRNA‐seq data as a reference. A higher ratio indicates a better match of the cell types. E) Deconvolution of liver bulk RNA‐seq data from AE patients. Dataset: GSE124362, n = 6. Data are displayed as boxplots. Statistical significance was determined using the two‐sided Wilcoxon rank‐sum test. Asterisks indicate the level of statistical significance between groups: *p < 0.05; **p < 0.01; ***p < 0.001. ns, no significant difference; nd, not detected.
Figure 3
Figure 3
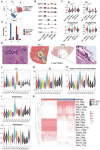
Transcriptional, morphological, and functional heterogeneity of neutrophil subpopulations. A) UMAP of two neutrophil subpopulations identified from the Stereo‐seq data of mouse liver tissues. Il1b hi Neu, neutrophils highly expressing Il1b; Mpohi Neu, neutrophils highly expressing Mpo. B) Dot plot showing the expression of selected DEGs in Il1b hi Neu and Mpohi Neu. C) Proportions of Il1b hi Neu and Mpohi Neu in mouse liver samples collected at different timepoints based on Stereo‐seq data. D) Spatial distribution of Il1b hi Neu and Mpo hi Neu in mouse livers infected with Echinococcus multilocularis. E) Neutrophils aggerated at the AE lesion mostly had a multi‐lobular nucleus. F) Neutrophils dispersed diffusely in the infected liver mostly had a ring‐form nucleus. G) Heatmap showing the expression levels of representative genes associated with multiple biological functions for Mpohi Neu and Il1b hi Neu, standardized by Z‐score. H) Heatmap showing the GSVA scores for pathogen‐killing pathways of Mpohi Neu and Il1b hi Neu based on Stereo‐seq data. I) Spatial expression pattern of Casp4, a gene related to NETosis, in Samples D4_2 (left) and D8_1 (right). J) Heatmap showing the GSVA scores for aging and cell death pathways of Mpohi Neu and Il1b hi Neu based on Stereo‐seq data. K) UMAP of three neutrophil subpopulations identified from the scRNA‐seq data of mouse liver tissues. L) Volcano plot showing the differentially expressed genes between Mpohi Neu and Il1b hi Neu. Red and blue dots indicate genes significantly upregulated and downregulated in Il1b hi Neu. M) GO enrichment of genes differentially expressed between the three neutrophil subpopulations. N) Violin plot showing the gene signature scores of the immune suppression pathway for the three neutrophil subpopulations identified from scRNA‐seq data. ****p < 0.0001, determined by unpaired Student's t test. O) Differentially expressed regulatory genes of the three neutrophil subgroups identified from scRNA‐seq data.
Figure 4
Figure 4
Neutrophil‐associated cell‐cell interactions in the AE lesions. A) Bubble plot showing the top ligand‐receptor pairs between neutrophils, hepatocytes, Spp1+ MoMFs, and fibroblasts identified by CellChat based on the Stereo‐seq data of D4_2. B) Dotplot showing the expression levels of genes shown in (A) based on cells identified from 14 Stereo‐seq chips. C) Bubble plot showing the significant ligand‐receptor pairs shown in (A) between Il1b hi Neu and the other cell types (including Mpo hi Neu, Spp1+ MoMFs, hepatocytes, and fibroblasts) in the DL and PL groups of the scRNA‐seq data. D) Dotplot showing the expression levels of genes shown in (C) based on cells identified from the scRNA‐seq data. E) Violin plot showing the gene signature scores of engulfment of apoptotic cells for different cell types identified in 14 Stereo‐seq chips. F) Distribution of Il1b hi Neu (yellow dots) and Spp1+ MoMFs (green dots) in Sample D4_2. G) Spatial distribution of Ccl3Ccr1 ligand‐receptor pairs in Sample D4_2. H) Spatial distribution of Icam1 – (Itgam+Itgb2) ligand‐receptor pairs in Sample D4_2.
Figure 5
Figure 5
Characterization and functional analysis of Spp1 + MoMFs. A) Clustering of the macrophage subpopulations identified from the scRNA‐seq data of liver tissues (n = 4) collected from two mice infected by Echinococcus multilocularis for 15 months. B) Expression of marker genes in macrophage subpopulations. C) Gene signature scores of M1 phenotype, M2 phenotype, phagocytosis, and angiogenesis pathways for the four macrophage subpopulations. Data are displayed as violin plots. ****p < 0.0001, determined by unpaired Student's t test. D) Distribution of the four macrophage subpopulations in the DL and PL regions. E) Stereo‐seq chips and H&E staining images showing the spatial distribution of Spp1+ MoMFs in Samples D4_2 and D79_1. Black arrows indicate PSCs. Blue arrows indicate the germinal layer inside the microcyte of Echinococcus multilocularis. White arrows indicate Spp1+ MoMFs surrounding the PSC or microcyst. Gene signature scores of F) M1 phenotype, G) M2 phenotype, H) antigen processing and presentation, I) phagocytosis, and J) angiogenesis pathways for Spp1+ MoMFs identified in Stereo‐seq samples collected at 4, 8, 15, 37, and 79 dpi. K) Differentially expressed regulatory genes of the macrophage subpopulations identified from scRNA‐seq data.
Figure 6
Figure 6
Cell–cell interactions between Spp1 + MoMFs and fibroblasts. A) Spatial distribution patterns and the Pearson correlation analysis of Spp1+ MoMFs (x axis) and fibroblasts (y axis) signature scores indicated colocalization of the two cell types. B) Cell–cell communication strength estimated by Cellchat. Spp1+ MoMFs and fibroblasts showed higher interaction intensities in the PL group (right) than in the DL group (left). C) Regulation network of three active ligands expressed by Spp1 + MoMFs (Tgfb1, Spp1, and Mmp14). The analysis was carried out with NicheNet using scRNA‐seq data. D) Spatial presentation of the signature scores for selected ligands on Spp1 + MoMFs (upper) and the associated targets on fibroblasts (bottom) in sample D8_2. E) Relative expression of 20 ligands on Spp1 + MoMFs and 20 associated targets on fibroblasts in spatial clusters in Sample D8_2. F) Violin plots showing the proliferation scores of fibroblasts in DL and PL groups of scRNA‐seq (left) and in Stereo‐seq samples collected at different timepoints (right). ****p < 0.0001, determined by unpaired Student's t test. G) Spatial presentation of the signature scores for cell proliferation (left) and fibroblast marker gene set (right) in sample D4_2. H) The Pearson correlation analysis of cell proliferation and the fibroblasts signature scores indicated the proliferation of fibroblasts in Sample D4_2. I) Dotplots showing the expression of genes associated with the PDGF signaling pathway in Stereo‐seq (left) and scRNA‐seq data (right).
Figure 7
Figure 7
Schematic graph showing the functional involvements of neutrophils, macrophages, and fibroblasts during AE progression. During the early infection stage, i.e., Echinococcus multilocularis in the form of protoscoleces (PSCs) or newly formed microcysts, the host immune cells are recruited to the infected foci to kill the parasites actively (“active killing''). Specifically, the Spp1 + MoMFs attach to and phagocytize the PSCs. Meanwhile, the injured hepatocytes recruit a large amount of Il1b hi Neu that highly express pattern‐recognition receptor (PRR) to the lesion site, which recognize and clear the parasite through pathways such as NETosis. During this process, more neutrophils and Spp1 + MoMFs are recruited to the lesion by cytokines released by Il1b hi Neu. The Spp1 + MoMFs also help engulf the apoptotic Il1b hi Neu. Meanwhile, the interactions between Il1b hi Neu and fibroblasts may facilitate fibrosis and angiogenesis. When the infection sustains, the immunosuppressive signals expressed by Il1b hi Neu and Spp1 + MoMFs may trigger the conversion to a “negative segregation” strategy. At this stage, the microcytes are large and their invasive growth may endanger the nearby tissues. Continuous accumulation of neutrophils and Spp1 + MoMFs can still be observed in the infected tissues. While Spp1 + MoMFs can attach to the outer surface of the microcysts, Il1b hi Neu fail to migrate into the lesion to kill the metacestodes. Although Spp1 + MoMFs may function to engulf parasitic components, their interactions with fibroblasts may enhance the proliferation of fibroblasts, extracellular matrix (ECM) remodeling, and angiogenesis. The fibrotic structure surrounding the microcytes may constrain the growth of Echinococcus multilocularis and prevent the spread of metacestodes into nearby tissues, but this fibrotic barrier may also hinder the infiltration of immune cells such as neutrophils into the lesion center to eliminate the parasite. Therefore, this process is termed as “negative segregation”.

References

    1. Casulli A., PLoS Neglected Trop. Dis. 2021, 15, e0009373. - PMC - PubMed
    1. Siegert S., Neumann S., J. Helminthol. 2022, 96, e45. - PubMed
    1. Deplazes P., Rinaldi L., Alvarez Rojas C. A., Torgerson P. R., Harandi M. F., Romig T., Antolova D., Schurer J. M., Lahmar S., Cringoli G., Magambo J., Thompson R. C., Jenkins E. J., Adv. Parasitol. 2017, 95, 315. - PubMed
    1. Moro P., Schantz P. M., Int. J. Infect. Dis. 2009, 13, 125. - PubMed
    1. Eckert J., Thompson R. C., Adv. Parasitol. 2017, 95, 1. - PubMed

Supplementary concepts

LinkOut - more resources