. 2025 Apr;12(15):e2406786.
doi: 10.1002/advs.202406786. Epub 2025 Feb 22.

UFMylation of NLRP3 Prevents Its Autophagic Degradation and Facilitates Inflammasome Activation

Affiliations

UFMylation of NLRP3 Prevents Its Autophagic Degradation and Facilitates Inflammasome Activation

Jiongjie Jing et al. Adv Sci (Weinh). 2025 Apr.

Abstract

NLRP3 (NOD, LRR and pyrin domain-containing protein 3) inflammasome is important for host defense against infections and maintaining homeostasis. Aberrant activation of NLRP3 inflammasome is closely related to various inflammatory diseases. Post-translational modifications are critical for NLRP3 inflammasome regulation. However, the mechanism of NLRP3 inflammasome activation remains incompletely understood. Here, it is demonstrated that the Ufm1 E3 ligase Ufl1 mediated UFMylation is essential for NLRP3 inflammasome activation. Mechanistically, Ufl1 binds and UFMylates NLRP3 in the priming stage of NLRP3 activation, thereby sustaining the stability of NLRP3 by preventing NLRP3 K63-linked ubiquitination and the subsequent autophagic degradation. It is further demonstrated that myeloid cell-specific Ufl1 or Ufm1 deficiency in mice significantly alleviated inflammatory responses and tissue damage following lipopolysaccharide (LPS)-induced endotoxemia and alum-induced peritonitis. Thus, the findings offer new insights into potential therapeutic targets for NLRP3 inflammasome-related diseases by targeting the UFMylation system.

Keywords: NLRP3 inflammasome; UFMylation; autophagic degradation; therapeutic target.


Conflict of interest statement

The authors declare no conflict of interest.

Figures

Figure 1
Figure 1
Core components in UFMylation cascade are down‐regulated upon NLRP3 inflammasome activation. A–C) Immunoblot analysis of NLRP3, Ufl1, and Ufm1 in the whole cell lysis of LPS‐stimulated (200 ng mL−1, 4 h) or LPS‐primed (200 ng mL−1, 4 h) and nigericin‐activated (10 µm, 1 h) iBMDMs A), BMDMs B), and THP1 C). D) Immunoblot analysis of p‐p65, p65, p‐IκBα, IκBα, p‐ERK, ERK, p‐JNK, and JNK in the whole cell lysis of LPS‐stimulated iBMDMs transfected with scramble sequence (si‐NC) or specific sequences targeting Ufl1 (si‐Ufl1). E) Immunoblot analysis of p‐p65, p65, p‐IκBα, IκBα, p‐ERK, ERK, p‐JNK, and JNK in the whole cell lysis of LPS‐stimulated WT and Ufl1‐KO BMDMs. Data are representative of three independent experiments.
Figure 2
Figure 2
Ufl1 deficiency inhibits the activation of NLRP3 inflammasome. A) Immunoblot analysis of proteins in supernatants (SN) and whole cell lysates (WCL) of LPS‐stimulated, LPS‐primed and nigericin‐activated iBMDMs transfected with si‐NC or si‐Ufl1. B) Immunoblot analysis of proteins in SN and WCL of LPS‐stimulated, LPS‐primed, and nigericin‐activated WT and Ufl1‐KO BMDMs. C–E) IL‐1β C), TNF‐α D) production and LDH release E) in SN of LPS‐primed and nigericin‐activated WT and Ufl1‐KO BMDMs. F) Immunoblot analysis of proteins in SN and WCL of LPS‐stimulated, LPS‐primed, and ATP‐activated (2 mm, 45 min) WT and Ufl1‐KO BMDMs. G–I) IL‐1β G), TNF‐α H) production, and LDH release I) in SN of LPS‐primed and ATP‐activated WT and Ufl1‐KO BMDMs. J) Immunoblot analysis of ASC oligomerization in pellets and WCL of LPS‐primed and nigericin‐activated WT and Ufl1‐KO BMDMs. K) Representative images of immunofluorescence analysis on LPS‐primed and nigericin‐activated WT and Ufl1‐KO BMDMs. Scale bar, 10 and 5 µm (magnification). L) Bar graph represents the percentage of cells exhibiting ASC speck (the percentage of ASC specks were counted in 5 different areas for each group). Data are representative of three independent experiments (A, B, F, J, and K). Data are shown as mean ± SD (C, D, E, G, H, I, and L). NS, no significance; *, P < 0.05; **, P < 0.01; ***, P < 0.001. P values were determined by unpaired two‐tailed Student's t‐test.
Figure 3
Figure 3
Ufl1 interacts with NLRP3 for inflammasome activation. A) Immunoblot analysis of lysates from HEK293T cells transfected with Flag vector or Flag‐tagged Nlrp3, and followed by immunoprecipitation (IP) with Flag beads. B,C) Immunoblot analysis of the association between NLRP3 and Ufl1 in HEK293T cells transfected with Flag‐tagged NLRP3 and V5‐tagged Ufl1, followed by IP with Flag beads B) and V5 antibody C). D) Representative images of immunofluorescence analysis of the association between C‐terminal GFP‐tagged NLRP3 (NLRP3‐GFP) (green) and 3 × Flag‐Ufl1 (red) in HEK293T cells. Scale bar, 30 and 10 µm (magnification). E) Immunoblot analysis of the endogenous association between NLRP3 and Ufl1 in LPS‐stimulated (1 µg mL−1, 3 h), LPS‐primed and ATP‐activated (2 mm, 30 min) THP1 cells, followed by IP with Ufl1 antibody. F) Immunoblotting of GST pull‐down products from cell lysates of HEK293T transfected with Flag‐tagged NLRP3 (WCL of NLRP3‐OE) with the anti‐Flag antibody, and cell lysates of LPS‐stimulated PM (WCL of Mac) with the anti‐NLRP3 antibody (Top). Coomassie blue staining of the GST proteins (Bottom). Data are representative of three independent experiments.
Figure 4
Figure 4
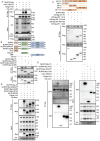
NLRP3 is a new substrate of UFMylation. A) IP analysis of NLRP3 UFMylation in HEK293T cells transfected with the indicated plasmids. B) Schematic diagram of NLRP3 and its truncation mutants (top), IP analysis of the interaction between NLRP3 or NLRP3 mutants and Ufl1 in HEK293T cells transfected with the indicated plasmids (bottom). C) Schematic diagram of Ufl1 and its truncation mutants (top); IP analysis of the association between NLRP3 and Ufl1 or Ufl1 mutants in HEK293T cells transfected with the indicated plasmids (bottom). D) IP analysis of UFMylation of NLRP3 mutants in HEK293T cells transfected with the indicated plasmids. E) IP analysis of UFMylation of NLRP3 mutants in HEK293T cells transfected with the indicated plasmids. The arrow indicates the specific band for UFMylation. Data are representative of three independent experiments. FL, full length.
Figure 5
Figure 5
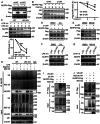
Ufl1‐mediated NLRP3 UFMylation suppresses its autophagy‐mediated degradation. A) Immunoblot analysis of HEK293T cells transfected with si‐NC or specific sequences targeting human UFL1 (si‐UFL1), and NLRP3‐Flag plasmid. B) Immunoblot analysis of lysates from HEK293T cells transfected with si‐NC or si‐UFL1, and NLRP3‐Flag plasmid, then treated with cycloheximide (CHX) (100 ng mL−1) for indicated time periods (left). NLRP3 expression was quantitated by measuring band intensities using ImageJ software (right). C) Immunoblot analysis of NLRP3 expression in WT and Ufl1‐KO BMDMs, following stimulation with LPS and then treated with CHX for indicated time periods (top). NLRP3 expression was quantitated by measuring band intensities using ImageJ software (bottom). D,E) Immunoblot analysis of NLRP3 expression in HEK293T cells transfected with si‐NC or si‐UFL1, and NLRP3‐Flag plasmid, following treatment of DMSO, CQ (50 µm) D) or MG132 (10 µm) E) for 8 h. F,G) Immunoblot analysis of NLRP3 expression in WT and Ufl1‐KO BMDMs treated with LPS for 4 h, following treatment of DMSO, CQ (50 µm) F) or MG132 (20 µm) G) for 6 h. H) Immunoblot analysis of ubiquitin and K63‐ubiquitin of lysates from WT and Ufl1‐KO PMs primed with LPS for 4 h, together with MG132 (10 µm) treatment for 3 h, and then stimulation with nigericin for 1 h, and followed by IP with NLRP3 antibody. I,J) Immunoblot analysis of lysates from HEK293T cells transfected with Ub‐HA I), or HA‐tagged K63‐linked ubiquitin J), NLRP3‐Flag, and V5‐Ufl1, following treatment with MG132 (10 µm) for 8 h and IP with Flag antibody. Data are representative of three independent experiments. Data are shown as mean ± SD (B, right panel; C, bottom panel). *, P < 0.05; **, P < 0.01; ***, P < 0.001. P values were determined by unpaired two‐tailed Student's t‐test.
Figure 6
Figure 6
Ufl1 deficiency alleviates NLRP3 inflammasome activation in vivo. A–D) WT or Ufl1‐cKO mice (n = 3 per group) were intraperitoneally (i.p.) injected with lipopolysaccharide (LPS, 15 mg kg−1, 8 h). IL‐1β A) and TNF‐α B) release in serum was determined by ELISA. Immunoblot analysis of lysates from bronchoalveolar lavage fluids (BALFs) from WT or Ufl1‐cKO mice C). Representative images of H&E staining of lung tissues of WT and Ufl1‐cKO mice. Scale bar, 100 µm D). E–G) WT or Ufl1‐cKO mice (n = 3 per group) were i.p. injected with Alum (700 µg) for 12 h. Immunoblot analysis of lysates from peritoneal exudate cells (PECs) of WT or Ufl1‐cKO mice E). Flow cytometry analysis of CD11b+Ly6G+ neutrophils recruitment in blood from WT or Ufl1‐cKO mice F). Representative images of H&E staining of lung from WT and Ufl1‐cKO mice. Scale bar, 200 µm G). H) Graphic abstract showing the UFMylation of NLRP3 mediated by Ufl1, which maintains NLRP3 levels by suppressing autophagy‐mediated degradation, thereby sustaining the activation of NLRP3 inflammasome. Data are representative of three independent experiments D,G). Data are shown as mean ± SD A–G). NS: no significance; *, P < 0.05; **, P < 0.01. P values were determined by unpaired two‐tailed Student's t‐test.

References

    1. Broz P., Dixit V. M., Nat. Rev. Immunol. 2016, 16, 407. - PubMed
    1. Rathinam V. A., Fitzgerald K. A., Cell 2016, 165, 792. - PMC - PubMed
    1. Strowig T., Henao‐Mejia J., Elinav E., Flavell R., Nature 2012, 481, 278. - PubMed
    1. Latz E., Xiao T. S., Stutz A., Nat. Rev. Immunol. 2013, 13, 397. - PMC - PubMed
    1. Swanson K. V., Deng M., Ting J. P., Nat. Rev. Immunol. 2019, 19, 477. - PMC - PubMed

Substances

LinkOut - more resources