. 2025 Apr;12(15):e2411490.
doi: 10.1002/advs.202411490. Epub 2025 Feb 22.

Multimodal Artificial Intelligence-Based Virtual Biopsy for Diagnosing Abdominal Lavage Cytology-Positive Gastric Cancer

Affiliations

Multimodal Artificial Intelligence-Based Virtual Biopsy for Diagnosing Abdominal Lavage Cytology-Positive Gastric Cancer

Ping'an Ding et al. Adv Sci (Weinh). 2025 Apr.

Abstract

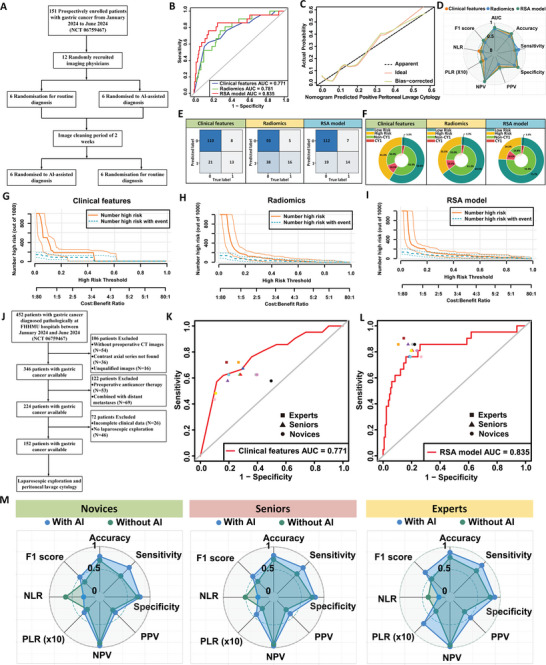
Gastric cancer with peritoneal dissemination remains a significant clinical challenge due to its poor prognosis and difficulty in early detection. This study introduces a multimodal artificial intelligence-based risk stratification assessment (RSA) model, integrating radiomic and clinical data to predict peritoneal lavage cytology-positive (GC-CY1) in gastric cancer patients. The RSA model is trained and validated across retrospective, external, and prospective cohorts. In the training cohort, the RSA model achieved an area under the curve (AUC) of 0.866, outperforming traditional clinical and radiomic feature models. External validation cohorts confirmed its robustness, with AUC values of 0.883 and 0.823 for predicting peritoneal metastasis and recurrence, respectively. In a prospective validation involving 152 patients, the model maintained superior predictive performance (AUC = 0.835). The RSA model also demonstrated significant clinical benefits by effectively identifying high-risk patients likely to benefit from specific treatments, such as paclitaxel-based conversion therapy. These findings suggest that the RSA model offers a reliable, non-invasive diagnostic tool for gastric cancer, capable of improving early detection and treatment outcomes. Further prospective studies are warranted to explore its full clinical potential.

Keywords: gastric cancer; multimodal artificial intelligence; peritoneal lavage cytology‐positive (CY1); radiomics; virtual biopsy.


Conflict of interest statement

The authors declare no conflict of interest.

Figures

Figure 1
Figure 1
Study design flow chart. This study involved 2334 eligible patients with LAGC from six medical centers in China, all of whom underwent abdominal CT imaging before treatment. A,B) Radiology workflow: The process included manual segmentation after image acquisition, feature extraction, and the establishment of radiomic features, followed by the development and validation of the RSA model to predict CY1‐positivity. The model's performance was then evaluated. C) Prediction of conversion therapy efficacy: A retrospective analysis of two cohorts of GC‐CY1 patients who previously underwent conversion therapy was conducted to explore the relationship between the RSA model and treatment efficacy. D) Prediction of peritoneal metastasis and recurrence: An extended analysis of the study cohort was carried out to predict peritoneal metastasis in newly diagnosed gastric cancer patients and peritoneal recurrence after radical surgery using the RSA model. E) Prospective validation: A total of 152 patients with LAGC were prospectively enrolled to validate the RSA model's predictive performance for CY1‐positivity (NCT 06759467). F) Bioinformatics workflow: RNA sequencing was performed on 12 tissue samples from the prospective cohort. Bioinformatics analysis was conducted to investigate the biological characteristics and immune infiltration features of GC‐CY1 patients, providing insights into intratumor heterogeneity.
Figure 2
Figure 2
Training and Internal Validation of the RSA Model for Predicting GC‐CY1. A) Development of a nomogram incorporating radiomic features and clinical characteristics to predict GC‐CY1. B) ROC curves of various prediction models in the training set. C) Calibration curves of the RSA model in the training set. D) Radar plots illustrating performance indicators for different prediction models in the training set. E) Confusion matrices for the different prediction models in the training set. F) Double‐layer concentric circle plots demonstrating the clinical benefits of various prediction models in the training set. G) Log‐rank test survival curves for patients in the training set, stratified into low‐ and high‐risk groups based on the Youden index threshold derived from the nomogram. H) Box plots of AUC, sensitivity, specificity, and accuracy analyses for different prediction models after tenfold cross‐validation. I) Comparison of AUC values among different prediction models in a stratified analysis based on peripheral blood tumor markers and HER2 and PDL1 expression in biopsy tissues. J) Specificity comparison among different prediction models in a stratified analysis based on the expression status of HER2 and PDL1 in peripheral blood tumor markers and biopsy tissues. K) Sensitivity comparison among different prediction models in a stratified analysis based on the expression status of HER2 and PDL1 in peripheral blood tumor markers and biopsy tissues. L) Relationship between high‐ and low‐risk groupings of different prediction models and cachexia in GC‐CY1 patients. M) Relationship between high‐ and low‐risk groupings of different prediction models and conversion therapy efficacy in GC‐CY1 patients. N) Relationship between high‐ and low‐risk groupings of different prediction models and postoperative pathological regression grade after conversion therapy in GC‐CY1 patients.
Figure 3
Figure 3
External validation of the RSA model for predicting GC‐CY1. A,B) ROC curves for different prediction models in two external validation sets. C,D) Calibration curves of the RSA model in two external validation sets. E) Confusion matrices for different prediction models in the two external validation sets. F,G) Radar plots displaying performance indicators for different prediction models in the two external validation sets. H) Double‐layer concentric circle plots illustrating the clinical advantages of various prediction models in the two external validation sets. I,J) Log‐rank test survival curves for patients in external validation set I, stratified into low‐ and high‐risk groups based on the Youden index threshold derived from the nomogram. K) Comparison of the relationship between high‐ and low‐risk groups from different prediction models in external validation set I and cachexia in GC‐CY1 patients. L,M) Log‐rank test survival curves for patients in external validation set II, stratified into low‐ and high‐risk groups according to the Youden index threshold derived from the nomogram. N) Comparison of the relationship between high‐ and low‐risk groups from different prediction models in external validation set II and cachexia in GC‐CY1 patients. O) Comparison of the relationship between high‐ and low‐risk groups from different prediction models in external validation set I and conversion therapy efficacy in GC‐CY1 patients. P) Comparison of the relationship between high‐ and low‐risk groups from different prediction models in external validation set I and postoperative pathological regression grade after conversion therapy in GC‐CY1 patients. Q) Analysis of the relationship between high‐ and low‐risk groups from different prediction models in external validation set II and conversion therapy efficacy in GC‐CY1 patients. R) Analysis of the relationship between high‐ and low‐risk groups from different prediction models in external validation set II and postoperative pathological regression grade after conversion therapy in GC‐CY1 patients. S,T) Retrospective analysis of two prospective cohorts of GC‐CY1 patients undergoing conversion therapy (ChiCTR1800014817, NCT03718624) to investigate the relationship between the RSA model and treatment efficacy.
Figure 4
Figure 4
Extended validation of the RSA model for predicting peritoneal metastasis and recurrence. A) Standard peritoneal biopsy procedure and HE staining results used for diagnosing peritoneal metastasis in newly diagnosed gastric cancer patients undergoing laparoscopic exploration. B) Typical PET‐CT images showing peritoneal recurrence during follow‐up of patients after radical surgery for gastric cancer. C) ROC curves for different prediction models in the peritoneal metastasis validation set. D) ROC curves for different prediction models in the peritoneal recurrence validation set. E) Confusion matrices for various prediction models in both the peritoneal metastasis and peritoneal recurrence validation sets. F) Double‐layer concentric circle plots illustrating the clinical advantages of different prediction models in the peritoneal metastasis and recurrence validation sets. G,H) Radar plots showing the performance indicators of different prediction models in the peritoneal metastasis and recurrence validation sets. I) Calibration curve of the RSA model in the peritoneal metastasis validation set. J) Calibration curve of the RSA model in the peritoneal recurrence validation set. K,L) Log‐rank test survival curves of patients with peritoneal metastasis in the validation set, categorized into low‐risk and high‐risk groups based on the Youden index thresholds derived from the nomogram. M,N) Log‐rank test survival curves of patients with peritoneal recurrence in the validation set, categorized into low‐risk and high‐risk groups according to the Youden index thresholds derived from the nomogram.
Figure 5
Figure 5
Prospective Validation of the RSA Model for Predicting GC‐CY1. A) Flowchart outlining the inclusion and exclusion criteria for patients in the prospective study. B) ROC curves for different prediction models in the prospective validation set. C) Calibration curves for the RSA model in the prospective validation set. D) Radar charts displaying the performance indicators of various prediction models in the prospective validation set. E) Confusion matrices for different prediction models in the prospective validation set. F) Double‐layer concentric circle charts demonstrating the clinical advantages of different prediction models in the prospective validation set. G–I) Comparison of clinical impact curves (CIC) for different models in the prospective validation set. J) Flowchart of the RSA model validation for clinical application by radiologists of varying experience levels. K) Comparison of the diagnostic performance of the clinical feature model among radiologists with different experience levels. L) Comparison of the diagnostic performance of the RSA model among radiologists with different experience levels. M) Comparison of radiologists' diagnostic performance with and without the assistance of the RSA model.
Figure 6
Figure 6
Biological characteristics and immune infiltration in high‐risk and low‐risk groups. A) Using appropriate transcriptome data from the TCGA database, GEO database, and Venn diagrams of mRNA sequencing of 6 high‐risk patients and 6 low‐risk patients, 6 candidate mRNAs were found. B) Heatmap shows the expression of 6 candidate mRNAs in high‐risk and low‐risk patients. C) Gene set variation analysis (GSVA) enrichment analysis shows pathways enriched in high‐risk and low‐risk groups. D,E) Gene set enrichment analysis (GSEA) signature pathways of IFNγ (D) and TNFα (E) were found to be statistically enriched in low‐risk features (p < 0.05). F–I) Violin plots show the differences in tumor purity (F), immune score (G), ESTIMATE score (H), and stromal score (I) between high‐risk and low‐risk groups. J) By using the cell‐type Identification by Estimating Relative Subsets of RNA Transcripts (CIBERSORT) algorithm, the scores of combined cell types show the proportional diversity between features. K‐M) Heatmaps (K) and violin plots (L,M) show the expression and differences of immune checkpoint genes in high‐risk and low‐risk patients. N) The relative abundance of each immune cell in tumor tissue was calculated by microenvironment cell populations‐counter (MCPcounter) algorithm and displayed as a heat map. O,P) t‐SNE diagram of cell type (O) and metastasis type (P) from single cell data of gastric cancer patients. Q) EdU experiment to detect DNA replication activity of AGS cells after silencing NOX1. R) Scratch healing assay to detect migration ability of AGS cells after silencing NOX1. S) Transwell assay to detect migration and invasion ability of AGS cells after silencing NOX1.

References

    1. Bray F., Laversanne M., Sung H., Ferlay J., Siegel R. L., Soerjomataram I., Jemal A., CA Cancer J. Clin. 2024, 74, 229. - PubMed
    1. González‐Moreno S., Ann. Surg. Oncol. 2009, 16, 3217. - PMC - PubMed
    1. Yoshida K., Yamaguchi K., Okumura N., Tanahashi T., Kodera Y., Gastric Cancer 2016, 19, 329. - PMC - PubMed
    1. Yamaguchi T., Takashima A., Nagashima K., Terashima M., Aizawa M., Ohashi M., Tanaka R., Yamada T., Kinoshita T., Matsushita H., Ishiyama K., Hosoda K., Yuasa Y., Haruta S., Kakihara N., Nishikawa K., Yunome G., Satoh T., Fukagawa T., Katai H., Boku N., Gastric Cancer 2021, 24, 701. - PubMed
    1. Yamaguchi T., Takashima A., Nagashima K., Makuuchi R., Aizawa M., Ohashi M., Tashiro K., Yamada T., Kinoshita T., Hata H., Kawachi Y., Kawabata R., Tsuji T., Hihara J., Sakamoto T., Fukagawa T., Katai H., Higuchi K., Boku N., Ann. Surg. Oncol. 2020, 27, 284. - PubMed

LinkOut - more resources