. 2025 Apr;26(4):e70029.
doi: 10.1002/acm2.70029. Epub 2025 Feb 22.

Quantitative beam optimization for radiotherapy of peripheral lung lesions: A pilot study in stereotactic body radiotherapy

Affiliations

Quantitative beam optimization for radiotherapy of peripheral lung lesions: A pilot study in stereotactic body radiotherapy

Hamed Hooshangnejad et al. J Appl Clin Med Phys. 2025 Apr.

Abstract

Background: To quantify beam optimization for stereotactic body radiotherapy (SBRT) of peripheral lung lesions.

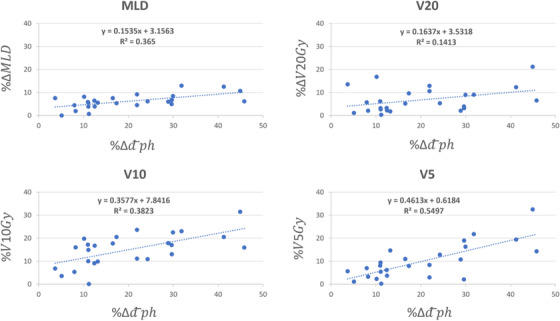
Method: The new beam optimization approach was based on maximizing the therapeutic gain (TG) of the beam set by minimizing the average physical depth of the lesion with respect to the beam's eye view (BEV). The new approach was evaluated by replanning the 25 SBRT lesions retrospectively to assess if a better plan is achievable in all aspects. Difference in 25 Gy isodose line volume (IDLV25 Gy), IDLV20 Gy, IDLV15 Gy, IDLV10 Gy, and IDLV5 Gy between the two plan cohorts were calculated as a measure of plan size and fitted in a linear regression model against the changes in the lesion depth with respect to the BEV to assess the relationship between the changes in the treatment depth and that of the plan size.

Results: Beam optimization achieved a better plan in all cases by lowering the depth of treatment with an average of % 20.03 ± 12.30 (3.66%-45.78%). As the depth of treatment decreases, the size of the plan also decreases. We observed a reduction of % 4.64 ± 4.55 (0.02%-21.58%, p < 3.8 × 10⁻⁵), %5.16 ± 5.54 (0.03%-24.68%, p < 0.005), %6.46 ± 6.95 (-1.35%-29.05%, p < 0.009), %12.83 ± 9.06 (0.89%-37.65%, p < 0.0001), and %14.01 ± 9.87 (1.43%-41.84%, p < 4.5 × 10⁻⁶) in IDLV25 Gy, IDLV20 Gy, IDLV15 Gy, IDLV10 Gy, and IDLV5 Gy, respectively.

Conclusion: Physical depth of the lesion with respect to the BEV is inversely proportional to the TG of a beam-set and can be used as a robust and standard metric to select an appropriate beam-set for SBRT of the peripheral lung lesions. Further evaluation warrants the utility of such concept in routine clinical use.

Keywords: SBRT; beam optimization; integral dose; therapeutic gain.


Conflict of interest statement

The authors declare no conflicts of interest.

Figures

FIGURE 1
FIGURE 1
TG for a beam angle is inversely proportional to the physical depth of a lesion to the bean entry at the patient surface. (a) Various beam angles with their corresponding physical and water equivalent depths; b0 and b180 have the highest and lowest TG among these three beams. Although b130 has higher water equivalent depth compared to b180, it has higher TG than b180 as it treats less lung tissue before the beam reaches the target. (b) and (c) To determine the best arc arrangement, the plot of physical depth versus beam angle for the lesion is estimated by placing 72 evenly‐spaced beams around the lesion. The distance of the lesion center to the patient surface indicates the physical depth at that angle. The optimal arc set to treat the lesion is the 180 arc‐set with the lowest area under the curve which will be a set of 295–115 partial arcs for this case. TG, therapeutic gain.
FIGURE 2
FIGURE 2
The dose distribution between the initial and plan with beam optimization. The physical depth of the lesion with respect to beam's eye view was decreased from 9.37 to 6.39 in the new plan. In the initial plan, IDLV25Gy = 52.21 cc, IDLV20Gy = 87.34 cc, IDLV15Gy = 166.55 cc, IDLV10Gy = 395.53 cc, and IDLV5Gy = 943.09 cc; In the new plan IDLV25Gy = 48.6 cc, IDLV20Gy = 78.33 cc, IDLV15Gy = 138.13 cc, IDLV10Gy = 268.89 cc, IDLV5Gy = 677.83 cc. The initial plan was done with a beam set of 340–179 (cw, ccw) and the new plan was done with a beam set of 295–115 (cw, ccw). cw: clockwise; ccw: counter clockwise;IDLV, isodose line volume.
FIGURE 3
FIGURE 3
The DVH between the two plans shown in Figure 2. To better illustrate different rates of dose reduction as a function of distance from the target in the two plans, the DVH of inter‐connected rings with diameters of 5 mm, 1 , 2, and 3 cm are also shown. Ring0.5 mm encompasses the target while Ring1 cm encompasses Ring0.5 cm and so on. The numeric value of different dosimetric indices used for plan comparison of the two plans are also shown in Table 3. DVH, dose volume histograms.
FIGURE 4
FIGURE 4
The scatter plot of %Δd¯ph versus %ΔIDLVx,x=25,20,15,10,and5Gy between the initial and new plans for all 25 lesions in this study. As shown, as the difference between the physical depth of the lesion with respect to the beam's eye view increases, the difference between the volume of the lower isodose lines also increases. Hence, the beam optimization brings the lesion to a shallower depth leading to decrease the size of different isodose line levels. IDLV, isodose line volume.
FIGURE 5
FIGURE 5
The scatter plot of %Δd¯ph versus %ΔMLD,%ΔV20Gy,%V10Gy,and%V5Gy between the initial and new plans for all 25 lesions in this study. It can be inferred from this figure that as depth of the lesion with respect to the beam's eye view increases, the difference in the MLD, V20 and V10 also increases. MLD, mean lung dose.
FIGURE 6
FIGURE 6
Boxplots of dosimetric indices between the initial and plans with beam optimization (new) for all 25 cases. Statistical comparison between the two plan cohorts is also shown in Table 3.
FIGURE 7
FIGURE 7
Illustration of initial and plan with beam optimization for cases with different changes in lesion depth with respect to BEV. As shown, as changes in the lesion depth between the two plans decreases, the difference between the size of the two plans also decrease. The IDLV5 Gy for each case is as follows: A‐Initial = 1415 cc, A‐WBO = 884 cc, B‐Initial = 1430 cc, B‐WBO = 1208 cc, C‐Initial = 1143 cc, C‐WBO = 1034 cc, D‐Initial = 736 cc, D‐WBO = 726 cc. BEV, beam's eye view; cw: clockwise; ccw: counter clockwise; IDLV, isodose line volume.

References

    1. Siegel RL, Giaquinto AN, Jemal A. Cancer statistics, 2024. CA Cancer J Clin. 2024;74(1):12‐49. doi:10.3322/caac.21820 - DOI - PubMed
    1. Lung Cancer Statistics | How Common is Lung Cancer? Accessed April 26, 2024. https://www.cancer.org/cancer/types/lung‐cancer/about/key‐statistics.html
    1. Lung Cancer—Non‐Small Cell—Statistics. Cancer.Net. June 25, 2012. Accessed April 26, 2024. https://www.cancer.net/cancer‐types/lung‐cancer‐non‐small‐cell/statistics
    1. Vinod SK, Hau E. Radiotherapy treatment for lung cancer: current status and future directions. Respirology. 2020;25(S2):61‐71. doi:10.1111/resp.13870 - DOI - PubMed
    1. Stanic S, Paulus R, Timmerman RD, et al. No clinically significant changes in pulmonary function following stereotactic body radiation therapy for early‐ stage peripheral non‐small cell lung cancer: an analysis of RTOG 0236. Int J Radiat Oncol Biol Phys. 2014;88(5):1092‐1099. doi:10.1016/j.ijrobp.2013.12.050 - DOI - PMC - PubMed

MeSH terms