. 2025 Feb 22;23(1):222.
doi: 10.1186/s12967-025-06243-6.

Integration of single-cell and bulk RNA sequencing to identify a distinct tumor stem cells and construct a novel prognostic signature for evaluating prognosis and immunotherapy in LUAD

Affiliations

Integration of single-cell and bulk RNA sequencing to identify a distinct tumor stem cells and construct a novel prognostic signature for evaluating prognosis and immunotherapy in LUAD

Fengyun Zhao et al. J Transl Med. .

Abstract

Background: Cancer stem cells (CSCs) are crucial for lung adenocarcinoma (LUAD). This study investigates tumor stem cell gene signatures in LUAD using single-cell RNA sequencing (scRNA-seq) and bulk RNA sequencing (RNA-seq), aiming to develop a prognostic tumor stem cell marker signature (TSCMS) model.

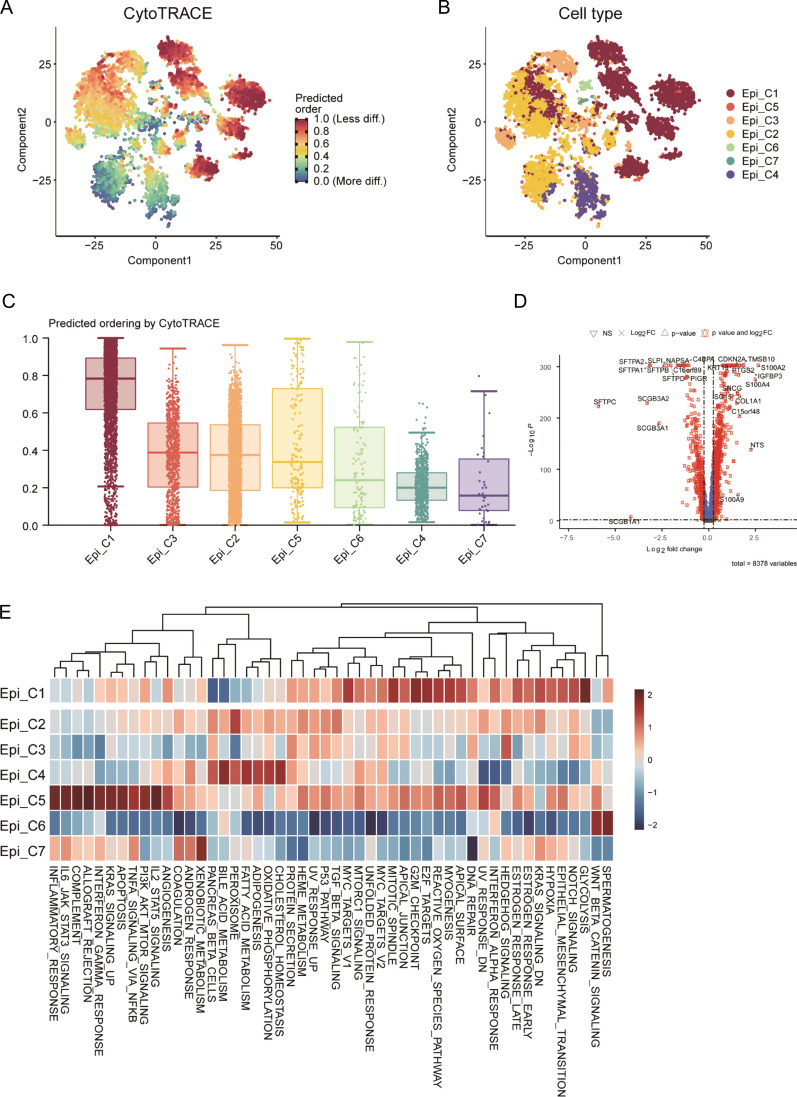
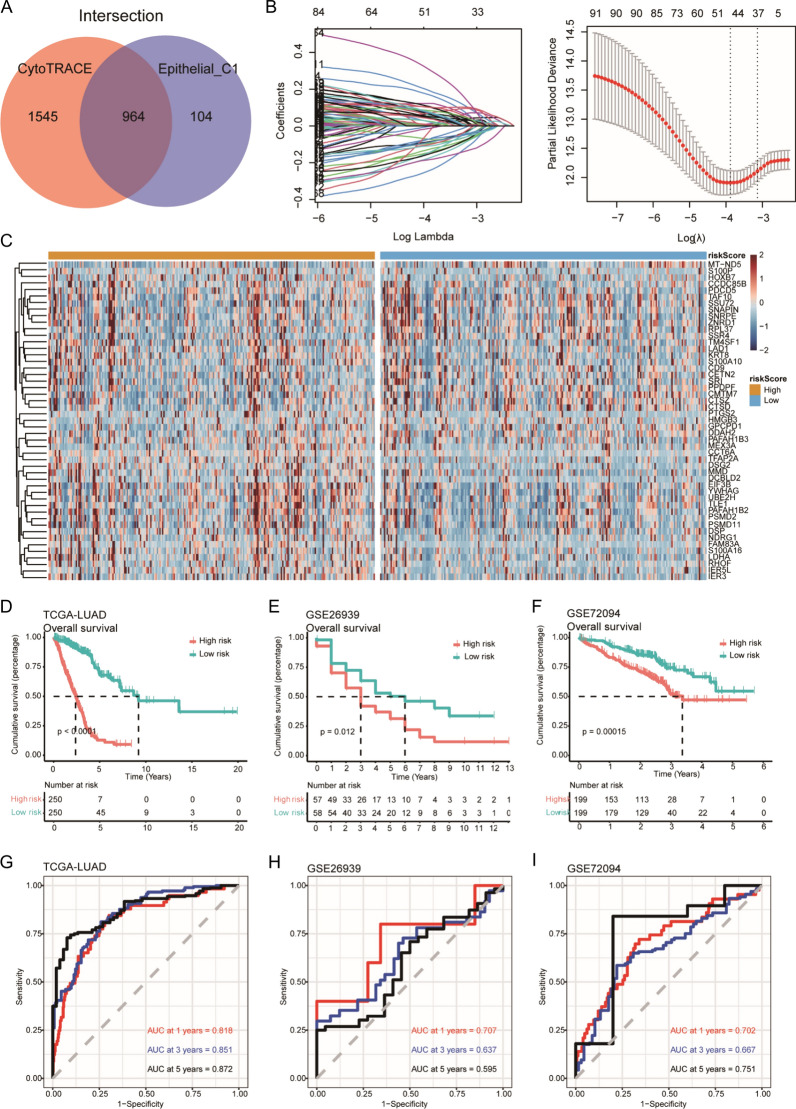
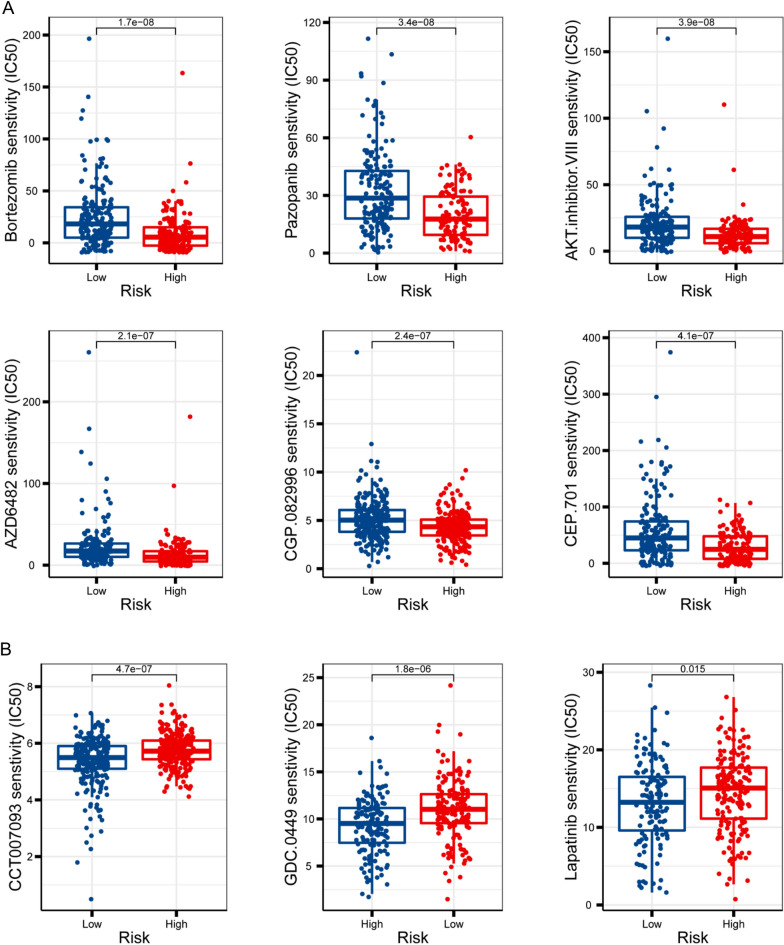
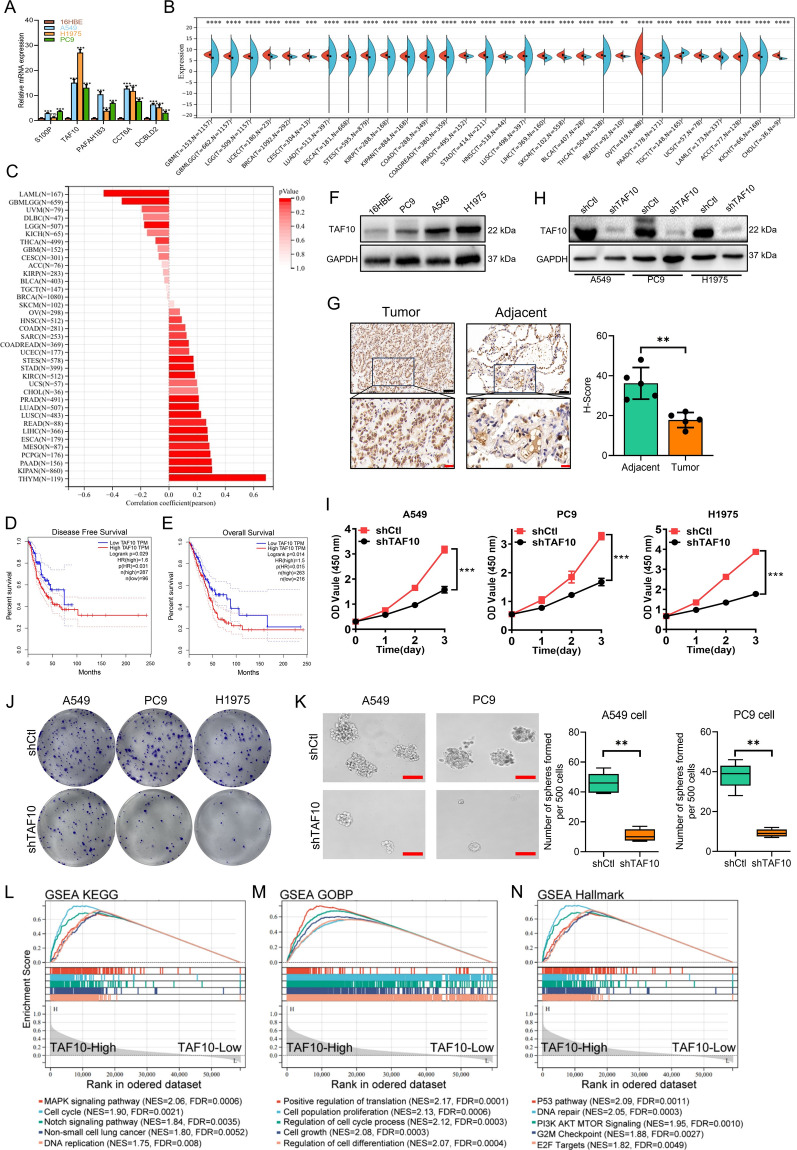
Methods: LUAD scRNA-seq and RNA-seq data were analyzed. CytoTRACE software quantified the stemness score of tumor-derived epithelial cell clusters. Gene Set Variation Analysis (GSVA) identified potential biological functions in different clusters. The TSCMS model was constructed using Lasso-Cox regression, and its prognostic value was assessed through Kaplan-Meier, Cox regression, and receiver-operating characteristic (ROC) curve analyses. Immune infiltration was evaluated using the Cibersortx algorithm, and drug response prediction was performed using the pRRophetic package. TAF10 functional investigations in LUAD cells involved bioinformatics analysis, qRT-PCR, Western blot, immunohistochemistry, and assays for cell proliferation.

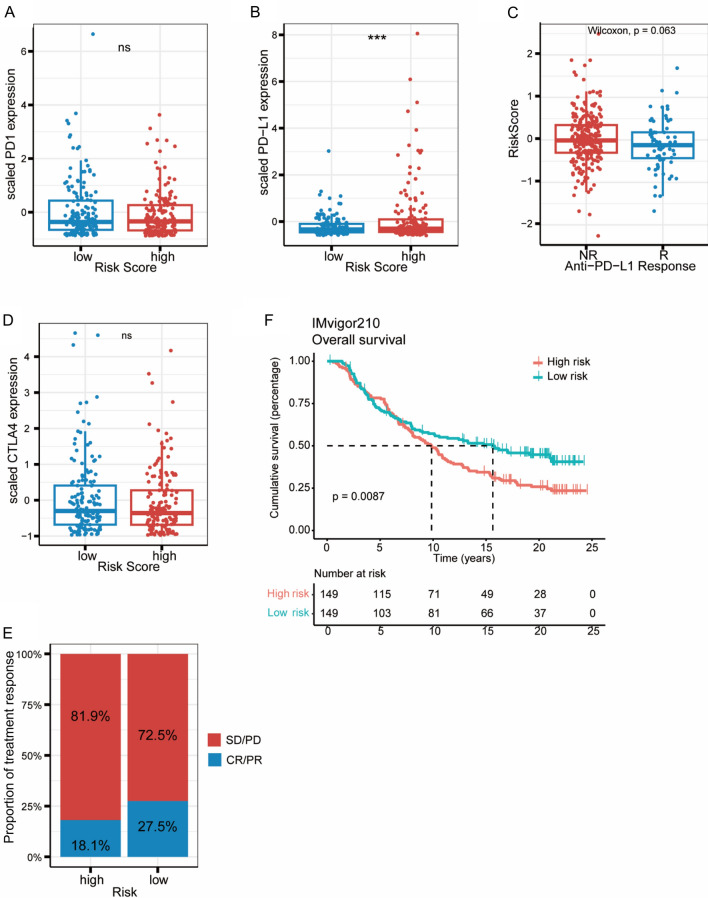
Results: Seven distinct cell clusters were identified by CytoTRACE, with epithelial cell cluster 1 (Epi_C1) showing the highest stemness potential. The TSCMS model included 49 tumor stemness-related genes; high-risk patients exhibited lower immune and ESTIMATE scores and increased tumor purity. Significant differences in immune landscapes and chemotherapy sensitivity were observed between risk groups. TAF10 positively correlated with RNA expression-based stemness scores in various tumors, including LUAD. It was over-expressed in LUAD cell lines and clinical tumor tissues, with high expression linked to poor prognosis. Silencing TAF10 inhibited LUAD cell proliferation and tumor sphere formation.

Conclusions: This study demonstrates the TSCMS model's prognostic value in LUAD, reveals insights into immune infiltration and therapeutic response, and identifies TAF10 as a potential therapeutic target.

Keywords: Gene signature; LUAD; Prognostic model; Single-cell RNA; Tumor stem cell.


Conflict of interest statement

Declarations. Ethics approval and consent to participate: The protocol and all procedures involving human samples in this study were reviewed and approved by the Institutional Review Board (IRB) of Zhongshan City People's Hospital (approval number: 2024–116). Informed patient consent was obtained from all individuals whose paraffin-embedded tissues were used in this study. All research procedures were conducted in compliance with relevant ethical guidelines and local laws. Consent for publication: Not appliable. Competing interests: The authors declare no conflict of interest.

Figures

Fig. 1
Fig. 1
Landscape of cell type in LUAD and normal tissues. A Workflow of this study. B UMAP plot of major nine cell types of LUAD. C UMAP plot of sites. Different cell types and sites are grouped by different colors. D The proportion of different cell types within each sample. E Expression of representative genes for different cell types. Bubble size reflects expression proportion, while the color gradient from blue to red signifies higher expression levels
Fig. 2
Fig. 2
Identification and functional analysis of tumor stem cells. A, B UMAP plot of 7 distinct tumor epithelial cell types with CytoTRACE stemness scores (A) and cell clusters (B). C Tumor stemness scores of 7 epithelial cell clusters using CytoTRACE. D Volcano plot of differentially expressed genes in Epi_C1. E Hallmark enrichment analysis of 7 epithelial cell clusters. The intensity of enrichment increases from blue to red
Fig. 3
Fig. 3
Construction and validation of the prognostic model TSCMS. A Overlapping CytoTRACE predicted stemness-associated genes and marker genes of Epi_C1. B Each independent variable’s trajectory and distribution for the lambda. C Expression of 49 TSCMS genes in TCGA-LUAD cohort. DF Kaplan–Meier plot of prognostic survival for TCGA (D), validation sets GSE26939 (E) and GSE72094 (F). GI ROC curves for TCGA (G) test set, validation sets GSE26939 (H) and GSE72094 (I). Red for 1-year, blue for 3-year, and black for 5-year survival rates
Fig. 4
Fig. 4
Immune infiltration and functional analysis of TSCMS. A Fraction scores of 22 immune cell infiltration using CIBERSORTx software. B-E Box plots of immune scores (B), stromal scores (C), ESTIMATE scores (D), and tumor purity (E) for TSCMS high- and low-risk groups using ESTIMATE software. F Enhanced GSEA plot for TSCMS gene set enrichment analysis
Fig. 5
Fig. 5
Prediction of immunotherapy efficacy using TSCMS in the IMvigor210 cohort. A Box plot of PD1 expression in high-risk and low-risk groups. B Box plot of PD-L1 expression in high-risk and low-risk groups. C Box plot of TSCMS scores in the anti-PD-L1 treatment group. D Box plot of CTLA4 expression in high-risk and low-risk groups. E Bar chart showing treatment response proportions in high-risk and low-risk groups. F Kaplan–Meier plot of TSCMS in the IMvigor210 Cohort
Fig. 6
Fig. 6
Comparison of anti-tumor drug sensitivity between high-risk and low-risk groups. A Bortezomib, Pazopanib, AKT inhibitor VIII, AZD6482, CGP.082996, and CEP-701 demonstrated enhanced drug sensitivity in the high-risk group. B CCT007093, GDC.0449, and Lapatinib exhibited superior drug sensitivity in the low-risk group. Statistics based on Wilcoxon test
Fig. 7
Fig. 7
TAF10 plays oncogenic role in LUAD. A mRNA expression levels of the corresponding gene in human normal bronchial epithelial cells (16HBE) and LUAD cell lines. B TAF10 mRNA expression levels in various tumors and matched normal tissues from the TCGA and GTEx databases, analyzed using SangerBox platform. C The stemness features (RNA expression-based stemness scores) analyses of TAF10 across different types of tumors in the TCGA database, analyzed by SangerBox platform. (D-E) Disease-free survival (D) and overall survival (E) analyses of TAF10 in LUAD samples from the TCGA database, performed using the GEPIA2 platform. (F) Protein expression levels of TAF10 in 16HBE and LUAD cell lines. G Representative IHC analysis of TAF10 expression in paired adjacent and tumorous tissues from LUAD patients (n = 5 pairs, 10 tissues in total). Black scale bar: 50 μm; red scale bar: 20 μm. H TAF10 knockdown in LUAD cells was confirmed by Western blot analysis. I LUAD cell lines were stably transfected with either shCtl or shTAF10 for 24, 48, and 72 h, and cell viability was measured using a CCK-8 assay. (J) The effect of TAF10 knockdown on colony formation in LUAD cells was assessed using a colony formation assay. (K) Representative micrographs and quantification of tumor sphere formation by TAF10-silenced cells (shTAF10) or vector control cells (shCtl). Scale bar, 100 μm. LN GSEA plot of KEGG (L), GOBP (M), and Hallmark pathways (N), grouped by TAF10 expression into TAF10-high and TAF10-low subgroups. NES represents the normalized enrichment score, and FDR represents the adjusted p-value

Similar articles

Cited by

References

    1. Denisenko TV, Budkevich IN, Zhivotovsky B. Cell death-based treatment of lung adenocarcinoma. Cell Death Dis. 2018;9:117. - PMC - PubMed
    1. Wang Y, Ding Y, Liu S, Wang C, Zhang E, Chen C, Zhu M, Zhang J, Zhu C, Ji M, et al. Integrative splicing-quantitative-trait-locus analysis reveals risk loci for non-small-cell lung cancer. Am J Hum Genet. 2023;110:1574–89. - PMC - PubMed
    1. Xu Y, Li J, Zhu K, Zeng Y, Chen J, Dong X, Zhang S, Xu S, Wu G. FIBP interacts with transcription factor STAT3 to induce EME1 expression and drive radioresistance in lung adenocarcinoma. Int J Biol Sci. 2023;19:3816–29. - PMC - PubMed
    1. Suva ML, Tirosh I. Single-cell RNA sequencing in cancer: lessons learned and emerging challenges. Mol Cell. 2019;75:7–12. - PubMed
    1. Lei Y, Tang R, Xu J, Wang W, Zhang B, Liu J, Yu X, Shi S. Applications of single-cell sequencing in cancer research: progress and perspectives. J Hematol Oncol. 2021;14:91. - PMC - PubMed

MeSH terms

Substances

LinkOut - more resources