

Impacts of land use change on carbon storage in the Guangxi Beibu Gulf Economic Zone based on the PLUS-InVEST model
- PMID: 39987139
- PMCID: PMC11846913
- DOI: 10.1038/s41598-025-89407-0
Impacts of land use change on carbon storage in the Guangxi Beibu Gulf Economic Zone based on the PLUS-InVEST model
Abstract
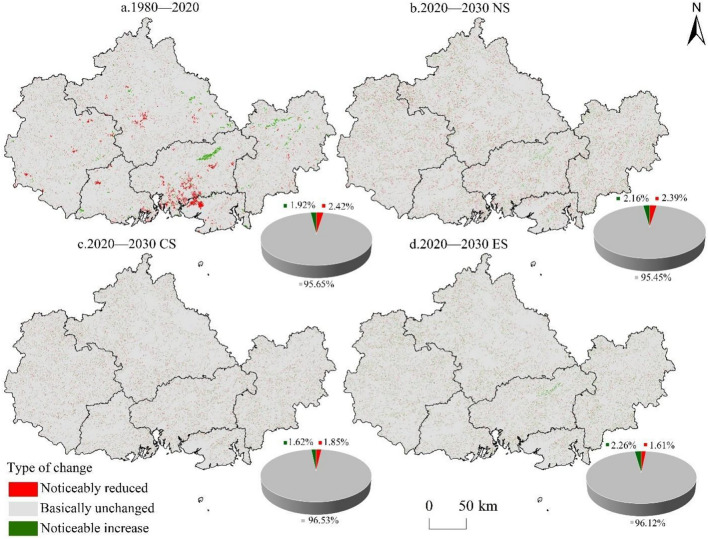
Under the vision of the 'dual-carbon' goal, land-use changes and their impact on carbon stocks are studied,to providing a reference for regional carbon balance. Taking the Beibu Gulf Economic Zone of Guangxi as an example, based on the data on land use and carbon density, the PLUS and InVEST models were applied to analyze the pattern of land use change from 1980 to 2020, simulate the spatial pattern of land use under three scenarios in 2030, and assess the carbon stock and its spatial and temporal change characteristics during the 50 years. The results show that: (1) From 1980 to 2020, the land use type of Guangxi Beibu Gulf Economic Zone was dominated by forest land, but the construction land continued to expand, and a large number of other land types were occupied. The formation of a changing trend of "one increase, many decreases" in which construction land increases and other land types decrease. (2) The carbon storage in the Guangxi Beibu Gulf Economic Zone is dominated by forest land, followed by cultivated land. (3) In 2030, there are differences in carbon storage under different development scenarios, and the transformation of land use types related to forest land and construction land dominates the change of carbon storage, and the carbon storage under the natural development scenario and cultivated land protection scenario will decrease to varying degrees, and only the carbon storage will increase under the ecological protection scenario. In 2030, the carbon storage in the ecological protection scenario will be 12.6916 × 10⁸t, an increase of 0.0936 × 10⁸t or 0.7429% compared with 2020. (4) In the past 50 years, the large expansion of construction land in the Guangxi Beibu Gulf Economic Zone has led to a downward trend in carbon storage, and the low-value areas of carbon storage in this area are mainly distributed in the urban areas of various cities and the coastal areas of "Qinbeifang". Hence, the carbon storage has obvious heterogeneity in spatial distribution, showing the characteristics of "low in the middle and high in the periphery".
Keywords: land use; Guangxi Beibu Gulf Economic Zone; InVEST model; PLUS model; carbon storage.
© 2025. The Author(s).
Conflict of interest statement
Declarations. Competing interests: The authors declare no competing interests.
Figures


Similar articles
-
[Temporal and Spatial Evolution and Prediction of Carbon Storage in the Haixi Prefecture of Qinghai Province Based on PLUS-InVEST Model].Huan Jing Ke Xue. 2025 Apr 8;46(4):1951-1963. doi: 10.13227/j.hjkx.202404294. Huan Jing Ke Xue. 2025. PMID: 40230107 Chinese.
-
Assessment of the impact of wetland changes on carbon storage in coastal urban agglomerations from 1990 to 2035 in support of SDG15.1.Sci Total Environ. 2023 Jun 15;877:162824. doi: 10.1016/j.scitotenv.2023.162824. Epub 2023 Mar 21. Sci Total Environ. 2023. PMID: 36948315
-
[Multi-scenario Simulation of Construction Land Expansion and Its Impact on Ecosystem Carbon Storage in Beijing-Tianjin-Hebei Urban Agglomeration].Huan Jing Ke Xue. 2024 May 8;45(5):2828-2839. doi: 10.13227/j.hjkx.202305221. Huan Jing Ke Xue. 2024. PMID: 38629545 Chinese.
-
[Characteristics of Spatial and Temporal Changes in Carbon Stocks in the Middle and Upper Reaches of the Huaihe River Basin and Future Multi-scenario Simulation Prediction].Huan Jing Ke Xue. 2024 Oct 8;45(10):5970-5982. doi: 10.13227/j.hjkx.202311034. Huan Jing Ke Xue. 2024. PMID: 39455141 Chinese.
-
Impacts of cropland expansion on carbon storage: A case study in Hubei, China.J Environ Manage. 2020 Jul 1;265:110515. doi: 10.1016/j.jenvman.2020.110515. Epub 2020 Apr 10. J Environ Manage. 2020. PMID: 32275243 Review.
Cited by
-
Integrating land use simulation and carbon assessment for sustainable urban planning in Fuzhou metropolitan area using PLUS and InVEST models.Sci Rep. 2025 Aug 19;15(1):30382. doi: 10.1038/s41598-025-13961-w. Sci Rep. 2025. PMID: 40830620 Free PMC article.
-
Spatiotemporal variation and driving forces of carbon storage in the Fuhe river basin, China.Sci Rep. 2025 Aug 18;15(1):30224. doi: 10.1038/s41598-025-14518-7. Sci Rep. 2025. PMID: 40825802 Free PMC article.
References
-
- Liu, Y., Jing, Y. & Han, S. Multi-scenario simulation of land use/land cover change and water yield evaluation coupled with the GMOP-PLUS-InVEST model: A case study of the Nansi Lake Basin in China. Ecol. Ind.155, 110926 (2023).
-
- Gomes, E. et al. Future land-use changes and its impacts on terrestrial ecosystem services: A review. Sci. Total Environ.781, 146716 (2021). - PubMed
-
- Tang L, Ke X, Zuo C, et al. Effects of spatiotemporal evolution of cultivated land system on carbon budget of terrestrial ecosystems in China[J].Journal of China Agricultural University,2024,29(10):278–289.
-
- Wang, X. et al. Spatiotemporal variation and potential of NPP in terrestrial ecosystems in Shaanxi Province from 2000 to 2020. J. Soil Water Conserv.38(03), 325–334 (2024).
-
- Zeng, Q. & Sun, C. Measurement of terrestrial ecosystem carbon storage and its influencing factors in the Yellow River Basin. Acta Ecol. Sin.44(13), 5476–5493 (2024).
LinkOut - more resources
Full Text Sources
Miscellaneous
