

Disulfidptosis classification of pancreatic carcinoma reveals correlation with clinical prognosis and immune profile
- PMID: 39987145
- PMCID: PMC11846472
- DOI: 10.1186/s41065-025-00381-z
Disulfidptosis classification of pancreatic carcinoma reveals correlation with clinical prognosis and immune profile
Abstract
Background: Disulfidptosis, a novel form of metabolism-related regulated cell death, is a promising intervention for cancer therapeutic intervention. Although aberrant expression of long-chain noncoding RNAs (lncRNAs) expression has been associated with pancreatic carcinoma (PC) development, the biological properties and prognostic potential of disulfidptosis-related lncRNAs (DRLs) remain unclear.
Methods: We obtained RNA-seq data, clinical data, and genomic mutations of PC from the TCGA database, and then determined DRLs. We developed a risk score model and analyzed the role of risk score in the predictive ability, immune cell infiltration, immunotherapy response, and drug sensitivity.
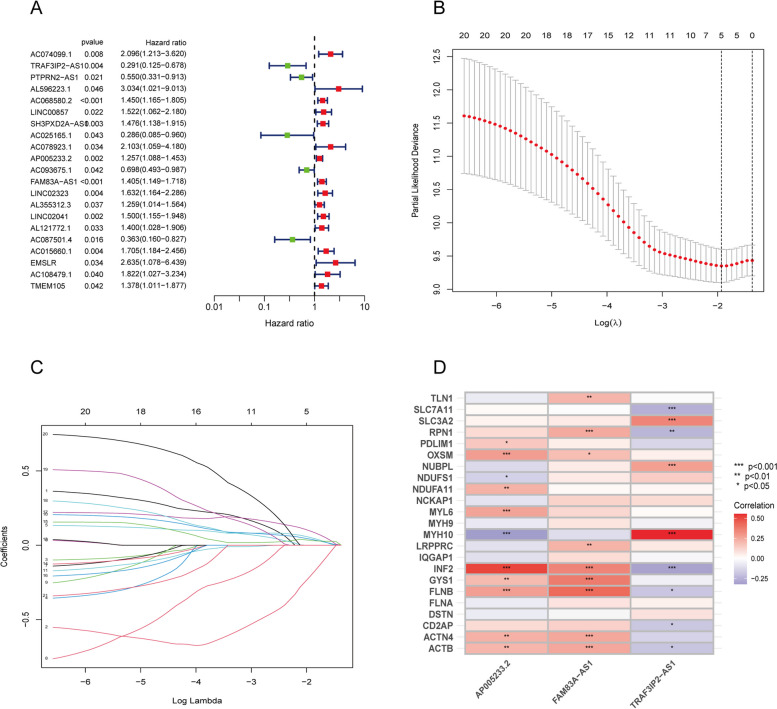
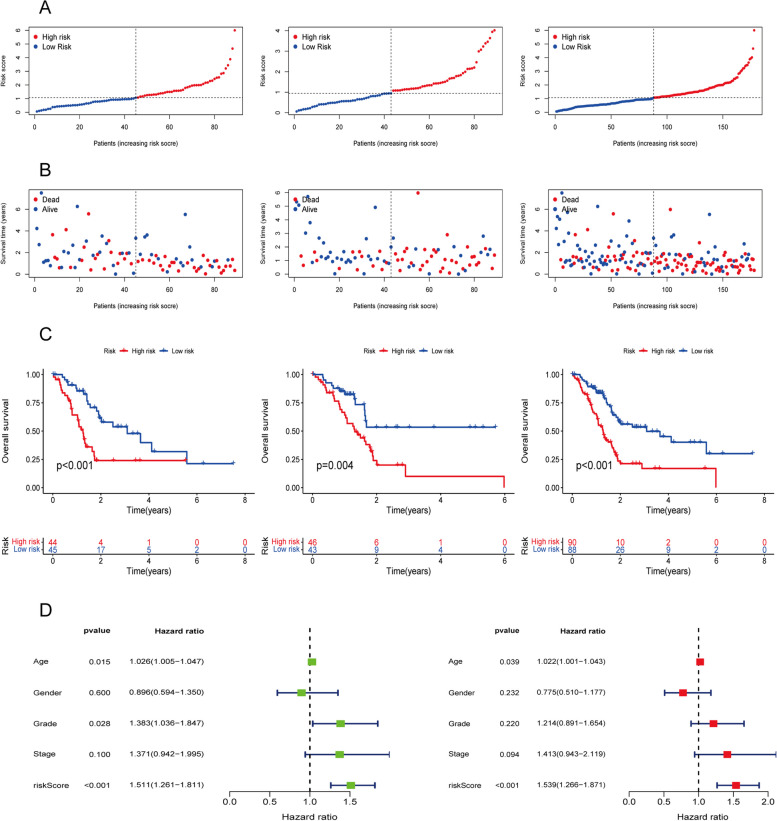
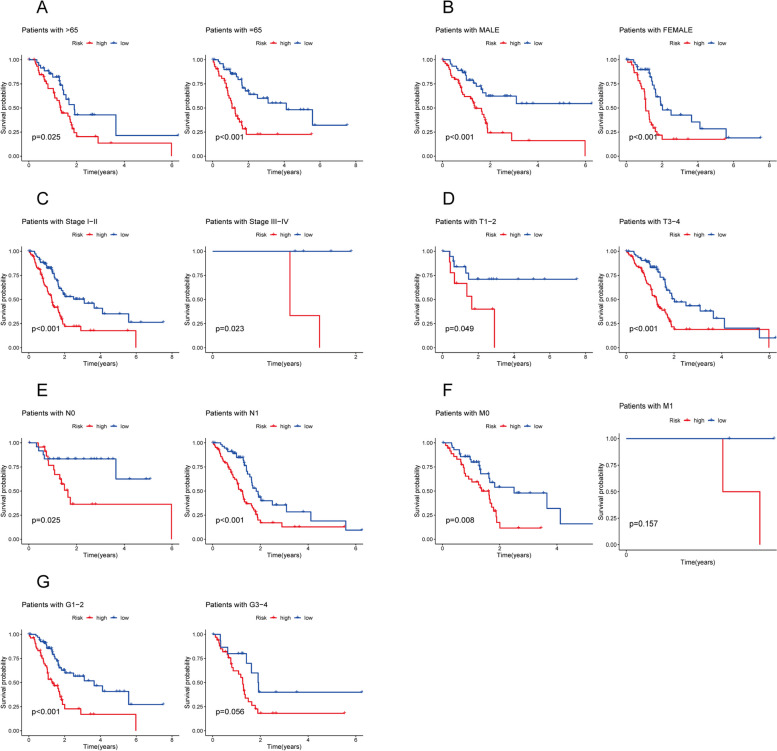
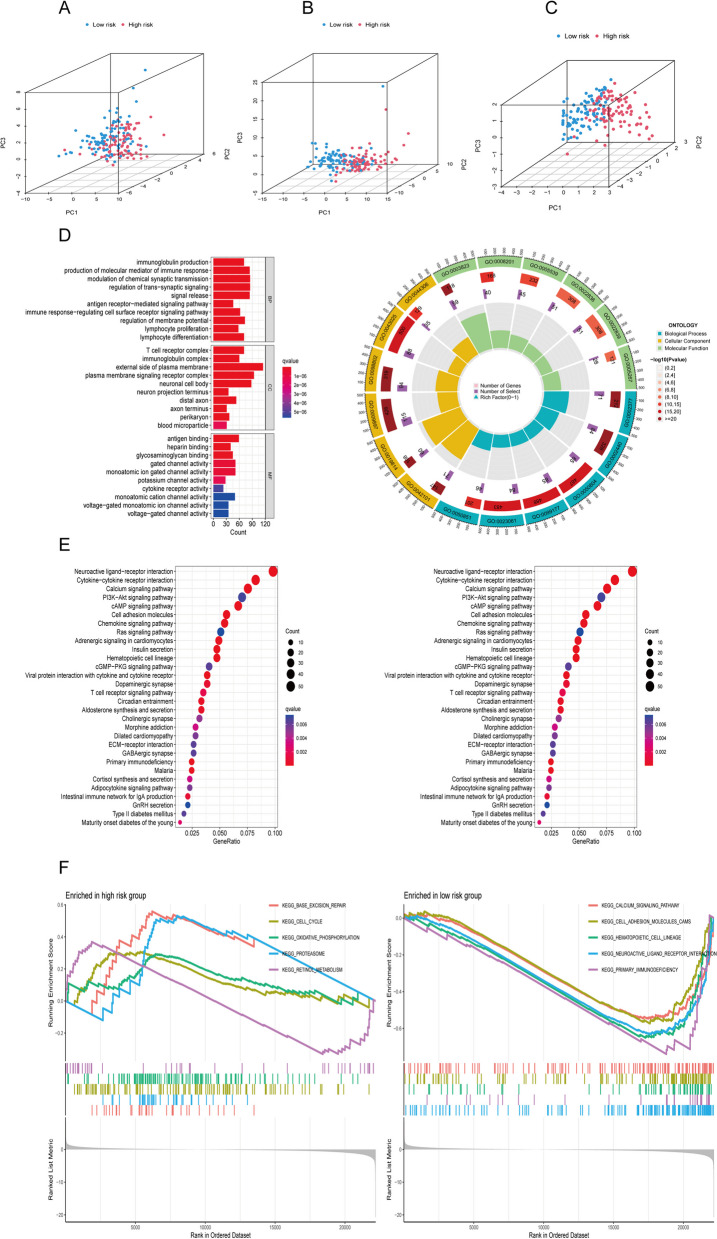
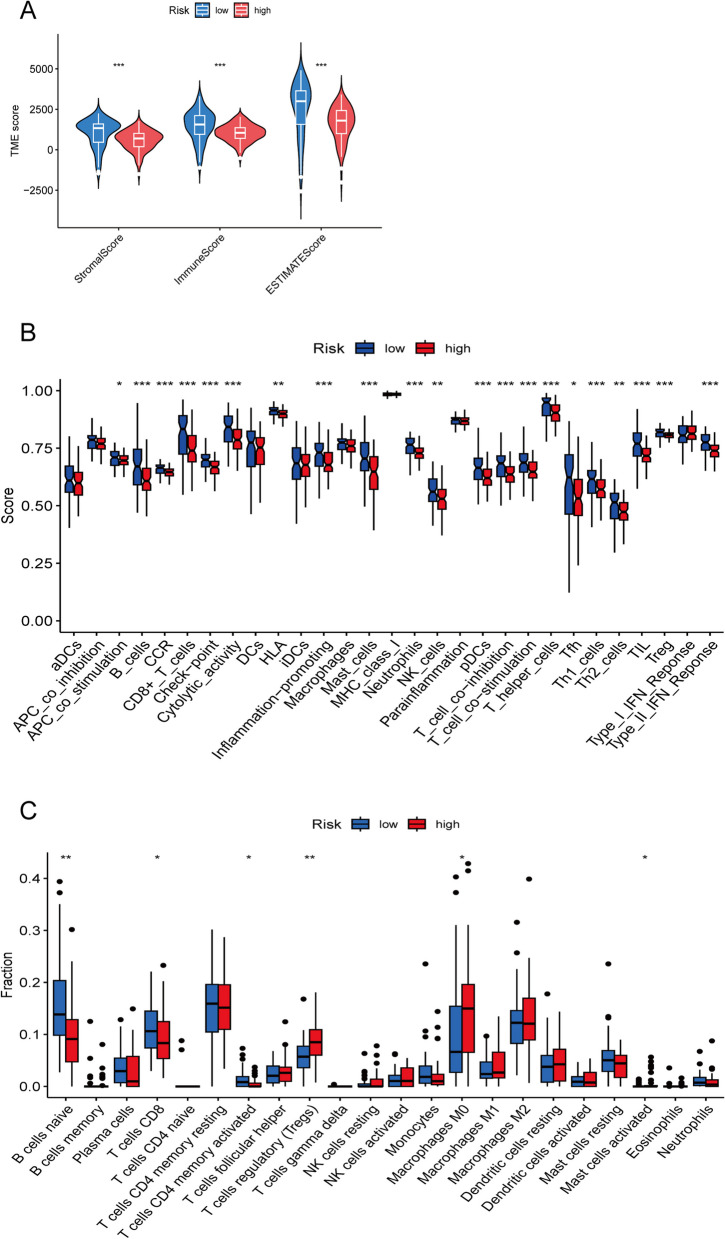
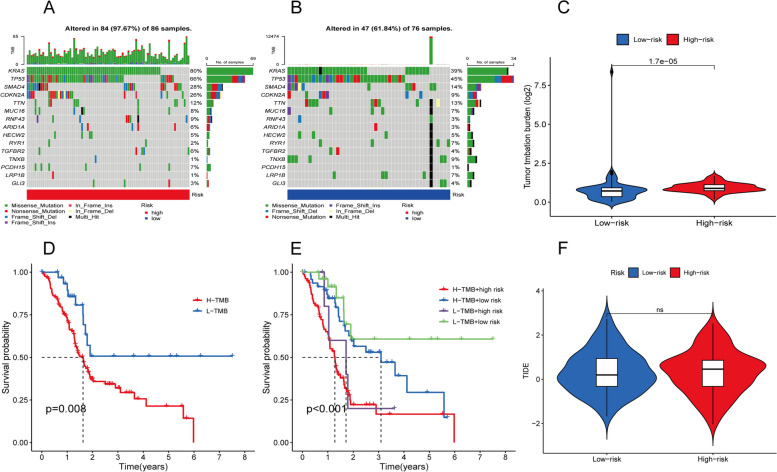
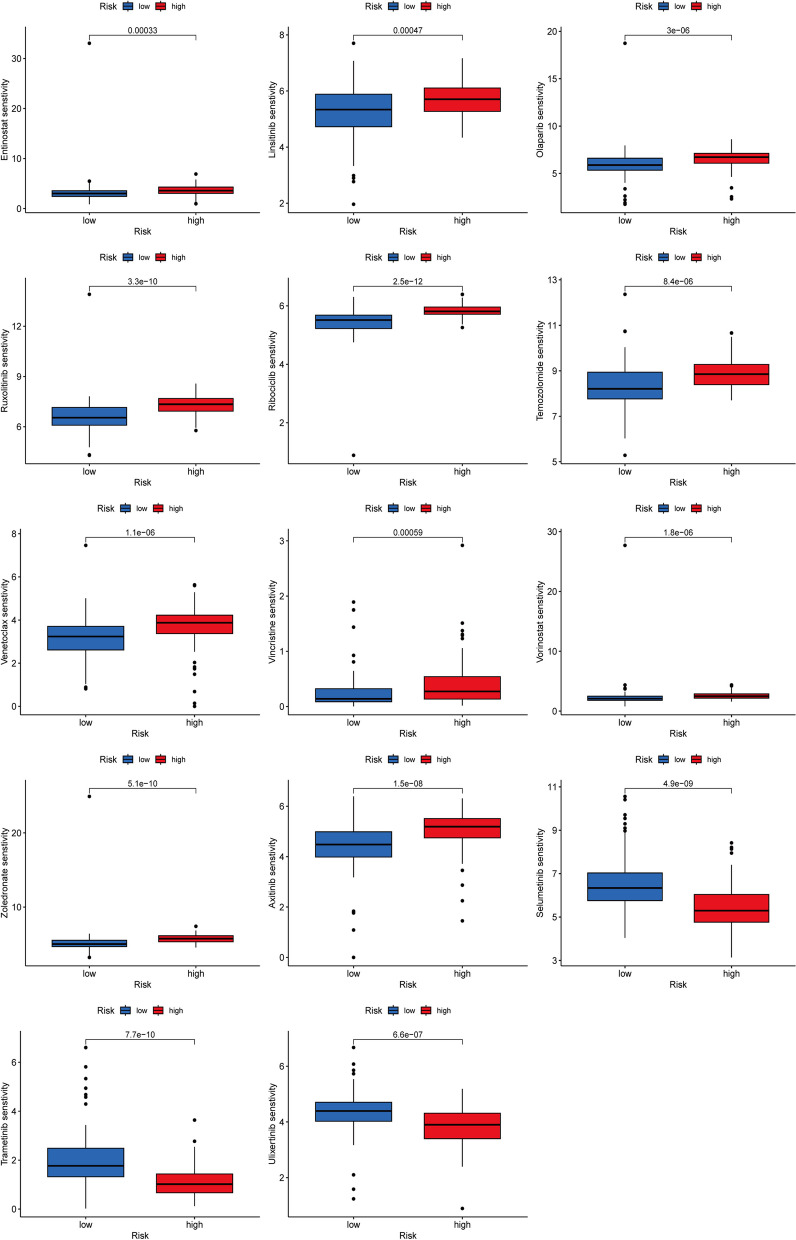
Results: We finally established a prognostic model including three DRLs (AP005233.2, FAM83A-AS1, and TRAF3IP2-AS1). According to Kaplan-Meier curve analysis, the survival time of patients in the low-risk group was significantly longer than that in the high-risk group. Based on enrichment analysis, significant associations between metabolic processes and differentially expressed genes were assessed in two risk groups. In addition, we observed significant differences in the tumor immune microenvironment landscape. Tumor Immune Dysfunction and Rejection (TIDE) analysis showed no statistically significant likelihood of immune evasion in both risk groups. Patients exhibiting both high risk and high tumor mutation burden (TMB) had the poorest survival times, while those falling into the low risk and low TMB categories showed the best prognosis. Moreover, the risk group identified by the 3-DRLs profile showed significant drug sensitivity.
Conclusions: Our proposed 3-DRLs-based feature could serve as a promising tool for predicting the prognosis, immune landscape, and treatment response of PC patients, thus facilitating optimal clinical decision-making.
Keywords: Disulfidptosis; Drug sensitivity; Immune microenvironment; Long noncoding RNA (lncRNA); Pancreatic carcinoma; Prognostic signature.
© 2025. The Author(s).
Conflict of interest statement
Declarations. Ethics approval and consent to participate: Not applicable. Consent for publication: All authors consent to the publication of this study. Competing interests: The authors declare no competing interests.
Figures
Similar articles
-
Construction and Validation of a Reliable Disulfidptosis-Related LncRNAs Signature of the Subtype, Prognostic, and Immune Landscape in Colon Cancer.Int J Mol Sci. 2023 Aug 18;24(16):12915. doi: 10.3390/ijms241612915. Int J Mol Sci. 2023. PMID: 37629096 Free PMC article.
-
Construction of a Novel Disulfidptosis-Related lncRNA Prognostic Signature in Pancreatic Cancer.Mol Biotechnol. 2024 Sep;66(9):2396-2414. doi: 10.1007/s12033-023-00875-z. Epub 2023 Sep 21. Mol Biotechnol. 2024. PMID: 37733182
-
Unlocking the Potential of Disulfidptosis-Related LncRNAs in Lung Adenocarcinoma: A Promising Prognostic LncRNA Model for Survival and Immunotherapy Prediction.Cancer Med. 2024 Oct;13(20):e70337. doi: 10.1002/cam4.70337. Cancer Med. 2024. PMID: 39431755 Free PMC article.
-
Development of a novel disulfidptosis-related lncRNA signature for prognostic and immune response prediction in clear cell renal cell carcinoma.Sci Rep. 2024 Jan 5;14(1):624. doi: 10.1038/s41598-024-51197-2. Sci Rep. 2024. PMID: 38182642 Free PMC article.
-
Advances in the study of disulfidptosis in digestive tract tumors.Discov Oncol. 2025 Feb 15;16(1):186. doi: 10.1007/s12672-025-01875-y. Discov Oncol. 2025. PMID: 39954025 Free PMC article. Review.
References
-
- Goral V. Pancreatic cancer: pathogenesis and diagnosis. Asian Pac J Cancer Prev. 2015;16(14):5619–24. - PubMed
-
- Cappell MS. Pathophysiology, clinical presentation, and management of colon cancer. Gastroenterol Clin North Am. 2008;37(1):1–24, v. - PubMed
-
- Sato H, Tamba M, Ishii T, Bannai S. Cloning and expression of a plasma membrane cystine/glutamate exchange transporter composed of two distinct proteins. J Biol Chem. 1999;274(17):11455–8. - PubMed
MeSH terms
Substances
Grants and funding
LinkOut - more resources
Full Text Sources
Medical
