. 2025 Feb 22;16(1):1875.
doi: 10.1038/s41467-025-57092-2.

Analysis of NS2-dependent effects on influenza PB1 segment extends replication requirements beyond the canonical promoter

Affiliations

Analysis of NS2-dependent effects on influenza PB1 segment extends replication requirements beyond the canonical promoter

Sharmada Swaminath et al. Nat Commun. .

Abstract

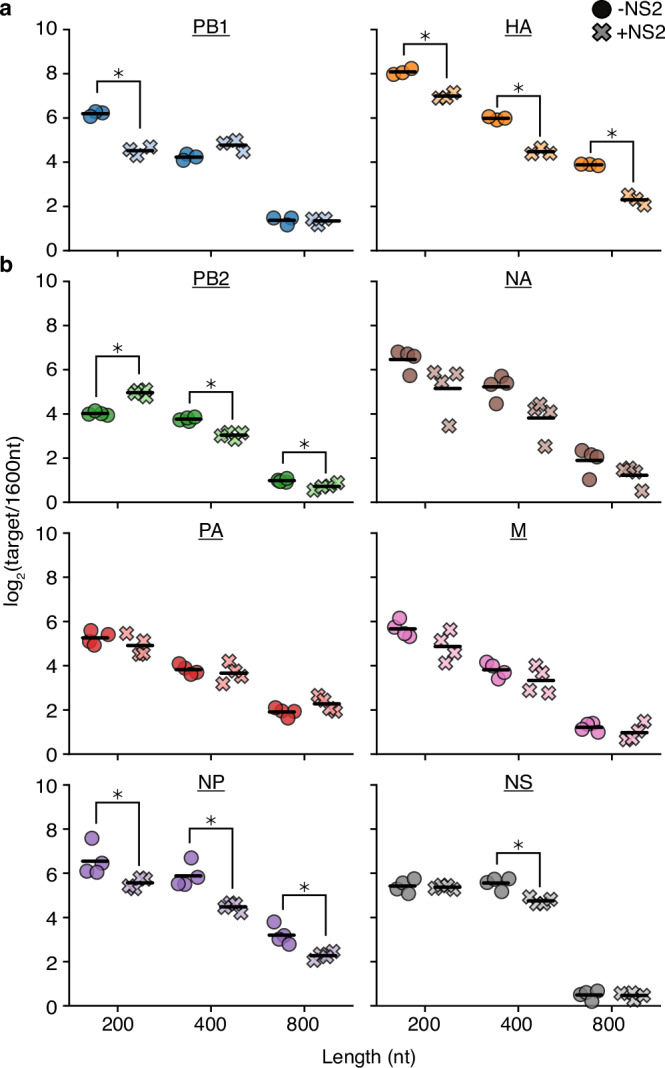
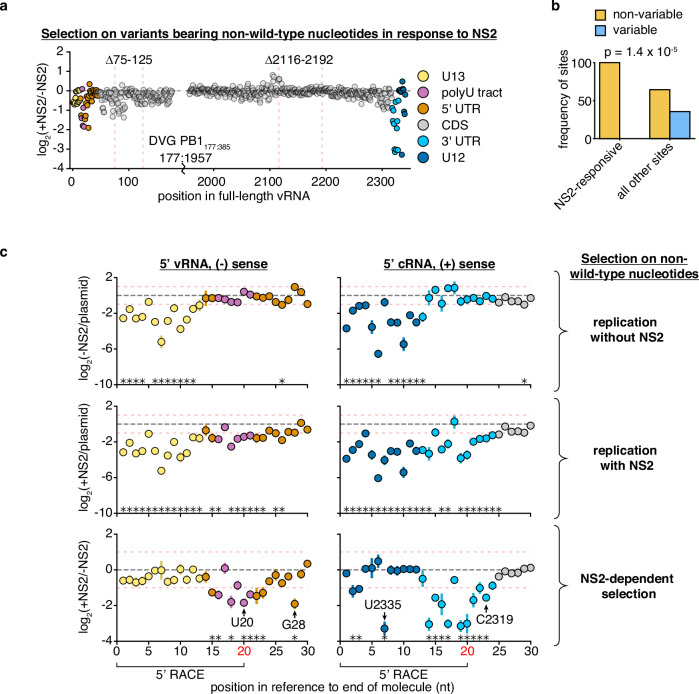
Influenza A virus encodes conserved promoter sequences. Using minimal replication assays-transfections with viral polymerase, nucleoprotein, and a genomic template-these sequences were identified as 13nt at the 5' end of the genomic RNA (U13) and 12nt at the 3' end (U12). Other than the fourth 3' nucleotide, the U12 and U13 sequences are identical between all eight RNA molecules of the segmented influenza A genome. However, individual segments can exhibit different dynamics during infection. Influenza NS2, which modulates transcription and replication differentially between genomic segments, may provide an explanation. Here, we assess how internal sequences of two genomic segments, HA and PB1, contribute to NS2-dependent replication and map such interactions down to individual nucleotides in PB1. We find that the expression of NS2 significantly alters sequence requirements for efficient replication beyond the identical U12 and U13 sequences, providing a potential mechanism for segment-specific replication dynamics across the influenza genome.


Conflict of interest statement

Competing interests: The authors declare no competing interests.

Figures

Fig. 1
Fig. 1. Prior models incompletely describe genome replication during viral infection.
a Our previous work found that 400nt variants of the PB1 and HA segments outcompete their full-length counterparts during genome replication, but during packaging, full-length variants have an advantage. More comprehensive library-based analyzes of genomic length showed that smaller sizes correlate with better replication efficiency and longer sizes better packaging efficiency. Inconsistent with this model, Alnaji et al. described a phenomenon where a short variant of the PB2 segment was outcompeted during genome replication. b A schematic describing our model derived from measuring thousands of length-variants in Mendes and Russell. c RNA genomes of barcoded 200, 400, 800, and 1600nt variants of A/WSN/1933 PB1 and HA bearing equal sequence length from 5’ and 3’ ends were generated from co-transfected plasmids using minimal replication machinery and rescued into virions by coinfection with wild-type virus. Viral supernatant was used to infect A549 cells at an MOI of 25, and qPCR was used to analyze the proportion of each variant before infection and within infected cells at 8 hours post-infection. 200, 400, and 800nt variants are assessed by their frequency relative to the 1600nt species. Asterisks indicate significantly different values, ANOVA p < 0.05, with post-hoc Tukey test, q < 0.05. n = 3, individual replicates and mean shown. Source data are provided as a Source Data file.
Fig. 2
Fig. 2. Expression of NS2 complicates simple length-dependent replication kinetics.
a, b Barcoded 200, 400, 800, and 1600nt variants of each individual segment bearing equal sequence length derived from 5’ and 3’ ends and lacking canonical start codons were generated and co-transfected into HEK293T cells along with the minimal replication machinery with, or without, NS2. The relative frequency of vRNA of each variant was measured by qPCR at 24 hours post-transfection, with 1600nt variants serving as a comparison. Asterisks indicate conditions significantly impacted by the expression of NS2, two-sample two-tailed t-test with a within-panel Benjamini-Hochberg corrected FDR < 0.05. n = 3 for (a), n = 4 for (b), individual replicates and mean displayed. Source data are provided as a Source Data file.
Fig. 3
Fig. 3. Analysis of length variant libraries confirms NS2-dependent replication effects.
Size distributions of libraries in transfections with minimal replication machinery only (−NS2) and with the addition of NS2 (+NS2) 24 hours post-transfection in HEK293T cells as compared to the original plasmid library or one another. The fraction of variants falling within each 100nt bin was compared. Points above the dotted line represent sizes in each individual library which were enriched, below, depleted. Points are only shown if represented in all three libraries under both conditions. R is the Spearman correlation coefficient. n = 3, all replicates shown. Inter-replicate correlation plots presented in Supplementary Fig. 4. Source data are provided as a Source Data file.
Fig. 4
Fig. 4. NS2 expression suppresses replication of PB1 lacking certain genomic regions.
a Reanalysis of data from Fig. 3. Comparing variants of identical length, the frequency at which a region is, or is not, observed under each condition was determined, and the median across all lengths for a given replicate and region presented. The dotted line separates regions whose absence enhances replication (above) from those whose absence reduces replication (below). Asterisks indicate a significant effect that was greater than 2-fold, one-sample two-tailed t-test, Benjamini-Hochberg corrected FDR < 0.1. b How the absence of the indicated region in (a) influences replication upon NS2 expression across a range of different lengths. Points shown if there were at least 100 measurements across all conditions. Statistics performed as in (a), with a FDR cutoff of 0.05. c Each indicated deletion was generated in a PB1177:385 background, co-transfected with a barcoded PB1 400nt competitor with, or without, NS2, and its replication was compared against the parental background at 24 h post-transfection by qPCR. Asterisks indicate that a given deletion reduces replication, one-tailed one-sample t-test, p < 0.05. Points represent mean and standard deviation, n = 3. d Variants from (c) were co-transfected with a barcoded PB1 400nt competitor and rescued into virions using infectious virus. A549 cells were infected with this population at a genome-calibrated MOI of 25 for 8 hours. The change in competitor and variant frequencies in vRNA during viral replication was determined by qPCR. Asterisks indicate reduced replication of the indicated variant when compared to the parental, two-tailed two-sample t-test, Benjamini-Hochberg corrected FDR < 0.05. e Positions in a full-length PB1 alignment defined as variable or non-variable by calculating the fraction of nucleotides at a position that do not match the major variant. At the chosen cutoff, 2.5%, a position is considered variable if at least 2.5% of sequences do not match the major variant. This cutoff was chosen to match the inflection point on our curve. f Frequency of variable sites within the given regions of PB1 as defined in (e). Significant difference between categories tested using Fisher’s exact test. Source data are provided as a Source Data file.
Fig. 5
Fig. 5. Positions within and beyond the canonical promoter are required for efficient replication in the presence of NS2.
The frequency of total non-wild-type nucleotides at each position during minimal replication assays was measured under each condition, and its enrichment, or depletion shown. Similar data were procured for total information content, which considers selection at each individual nucleotide at each individual position (Supplementary Fig. 12) (a) NS2-dependent selection measured across all of PB1177:385 against non-wild-type nucleotides, average value across all three replicates provided. Coordinates of deletions from Fig. 4 noted. Coordinates given as the full-length vRNA, regions of functional interest annotated. b Sites of significant selection in (a), as listed in Supplementary Table 1 analyzed as in Fig. 4f. Significant difference between categories tested using Fisher’s exact test. c Selection on non-wild-type nucleotides in the first 30nt in the vRNA (left) and cRNA (right). Mean and standard deviation graphed. Asterisks indicate regions with a greater than 2-fold effect size (denoted by red dotted lines) that differ significantly from no effect, one-sample t-test, Benjamini-Hochberg corrected FDR < 0.1. The first 20nt of vRNA and cRNA were inferred from 5’ RACE rather than simple amplicon sequencing (Supplementary Fig. 8). Positions further explored in Fig. 6 noted. Inter-replicate correlation plots presented in Supplementary Fig. 10. Source data are provided as a Source Data file.
Fig. 6
Fig. 6. Mutations to NS2-dependent sites can influence mRNA/cRNA/vRNA ratios and impact replication during infection.
a Each individual mutant in PB1177:385 was transfected alongside a 400nt internal control and minimal replication machinery with, and without, NS2. The relative frequency of each variant relative to the 400nt control was compared against wild-type under each condition at 24 hours. Asterisks indicate a ratio significantly less than 1, one-tailed one-sample t-test, Benjamini-Hochberg corrected FDR < 0.05, indicating that the parental exhibits an NS2-dependent advantage over the variant. Points represent mean and standard deviation, n = 3. b Quantitative analysis of primer extension in PB1177:385. All values in left two columns corrected against a parental template in the absence of NS2. Dotted line represents that value, points above indicate an increase in that molecular species, below, decrease. Values in the right column represent the ratio of points between the left two columns. Asterisks indicate values that are significantly decreased relative to the parental template, one-tailed t-test with Benjamini-Hochberg corrected FDR < 0.1. Individual replicates and mean presented, n = 3. Similar analyzes for full-length PB1 template presented in Supplementary Fig.14. c Indicated variants were introduced into full-length PB1 bearing inactivating mutations to its start codon and rescued via reverse genetics alongside a 1600nt internal competitor. MDCK-SIAT1 cells expressing PB1 were infected with the resulting mixture at a genome-calibrated MOI of 25 for 14 hours. The frequency of each variant in the mixed population was measured before, and after, viral replication. Values plotted represent the change in frequency during replication only. Asterisks indicate values significantly less than the parental, one-tailed two-sample t-test with Benjamini-Hochberg error correction FDR < 0.05. Source data are provided as a Source Data file.

Update of

References

    1. Holmes, E. C. Error thresholds and the constraints to RNA virus evolution. Trends Microbiol.11, 543–546 (2003). - PMC - PubMed
    1. O’Neill, R. E., Talon, J. & Palese, P. The influenza virus NEP (NS2 protein) mediates the nuclear export of viral ribonucleoproteins. EMBO J.17, 288–296 (1998). - PMC - PubMed
    1. Neumann, G., Hughes, M. T. & Kawaoka, Y. Influenza A virus NS2 protein mediates vRNP nuclear export through NES-independent interaction with hCRM1. EMBO J.19, 6751–6758 (2000). - PMC - PubMed
    1. Robb, N. C., Smith, M., Vreede, F. T. & Fodor, E. NS2/NEP protein regulates transcription and replication of the influenza virus RNA genome. J. Gen. Virol.90, 1398–1407 (2009). - PubMed
    1. Zhang, L. et al. Fine Regulation of influenza virus RNA transcription and replication by stoichiometric changes in viral NS1 and NS2 proteins. J. Virol.97, e0033723 (2023). - PMC - PubMed