. 2025 Aug;30(8):3413-3429.
doi: 10.1038/s41380-025-02929-x. Epub 2025 Feb 22.

YY1 mutations disrupt corticogenesis through a cell type specific rewiring of cell-autonomous and non-cell-autonomous transcriptional programs

Affiliations

YY1 mutations disrupt corticogenesis through a cell type specific rewiring of cell-autonomous and non-cell-autonomous transcriptional programs

Marlene F Pereira et al. Mol Psychiatry. 2025 Aug.

Abstract

Germline mutations of YY1 cause Gabriele-de Vries syndrome (GADEVS), a neurodevelopmental disorder featuring intellectual disability and a wide range of systemic manifestations. To dissect the cellular and molecular mechanisms underlying GADEVS, we combined large-scale imaging, single-cell multiomics and gene regulatory network reconstruction in 2D and 3D patient-derived physiopathologically relevant cell lineages. YY1 haploinsufficiency causes a pervasive alteration of cell type specific transcriptional networks, disrupting corticogenesis at the level of neural progenitors and terminally differentiated neurons, including cytoarchitectural defects reminiscent of GADEVS clinical features. Transcriptional alterations in neurons propagated to neighboring astrocytes through a major non-cell autonomous pro-inflammatory effect that grounds the rationale for modulatory interventions. Together, neurodevelopmental trajectories, synaptic formation and neuronal-astrocyte cross talk emerged as salient domains of YY1 dosage-dependent vulnerability. Mechanistically, cell type resolved reconstruction of gene regulatory networks uncovered the regulatory interplay between YY1, NEUROG2 and ETV5 and its aberrant rewiring in GADEVS. Our findings underscore the reach of advanced in vitro models in capturing developmental antecedents of clinical features and exposing their underlying mechanisms to guide the search for targeted interventions.


Conflict of interest statement

Competing interests: The authors declare no competing interests. Ethics approval and consent to participate: All methods were performed in accordance with the relevant guidelines and regulations. This study was approved by the institutional review board of the University of Milan ethics committee. Written informed consents were obtained for all individuals. All animal experiments were done in accordance with the Italian Laws (D.L.vo 116/92 and following additions), which enforces EU 86/609 Directive (Council Directive 86/609/EEC of 24 November 1986), and were approved by institutional ethics committee (organismo preposto al benessere degli animali, OPBA committee) and the Italian Ministry of Health (Authorization 1073/16-PR).

Figures
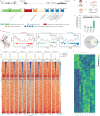
Fig. 1
Fig. 1. YY1 dosage imbalances are equally detrimental for DNA binding and transcriptional regulation at the pluripotency stage.
a Map of YY1 gene structure and mutation distribution. From the top, YY1 location on chromosome 14 is reported above exon composition and genomic coordinates. Dashed lines report the contribution of each exon to the coded protein. A scheme of the protein is reported with ammino acid residues numbering of each functional domain. Previously described mutations are reported in light grey, newly described mutations are reported in black. Samples used in this study are named as GAD01-03. On the bottom, a legend describing protein domains is reported. b Illustration shows that samples from healthy and affected individuals (GAD01-03) were reprogrammed into induced pluripotent stem cells (iPSCs). c YY1 protein levels (normalized to GAPDH) revealed opposite levels of YY1 in GAD03 compared to the remaining GADEVS cohort samples. *P < 0.05, n = 6, unpaired Student’s t-test vs. CTL. Values are mean ± SEM of n independent experiments. n refers to the number of protein extracts processed per line. d Molecular dynamics of YY1-DNA complex represented in terms of Root Mean Square Fluctuation (RMSF), reported on the y-axis (nm) per residue (x–axis). Flexibility changes are reported around zinc-binding sites. e Venn diagram reporting the intersection of YY1 peaks in CTL and GADEVS lines. Light grey reports CTL specific peaks (lost), light green refers to shared peaks, dark grey indicates GADEVS-specific (gained) peaks. f Heatmap of library-size normalized YY1 ChIP-seq coverage (RPGC) at YY1 binding sites. Each row represents a 5-kb window centered on peak summits. Reads distribution at Shared, Gained, and Lost peaks are respectively depicted in yellow, blue and cyan. g Heatmap showing z-scores of log(TMM) read counts for DEGs (764) derived from comparing YY1-mutant vs. control iPSCs (FDR <= 0.05 and FC >= 1.5). Yellow and dark blue colors respectively indicate expression levels of up- (179) and downregulated (585) genes.
Fig. 2
Fig. 2. YY1-controlled downregulated genes in iPSC point to pathologically relevant GO and HPO categories.
a Diagram of the data integration framework applied in the figure. ChIP-seq and RNA-seq from iPSC have been combined to identify the role of differentially expressed genes directly targeted by YY1. b Hierarchical clustering representation of GO (biological processes) enrichments. Hierarchical clustering by Jaccard index similarity index is reported on the right. Number of genes defines node’s size and node’s color and it is defined by p-adjusted of each category enrichment. c UpSet plot reporting the intersection of genes whose promoter or enhancers (or both) are bound by YY1 in control lines, intersected with downregulated DEGs. On the top right, the set size (number of genes) is reported for DEGs, genes bound by YY1 at the promoter, and genes bound by YY1 at the enhancer. Genes found in more than one list are indicated on the bottom side as linked dots. d Heatmap reporting z-scores of logTMM read counts for downregulated DEGs, annotated following the intersection reported on panel b. On the y-axis, each row represents the expression of each sample; on the x-axis each DEG is annotated whether it lost YY1 binding at both promoter and enhancer or only at promoter or enhancer. e Bipartite plot representing gene-HPO associations for differentially expressed genes, and HPO categories significantly enriched by them. All genes reported are downregulated YY1 direct targets enriching at least one HPO category.
Fig. 3
Fig. 3. GADEVS cortical brain organoids show impairments in ventricle-like structure (VLS) formation and stage-specific transcriptional disruptions.
a Illustration of organoids generation protocol, representing telencephalon small molecule patterning and stage-specific characterization performed. Representative images of immunofluorescence (IF) performed using PAX6, and MAP2 at days 30 and 90, respectively. b Representative pictures of IF and cleared whole cortical organoids with PAX6, and NESTIN for the two different genotypes (CTL and GADEVS). c Representative images of PAX6-positive VLS counted per organoid and classified as regular and irregular depending on the shape and presence of ventricle-like lumen. (whole-organoids acquired in CTL, n = 32; and GADEVS, n = 25). Scale bar is 100 μm for all images. d Diffusion map dimensionality reduction reporting cell type distributions at day 30. e Barplot of differentially expressed genes number per cell type at day 30. f Diffusion map dimensionality reduction reporting cell type distributions at day 90. g Barplot of differentially expressed genes number per cell type at day 90. Scale bar of 100 μm for all images.
Fig. 4
Fig. 4. Mechanistic dissection of cell type specific YY1-dependent dysregulations pinpoint YY1 regulatory activity to cell migration in IP and ion channels in mature neurons, as well as cell-cell communication defects among glia cells in late stages of GADEVS organoids corticogenesis.
a Graph representation of the RG gene-regulatory-network comprising YY1 and its differentially expressed direct targets. Transcription factors are represented as diamond. Nodes are coloured by log2FC. Purple borders represent association to “positive regulation of developmental process” GO category. Arrows represent activation by YY1 and T-shaped edges represent putative repressive activity by YY1. b Gene regulatory network representation of YY1 direct targets in IP. Arrows represent activation by YY1 and T-shaped edges represent putative repressive activity by YY1. Nodes color represent log2(FC) measured by differential expression on IP pseudobulks, comparing controls with GADEVS lines. Green borders represent association to “morphogenesis” GO categories. c Gene regulatory network representation of YY1 direct targets enriching cell ion channel category in lower layer-like neurons. Edges and nodes are depicted as in panel b, using log2(FC) from differential expression performed on lower- layer neurons d Gene regulatory network representation of YY1 direct targets enriching cell ion channel category in upper layer-like neurons. Edges and nodes are depicted as in panel b, using log2(FC) from differential expression performed on upper-layer neurons. e Diffusion map of day 90 organoids representing differential abundance scores measured with miloR (see methods). Neighbors of cells are represented as circles of proportional sizes with respect to the number of cells embedded in each group. Dots are colored in red proportionally with logFC measured as the relative abundance of GADEVS with respect to CTL in each neighbor (p < 0.01). f Differential cell-cell interactions calculated by Liana at day 90. Arrows depict interactions between cell types inferred by expression of receptor-ligand pairs. Only significantly affected interactions are depicted. g heatmap depicting log2(FC) of genes involved in PROGENy cell-cell signaling pathways, derived from differential expression analysis on pseudobulk of RG ad day 90.
Fig. 5
Fig. 5. GADEVS iPSC-derived glutamatergic neurons display transcriptional and morphological synaptic abnormalities.
a Differentiation protocol to generate glutamatergic neurons starting from human derived iPSC. To induce NGN2 ectopic expression a ePiggyBac plasmid was transfected by electroporation. After selection, iPSC were co-cultured on transwell with fresh mouse astrocytes for 35 days. Immunostainings showed coherent expression of dendritic and pan-axonal markers MAP2B and SMI312 (scale bar 100 μm) and co-culture was achieved by addition of astrocytes (S100β-positive, scale bar 50 μm). b Diffusion map of single- cell RNA modality from NGN2 iPSC-derived neurons show an heterogenous set of cell types including early and mature neuronal lineages. A color legend depicting cell types is provided on the bottom of the panel c Dotplot showing representative markers of glutamatergic neurons, pan markers of neuronal lineages, and markers of progenitors and glial cells. d Upset plot reporting the intersection of lists of differentially expressed genes (DEGs). Glutamatergic neurons (orange) show the largest cell type specific set of DEGs e Dotplot of GO enrichments (biological process) for genes differentially expressed in the glutamatergic neurons cluster. f Representative figures of glutamatergic neurons immunostained with MAP2B and synapsins1/2. Scale bar is 50 μm. Synaptic puncta were quantified by counting the number of synapsins 1/2 when co-localized with MAP2B de-noised signal for all fields of view acquired. Graph on the right shows the calculated percentage of synaptic puncta normalized to MAP2B (grouped analysis CTL n = 156 vs. GADEVS n = 117 fields of view across 4 independent seedings). Results are presented as median (min, max, and range) of percentages of synaptic puncta counted in n different fields of view independently acquired. ****P < 0.0001 vs. CTL using a two-tailed Mann-Whitney test.
Fig. 6
Fig. 6. Astrocytes co-cultured with affected neurons undergo cell activation.
a Wild type mouse astrocytes co-cultured with both CTL and GADEVS neurons were harvested and profiled using bulk RNA-seq. DEA revealed predominant upregulation out of the total 291 DEGs (248 upregulated DEGs, FDR <= 0.05 and FC >= |2|). Gene-concept network plot describes the interactions across genes belonging to significant biological processes GO terms. b Main component of co-expression network generated from DEGs enriching cell activation GO categories depicted in panel a. Nodes of TFs are indicated as squares (Spi1, Myb, Fosb, Foxn4, Neurog2, and Tnf). Edges are denoted as light grey strokes. Node borders are proportional to its degree (highest degree scored 5, DEGs linked are Itgb2, Tnf, Fcer1g, Lcp2, and Fcgr3). The color of the node span from white (lowest) to green (highest). Nodes with highest centrality scores include Itgb2, Igf1, Fcerg1, Tnf, and Sspo. Centrality here is the topological index of each node (i.e., DEG). Degree centrality is proportional to the number of connections of a given node, while betweenness centrality correlates with the number of times a node is included in the shortest path between any other two nodes in the network.
Fig. 7
Fig. 7. Mechanistic dissection of molecular dysregulations in GADEVS iPSC-derived NGN2 neurons depicts a broad loss of TF activity, and a subnetwork of transcriptional regulation pinpointing YY1 haploinsufficiency to pathologically relevant processes.
a UMAP representation of single-cell ATAC data. Cells are colored by transferring cell type annotation from each cell shared with the RNA-seq modality. Cell type specific colors are reported on the bottom of the panel. b Differential TF activity measured with ChromVar by inference from accessibility changes between control and GADEVS neurons at regulatory regions identified by co-accessibility with Cicero. MeanDiff represent the differential TF activity measured by ChromVar. c heatmap of GO (biological process) categories enriched by differentially expressed genes. Number of DEGs enriched in each category under the control of each TF (reported below) is indicated in each square. Each square is colored by enrichment measured by the representation of targets of each TF in each category. d Heatmap of shared targets between pairs of TFs among differentially expressed genes. Each square is coloured by the relative enrichment measured on the targets of the TF indicated on the rows with respect to the target indicated in the column (the number reported in each square of the heatmap is the number of shared DEGs between the factor on the x-axis and the factor on the y-axis). e, f Subnetwork of control (e) and GADEVS-specific (f) regulatory interactions among the TFs reported in panels c and d. Arrows and T-shaped edges respectively represent activation and repression (as inferred by CellOracle). Blue and red colored gene names respectively denote downregulation and upregulation of the TFs in GADEVS glutamatergic neurons.

Update of

Similar articles

References

    1. Gabriele M, van Silfhout ATV, Germain PL, Vitriolo A, Kumar R, Douglas E, et al. YY1 haploinsufficiency causes an intellectual disability syndrome featuring transcriptional and chromatin dysfunction. Am J Hum Genet. 2017;100:907–25. - PMC - PubMed
    1. Vissers LELM, de Ligt J, Gilissen C, Janssen I, Steehouwer M, de Vries P, et al. A de novo paradigm for mental retardation. Nat Genet. 2010;42:1109–12. - PubMed
    1. Ferng A, Thulin P, Walsh E, Weissbrod PA, Friedman J. YY1: a new gene for childhood onset dystonia with prominent oromandibular-laryngeal involvement? Mov Disord Off J Mov Disord Soc. 2022;37:227–8. - PubMed
    1. Zorzi G, Keller Sarmiento IJ, Danti FR, Bustos BI, Invernizzi F, Panteghini C, et al. YY1-related dystonia: clinical aspects and long-term response to deep brain stimulation. Mov Disord Off J Mov Disord Soc. 2021;36:1461–2. - PubMed
    1. Nabais Sá MJ, Gabriele M, Testa G, de Vries BB. Gabriele-de Vries Syndrome. GeneReviews®. Seattle (WA): University of Washington, Seattle; 2019. - PubMed

MeSH terms

Substances

LinkOut - more resources