. 2025 Feb 22;16(1):1890.
doi: 10.1038/s41467-025-57211-z.

Cooperation of TRADD- and RIPK1-dependent cell death pathways in maintaining intestinal homeostasis

Affiliations

Cooperation of TRADD- and RIPK1-dependent cell death pathways in maintaining intestinal homeostasis

Ziyu Sun et al. Nat Commun. .

Abstract

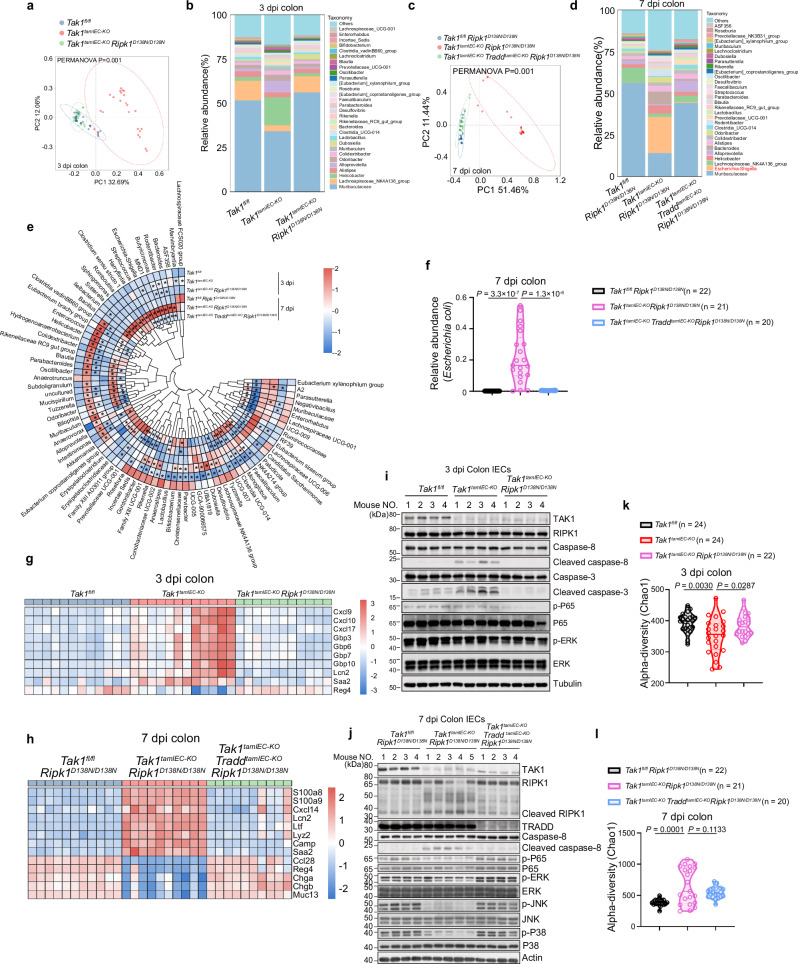
Dysfunctional NF-κB signaling is critically involved in inflammatory bowel disease (IBD). We investigated the mechanism by which RIPK1 and TRADD, two key mediators of NF-κB signaling, in mediating intestinal pathology using TAK1 IEC deficient model. We show that phosphorylation of TRADD by TAK1 modulates RIPK1-dependent apoptosis. TRADD and RIPK1 act cooperatively to mediate cell death regulated by TNF and TLR signaling. We demonstrate the pathological evolution from RIPK1-dependent ileitis to RIPK1- and TRADD-co-dependent colitis in TAK1 IEC deficient condition. Combined RIPK1 inhibition and TRADD knockout completely protect against intestinal pathology and lethality in TAK1 IEC KO mice. Furthermore, we identify distinctive microbiota dysbiosis biomarkers for RIPK1-dependent ileitis and TRADD-dependent colitis. These findings reveal the cooperation between RIPK1 and TRADD in mediating cell death and inflammation in IBD with NF-κB deficiency and suggest the possibility of combined inhibition of RIPK1 kinase and TRADD as a new therapeutic strategy for IBD.


Conflict of interest statement

Competing interests: The authors declare no competing interests.

Figures

Fig. 1
Fig. 1. RIPK1 Kinase inhibition protects early-stage ileitis and colitis in newborn Tak1IEC-KO mice, as well as ileitis and early-stage colitis in adult Tak1tamIEC-KO mice.
a, b Representative images of ileum and colon sections from mice at P0 with indicated genotypes stained with H&E or immunostained for CC3 (a). Graphs showed the CC3+ signals in the ileum and colon of mice with the indicated genotypes (b). Scale bar, 100 μm. c Intestine length in mice with indicated genotypes at P0. d Kaplan–Meier survival curves of the indicated genotypes. eh Representative images of the ileum (e) and colon (g) sections from mice at P4 with indicated genotypes stained with H&E or immunostained for CC3. Graphs showed the CC3+ signals in the ileum (f) and colon (h) of mice with indicated genotypes. Scale bar, 100 μm. i Intestine length in mice with indicated genotypes at P4. j The scheme of tamoxifen-induced TAK1 deletion. Created in BioRender. Yuan, J. (2025) https://BioRender.com/b69p319. k Kaplan–Meier survival curves of the mice with indicated genotypes. l Relative body weight curve of the mice with indicated genotypes. The body weight of each mouse was normalized to the weight of the day 0. m Intestine length of the mice at 3 dpi with indicated genotypes. n, o Representative images of ileum and colon sections from the mice at 3 dpi with indicated genotypes stained with H&E or immunostained for CC3 (n). Graphs showed the CC3+ signals in the ileum and colon of the mice with indicated genotypes (o). Scale bar, 150 μm for ileum; 100 μm for colon; ps Representative images of the ileum (p) and colon (r) sections from the mice at 7 dpi with indicated genotypes stained with H&E or immunostained for CC3. Graphs showed the CC3+ signals in the ileum (q) and colon (s) of the mice with indicated genotypes. Anti-TNFα was treated in the indicated group from 1 day before tamoxifen injection every other day for a total of four times until sacrificed. Scale bar, 150 μm. Each dot represented one mouse. The results were shown as mean ± SEM. An unpaired two-tailed t-test was performed.
Fig. 2
Fig. 2. Combined loss of FADD and MLKL prevents intestinal pathology in newborn and adult TAK1 IEC-deficient mice.
a Kaplan–Meier survival curves of the mice with indicated genotypes. b, c Body weight curve of the mice with indicated genotypes. d, e, g, h Representative images of ileum and colon sections from mice at P4 (d) or P0 (g) with indicated genotypes stained with H&E or immunostained for CC3. Graphs showed the CC3+ signals in the ileum and colon of the mice with indicated genotypes at P4 (e) or P0 (h). Scale bar, 100 μm. f Intestine length in the mice with indicated genotypes at P0. i Kaplan–Meier survival curves of the mice with indicated genotypes. j Relative body weight curve of the mice with indicated genotypes. The body weight of each mouse was normalized to the weight of day 0. k, l Representative images of ileum and colon sections from mice at 3 dpi and 7 dpi of the indicated genotypes stained with H&E or immunostained for CC3 (k). Graphs showed the CC3+ signals in the ileum and colon of mice with the indicated genotypes (l). Scale bar, 150 μm for ileum; 100 μm for colon; m Intestine length of the mice at 3 dpi with indicated genotypes. Each dot represented one mouse. The results were shown as mean ± SEM. An unpaired two-tailed t-test was performed.
Fig. 3
Fig. 3. Cooperation of TRADD and RIPK1 kinase in mediating intestinal pathology of newborn Tak1IEC-KO mice and TAK1 inhibition induced cell death in TNF pathway.
a Kaplan–Meier survival curves of the mice with indicated genotypes. b Intestine length in the mice with indicated genotypes at P0. ch Representative images of ileum and colon sections from the mice at P0 (c) or P4 (e for ileum, g for colon) with indicated genotypes stained with H&E or immunostained for CC3. Graphs showed the CC3+ signals in the ileum and colon of the mice with indicated genotypes at P0 (d) or P4 (f for ileum, h for colon). i, j Body weight curve of the mice with indicated genotypes. Scale bar, 100 μm. Each dot represented one mouse. The results were shown as mean ± SEM. An unpaired two-tailed t-test was performed. k, l Tradd+/+ and Tradd−/− ileum (k) and colon (l) organoids were treated with 500 nM (5Z)-7-oxozeaeno and 20 ng/ml mTNF-α for 24 h (k) or 12 h (l) with or without 50 μM Nec-1s. The cell death in organoids was determined by PI staining. Scale bar, 50 μm. Each dot represented one organoid. The results were shown as mean ± SEM. An unpaired two-tailed t-test was performed. (m) Tradd+/+ and Tradd−/− MEFs were pretreated with 500 nM (5Z)-7-oxozeaeno, +/− Nec-1s (20 μM), +/− zVAD (50 μM) for 0.5 hr followed by 20 ng/ml mTNF-α treatment. The complex-II was isolated by FADD immunoprecipitated and detected by immunoblotting. n Phos-tag SDS-PAGE analysis of mTNF-α (100 ng/ml) stimulated WT MEFs with or without (5Z)-7-oxozeaeno (500 nM) pretreatment for 0.5 h. o HEK293T cells were co-transfected with expression vectors for Flag-mTRADD with different mutations and +/−HA-mFADD for 24 h. The cell lysates were then immunoprecipitated using anti-Flag resin. The binding of TRADD and FADD was analyzed by immunoblotting. p, q Tradd−/− MEFs were retrovirally reconstituted with HA-tagged TRADD with different mutations. Reconstituted cells were stimulated with 500 nM (5Z)-7-oxozeaeno for 0.5 h followed by 20 ng/ml mTNF-α. Cell death was measured by SytoxGreen, and the mean ± SEM from eight biological replicates was shown (p). The levels of Caspase-8, CC8, Caspase-3, CC3, RIPK1, p-RIPK1(S166), and HA were determined by immunoblotting (q).
Fig. 4
Fig. 4. Microbiota drive RIPK1 kinase and TRADD co-dependent intestinal pathology in adult Tak1tamIEC-KO mice.
a Kaplan–Meier survival curves of the indicated genotypes. ABX was pretreated for 14 days before and through tamoxifen injection of the mice with indicated genotypes until sacrificed. Survival data for Tak1tamIEC-KO Ripk1D138N/D138N mice from Fig. 1k were included for comparison. b Relative body weight of the mice with indicated genotypes at 7 dpi. The body weight of each mouse was normalized to the weight of day 0. Body weight data for Tak1fl/fl Ripk1D138N/D138N and Tak1tamIEC-KO Ripk1D138N/D138N mice at 7 dpi from Fig. 1l were included for comparison. c, d Representative images of colon sections from the mice at 7 dpi with indicated genotypes stained with H&E or immunostained for CC3 (c). Graphs showed the CC3+ signals in the colon of the mice with indicated genotypes (d). CC3+ signals for Tak1fl/fl Ripk1D138N/D138N mice and Tak1tamIEC-KO Ripk1D138N/D138N mice from Fig. 1s were included for comparison. e PCA on RNA-seq data from the colon of the mice with indicated genotypes at 7 dpi. PCA was based on genes differentially expressed between Tak1fl/fl Ripk1D138N/D138N mice and Tak1tamIEC-KO Ripk1D138N/D138N mice (cut-off: log2|fold change | ≥1, p ≤ 0.05). f GO analysis of genes upregulated in the colon of Tak1tamIEC-KO Ripk1D138N/D138N mice in TRADD-dependent fashion. g The mRNA levels of inflammatory cytokines in the colon of the mice with indicated genotypes at 7 dpi were measured by qRT-PCR. Scale bar, 150 μm. Each dot represented one mouse. The results were shown as mean ± SEM. An unpaired two-tailed t-test was performed.
Fig. 5
Fig. 5. Cooperation of TRADD and RIPK1 kinase in TLR signaling pathway.
af Tradd+/+ and Tradd−/− colon organoids were treated with 500 nM (5Z)-7-oxozeaeno and Pam3CSK4 (1 μg/ml) (a, b), LPS (1 μg/ml) (c, d) or Flagellin (500 ng/ml) (e, f) for 12 h with or without 50 μM Nec-1s. Cell death in organoids was determined by PI staining. Each dot represented one organoid. Scale bar, 50 μm. The results were shown as mean ± SEM. An unpaired two-tailed t-test was performed. gl Primary BMDMs from the mice with indicated genotypes pretreated Pam3CSK4 (1 μg/ml) (g, h), LPS (100 ng/ml) (i, j) or Flagellin (100 ng/ml) (k, l) for 4 h and followed by 200 nM (5Z)-7-oxozeaeno. Cell death was measured by SytoxGreen, and the mean ± SEM from five biological replicates was shown (g, i, k). The levels of GSDMD, Caspase-1, Caspase-8, CC8, Caspase-3, CC3, RIPK1, and p-RIPK1(S166) were determined by immunoblotting (h, j, l).
Fig. 6
Fig. 6. RIPK1 kinase drives microbiota dysbiosis in the ileum of Tak1tamIEC-KO mice.
a Chao1 alpha-diversity from mice of the indicated genotypes at 3 dpi. Each dot represented one sample. The results were shown as mean ± SEM. An unpaired two-tailed t-test was performed. b Principal coordinate analysis (PCoA) of 16S sequencing of ileum fecal at 3 dpi were analysed with Bray-Curtis distances (p = 0.001, PERMANOVA by Adonis) on the taxonomic profile (at the ASV level). c Average relative abundance of the top 30 abundant genera of ileum fecal at 3 dpi of mice with the indicated genotypes. d Cluster heat map of average relative microbiota abundance at genus level in the ileum of the mice with indicated genotypes at 3 dpi (cut-off: Tak1fl/fl V.S. Tak1tamIEC-KO p ≤ 0.05). * indicated Tak1tamIEC-KO V.S. Tak1tamIEC-KO Ripk1D138N/D138N p ≤ 0.05. Z scores are shown. e Relative abundance of Enterococcus faecalis in ileum fecal of the mice with indicated genotypes at 3 dpi. Each dot represented one sample. The results were shown as mean ± SEM. An unpaired two-tailed t-test was performed. f Cluster heat map of AMP expression level in the ileum of the mice with indicated genotypes at 3 dpi (log2|fold change | ≥1, p ≤ 0.05). Z scores are shown. Each column represented one mouse. g Ileal IECs from the mice with indicated genotypes at 3 dpi were isolated and immunoblotting for TAK1, RIPK1, Caspase-8, CC8, Caspase-3, CC3, p-ERK, ERK, p-P65, and P65.
Fig. 7
Fig. 7. Cooperative role of RIPK1 kinase and TRADD in the evolution of colon microbiota dysbiosis.
a, c Principal coordinate analysis (PCoA) of 16S sequencing of colon fecal at 3 dpi (a) or 7 dpi (c) were analysis with Bray-Curtis distances (p = 0.001, PERMANOVA by Adonis) on the taxonomic profile (at the ASV level). b, d Average relative abundance of the top 30 abundant genera of colon fecal at 3 dpi (b) or 7 dpi (d) of the mice with indicated genotypes. e Cluster heat map of average relative microbiota abundance at genus level in colon of the mice with indicated genotypes at 3 dpi and 7 dpi (including the genus fit either Tak1fl/fl V.S. Tak1tamIEC-KO p ≤ 0.05 or Tak1fl/fl Ripk1D138N/D138N V.S. Tak1tamIEC-KO Ripk1D138N/D138N p ≤ 0.05). Z scores are shown. * on Tak1tamIEC-KO (3 dpi) indicated Tak1fl/fl V.S. Tak1tamIEC-KO p ≤ 0.05. * on Tak1tamIEC-KO Ripk1D138N/D138N (3 dpi) indicated Tak1tamIEC-KO V.S. Tak1tamIEC-KO Ripk1D138N/D138N p ≤ 0.05. * on Tak1tamIEC-KO Ripk1D138N/D138N (7 dpi) indicated Tak1fl/fl Ripk1D138N/D138N V.S. Tak1tamIEC-KO Ripk1D138N/D138N p ≤ 0.05. * on Tak1tamIEC-KO Ripk1D138N/D138N TraddtamIEC-KO (7 dpi) indicated Tak1tamIEC-KO Ripk1D138N/D138N V.S. Tak1tamIEC-KO Ripk1D138N/D138N TraddtamIEC-KO p ≤ 0.05. f Relative abundance of Escherichia coli in colon fecal of the mice with indicated genotypes at 7 dpi. Each dot represented one sample. The results were shown as mean ± SEM. An unpaired two-tailed t-test was performed. g, h Cluster heat map of AMP expression level in the colon of the mice with indicated genotypes at 3 dpi (g) or 7 dpi (h) (log2|fold change | ≥1, p ≤ 0.05). Z scores are shown. Each column represented one mouse. i, j Colonic IECs from the mice with indicated genotypes at 3 dpi (i) or 7 dpi (j) were isolated and immunoblotting for TAK1, RIPK1, CC8, CC3, p-ERK, p-P65, p-JNK, and p-P38. k, l Chao1 alpha-diversity from the mice with indicated genotypes at 3 dpi (k) or 7 dpi (l). Each dot represented one sample. The results were shown as mean ± SEM. An unpaired two-tailed t-test was performed.

References

    1. Honap, S. et al. Navigating the complexities of drug development for inflammatory bowel disease. Nat. Rev. Drug Discov.23, 546–562 (2024). - PubMed
    1. Peterson, L. W. & Artis, D. Intestinal epithelial cells: regulators of barrier function and immune homeostasis. Nat. Rev. Immunol.14, 141–153 (2014). - PubMed
    1. Neurath, M. F. Strategies for targeting cytokines in inflammatory bowel disease. Nat. Rev. Immunol.24, 559–576 (2024). - PubMed
    1. Danese, S. & Fiocchi, C. Ulcerative colitis. N. Engl. J. Med.365, 1713–1725 (2011). - PubMed
    1. Holbrook, J. et al. Tumour necrosis factor signalling in health and disease. F1000Res. 8, F1000 (2019). - PMC - PubMed

MeSH terms

Substances

LinkOut - more resources