. 2025 Feb 22;8(1):286.
doi: 10.1038/s42003-025-07735-3.

EZH2-mediated macrophage-to-myofibroblast transition contributes to calcium oxalate crystal-induced kidney fibrosis

Affiliations

EZH2-mediated macrophage-to-myofibroblast transition contributes to calcium oxalate crystal-induced kidney fibrosis

Yuqi Xia et al. Commun Biol. .

Abstract

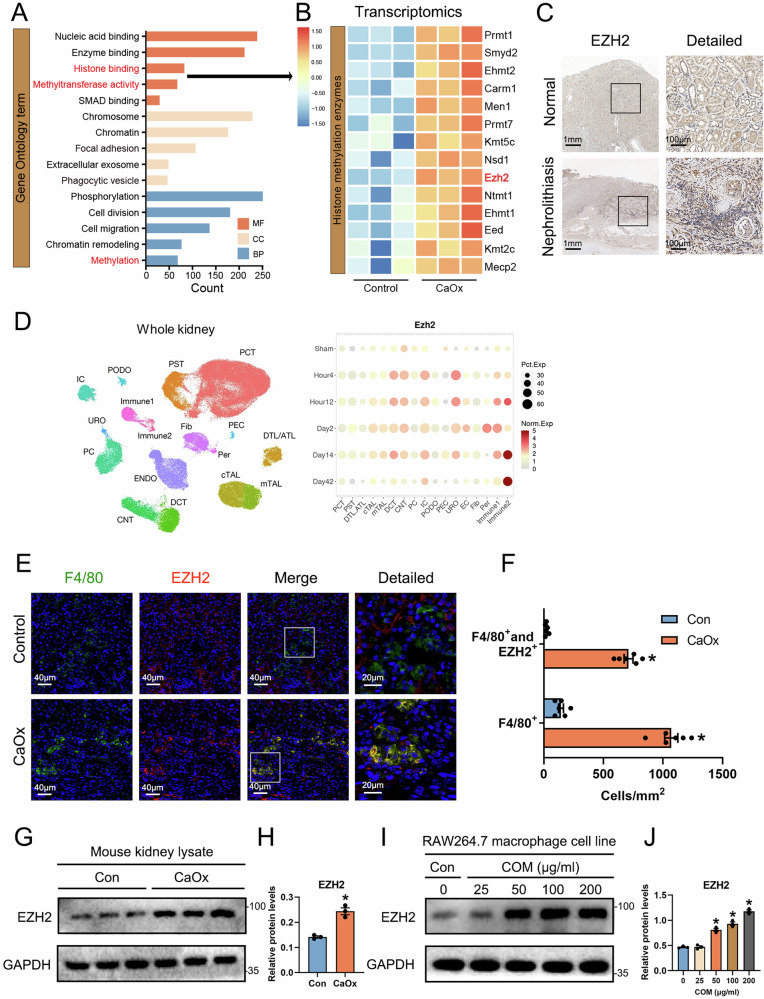
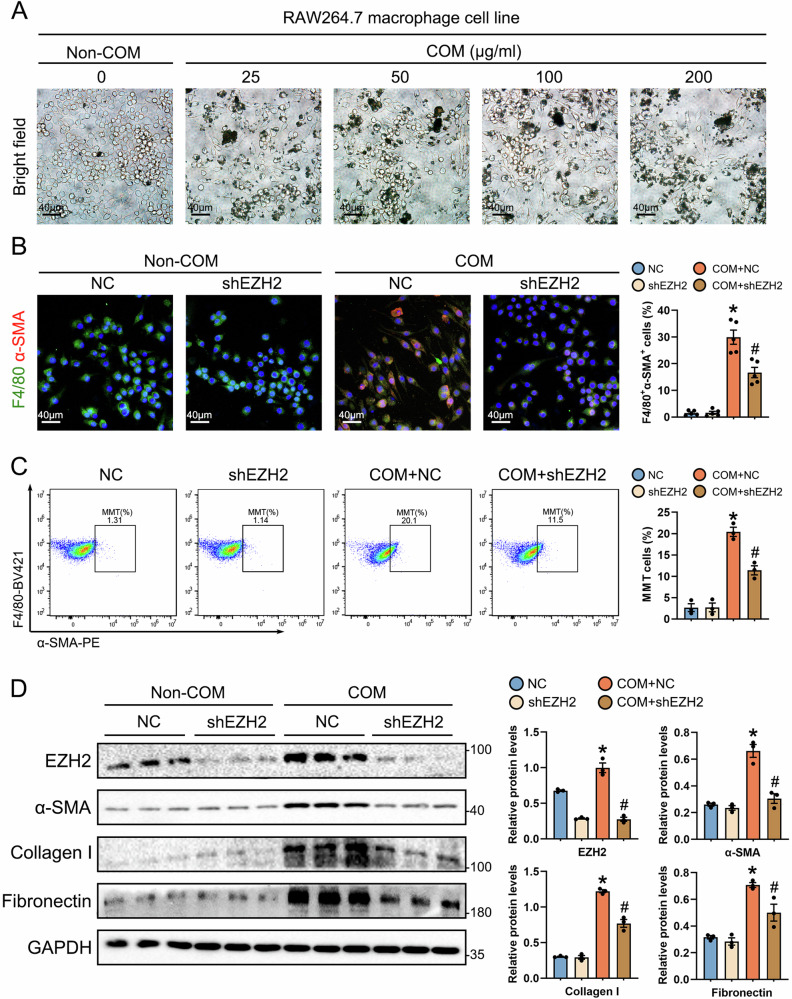
Long-term nephrocalcinosis leads to kidney injury, fibrosis, and even chronic kidney disease (CKD). Macrophage-to-myofibroblast transition (MMT) has been identified as a new mechanism in CKD, however, the effect of MMT in calcium oxalate (CaOx)-induced kidney fibrosis remains unclear. In this study, abundant MMT cells are identified by immunofluorescence (IF) and flow cytometry in kidney tissues of patients with CaOx-related CKD, a male mouse model, and CaOx-treated macrophages. Clodronate liposome (CLO)-mediated macrophage depletion attenuates fibrosis in male nephrocalcinosis mice. Transcriptomic sequencing reveals that histone methyltransferase (HMTs), EZH2, is highly expressed in nephrocalcinosis. Ezh2 inducible knock-out or inhibition by GSK-126 attenuates MMT and renal fibrosis. Mechanistically, ChIP and transcriptomic sequencing show that EZH2 inhibition reduces the enrichment of H3K27me3 on the Dusp23 gene promoter and elevates Dusp23 expression. The Co-IP and molecular docking analysis shows that DUSP23 mediates the dephosphorylation of pSMAD3 (Ser423/425). Thus, our study found that EZH2 promotes kidney fibrosis by meditating MMT via the DUSP23/SMAD3 pathway in nephrocalcinosis.


Conflict of interest statement

Competing interests: The authors declare no competing interests.

Figures

Fig. 1
Fig. 1. Identification of MMT in patients with nephrocalcinosis-related CKD.
The histopathological images showed significant kidney atrophy, renal tubular injury, ECM deposition, and immune cell infiltration in gross observation (A), HE staining (B), and Sirus rad staining (C) from patients with nephrocalcinosis-related CKD. D Two-color immunofluorescence identifies MMT cells that coexpress macrophage (CD68, green) and myofibroblast (a-SMA, red) markers in nephrocalcinosis patients. Nuclei were stained with DAPI in blue. E Quantifying the number of CD68+ cells, a-SMA+ cells, and CD68+ a-SMA+ cells (experiments with n = 6 biologically independent samples). F Correlation analysis of MMT cell populations and glomerular filtration rate in patients with nephrocalcinosis-related CKD (n = 6). G Three-color immunofluorescence identifies cells coexpressing CD68 (green), a-SMA (red), and collagen I (pink) in patients. Data are presented as the mean ± SEM. *P < 0.05 versus control group. Person correlation and two-tailed Student’s t test were performed.
Fig. 2
Fig. 2. Identification of MMT in CaOx nephrocalcinosis mice.
A Schematic diagram of the experimental procedure, Created in BioRender. Yuqi, X. (2025) https://BioRender.com/z03c224. B The deposited crystals were identified to be CaOx by infrared spectroscopy. C Renal function, body weight and hydroxyproline content were measured on day 12 of modeling (n = 6). D Representative pictures of HE, Von Kossal, and Masson staining (magnification, ×400). E Quantifying kidney tubular injury score, CaOx crystal deposition area, and collagen deposition area (n = 6). F Transcriptomic sequencing in kidney tissues between CaOx nephrocalcinosis mice and the control group (n = 3). G Two-color immunofluorescence identifies MMT cells that coexpress macrophage (CD68, green) and myofibroblast (a-SMA, red) markers in nephrocalcinosis mice. H Quantification of the number of CD68+ cells, a-SMA+ cells, and CD68+ a-SMA+ cells (n = 6). Data are presented as the mean ± SEM. *P < 0.05 versus control group. P values were determined by the two-tailed Student’s t test.
Fig. 3
Fig. 3. Macrophage depletion attenuates CaOx crystal-induced kidney fibrosis.
A Renal function and body weight were measured on day 12 of modeling (n = 6). B Schematic diagram of the experimental procedure, Created in BioRender. Yuqi, X. (2025) https://BioRender.com/d40q387. C Representative pictures of HE, Masson, and immunohistochemical staining (magnification, ×400). D Quantifying hydroxyproline content, F4/80+ cells, collagen deposition area and α-SMA positive area (n = 6). Data are presented as the mean ± SEM. *p < 0.05 versus control group; #p < 0.05 versus CaOx nephrocalcinosis group. P values were determined by the two-tailed Student’s t test.
Fig. 4
Fig. 4. EZH2 is markedly elevated in CaOx crystal-induced kidney fibrosis.
A GO enrichment analysis of differentially expressed genes between normal and nephrocalcinosis mice. B Heatmap of histone methylation enzyme-related gene expression (n = 3). C Representative pictures of EZH2 immunohistochemistry staining in patients with nephrocalcinosis-related CKD. D The gene activity of Ezh2 in different renal cell types from AKI mouse kidney (from snATAC-Seq database; http://humphreyslab.com/SingleCell/). E Two-color immunofluorescence identifies EZH2 (red) was increased in F4/80+ (green) macrophages during nephrocalcinosis. F Quantifying the number of F4/80+ and F4/80+ EZH2+ cells (n = 6). Expression of EZH2 was detected by immunoblotting in nephrocalcinosis mice (G, H) and calcium oxalate monohydrate (COM)-treated macrophages (I, J) (n = 3). Data are presented as the mean ± SEM. *p < 0.05 versus control group. P values were determined by the two-tailed Student’s t test.
Fig. 5
Fig. 5. Ezh2 deletion decreases MMT cells and attenuates CaOx crystal-induced kidney fibrosis.
A Renal function and body weight were measured on day 12 of modeling (n = 6). Representative pictures of HE staining, Sirus rad staining (B), Von Kossal staining (C), α-SMA and Collagen I immunohistochemistry staining (D) (n = 6). E Two-color immunofluorescence identifies MMT cells (n = 6). F EZH2, Collagen I, α-SMA and fibronectin were expressed by immunoblotting in nephrocalcinosis mice (n = 3). Data are presented as the mean ± SEM. *p < 0.05 versus Ezh2fl/fl group; #p < 0.05 versus CaOx Ezh2fl/fl group. P values were determined by the two-tailed Student’s t test.
Fig. 6
Fig. 6. Macrophage isolation confirmed the direct effect of EZH2 in CaOx crystal-induced MMT in kidney.
A Schematic diagram of macrophage isolation, Created in BioRender. Yuqi, X. (2025) https://BioRender.com/a33h147. B Gating strategy of flow cytometry. The expression of α-SMA in isolated macrophages was detected. C Expression of EZH2 was detected by immunoblotting (n = 3). D Expression of Collagen I and fibronectin was detected by immunoblotting (n = 3). Data are presented as the mean ± SEM. *p < 0.05 versus EZH2fl/fl group; #p < 0.05 versus CaOx EZH2fl/fl group. P values were determined by the two-tailed Student’s t test.
Fig. 7
Fig. 7. Knockdown of Ezh2 decreases CaOx crystal-induced MMT cells in Vitro.
A Representative pictures of COM-treated macrophages. B Two-color immunofluorescence identifies MMT cells that coexpress macrophage (F4/80, green) and myofibroblast (a-SMA, red) markers in the RAW264.7 cell line (n = 5). C The proportion of MMT cells in the COM-treated macrophages was detected by flow cytometry (n = 3). D EZH2, Collagen I, α-SMA and fibronectin were expressed by immunoblotting in the RAW264.7 cell line (n = 3). Data are presented as the mean ± SEM. *p < 0.05 versus shNC group; #p < 0.05 versus COM-treated shNC group. P values were determined by the two-tailed Student’s t test.
Fig. 8
Fig. 8. EZH2 modulates MMT by inhibiting the expression of DUSP23 through epigenetic modification and DUSP23-meditated dephosphorylation of SMAD3 at Ser423/425, which attenuates MMT.
A Top 10 differentially expressed genes between Ezh2.iKO mice and WT mice in response to CaOx stimulation (n = 3). B Two-color immunofluorescence identifies DUSP23 (red) was decreased in F4/80+(green) macrophages during nephrocalcinosis and upregulated after Ezh2 deletion. C The H3K27me3 binding site is predicted on the promoter region of the Dusp23 gene by the ChIP-Seq database. ChIP assay confirmed that COM treatment significantly enhanced the binding of EZH2 and H3K27me3 on the predicted promoter region in RAW264.7 cells (n = 3). D DUSP23, H3K27me3, and total H3 were expressed by immunoblotting in the RAW264.7 cell line (n = 3). E The proportion of MMT cells in the Dusp23 overexpression macrophages was detected by flow cytometry (n = 3). F The protein sequences of human and mouse DUSP23 or SMAD3 were analyzed by BLAST. G The molecular docking analysis in humans was conducted to predict the potential amino acid binding sites between DUSP23 and SMAD3. H Co-IP assay in COM-treated RAW264.7 macrophages confirmed the interaction of SMAD3 and DUSP23. I Expression of pSMAD3 (Ser423/425), pSMAD3 (T179), and total SAMD3 was detected by immunoblotting in macrophages (n = 3). J Expression of DUSP23, pSMAD3 (Ser423/425), SMAD3, Collagen I, and α-SMA was detected by immunoblotting in macrophages (n = 3). Data are presented as the mean ± SEM. *p < 0.05 versus control group; #p < 0.05 versus model group. P values were determined by the two-tailed Student’s t test.
Fig. 9
Fig. 9. Pharmacological inhibition of EZH2 by GSK-126 ameliorates MMT-meditated kidney fibrosis in nephrocalcinosis.
A Renal function and body weight were measured on day 12 of modeling (n = 5). Representative pictures of HE staining, Sirus rad staining (B), and Von Kossal staining (C) (n = 5). D Two-color immunofluorescence identifies MMT cells in nephrocalcinosis mice (n = 5). E EZH2, Collagen I, α-SMA and fibronectin were expressed by immunoblotting in COM-treated macrophages (n = 3). F Two-color immunofluorescence identifies MMT cells in the RAW264.7 cell line (n = 5). G EZH2, Collagen I, α-SMA and fibronectin were expressed by immunoblotting in nephrocalcinosis mice (n = 3). Data are presented as the mean ± SEM. *p < 0.05 versus control group; #p < 0.05 versus CaOx nephrocalcinosis group. P values were determined by the two-tailed Student’s t test.
None

References

    1. Zeng, G. et al. Prevalence of kidney stones in China: an ultrasonography based cross-sectional study. BJU Int.120, 109–116 (2017). - PubMed
    1. Thongprayoon, C., Krambeck, A. E. & Rule, A. D. Determining the true burden of kidney stone disease. Nat. Rev. Nephrol.16, 736–746 (2020). - PubMed
    1. Khan, S. R., Canales, B. K. & Dominguez-Gutierrez, P. R. Randall’s plaque and calcium oxalate stone formation: role for immunity and inflammation. Nat. Rev. Nephrol.17, 417–433 (2021). - PubMed
    1. Venkatachalam, M. A., Weinberg, J. M., Kriz, W. & Bidani, A. K. Failed tubule recovery, AKI-CKD transition, and kidney disease progression. J. Am. Soc. Nephrol.26, 1765–1776 (2015). - PMC - PubMed
    1. Rule, A. D. et al. Kidney stones and the risk for chronic kidney disease. Clin. J. Am. Soc. Nephrol.4, 804–811 (2009). - PMC - PubMed

MeSH terms

LinkOut - more resources