. 2025 Feb 22;8(1):284.
doi: 10.1038/s42003-025-07589-9.

Emergence of inflammatory fibroblasts with aging in Hermansky-Pudlak syndrome associated pulmonary fibrosis

Affiliations

Emergence of inflammatory fibroblasts with aging in Hermansky-Pudlak syndrome associated pulmonary fibrosis

Brandon J H Banaschewski et al. Commun Biol. .

Abstract

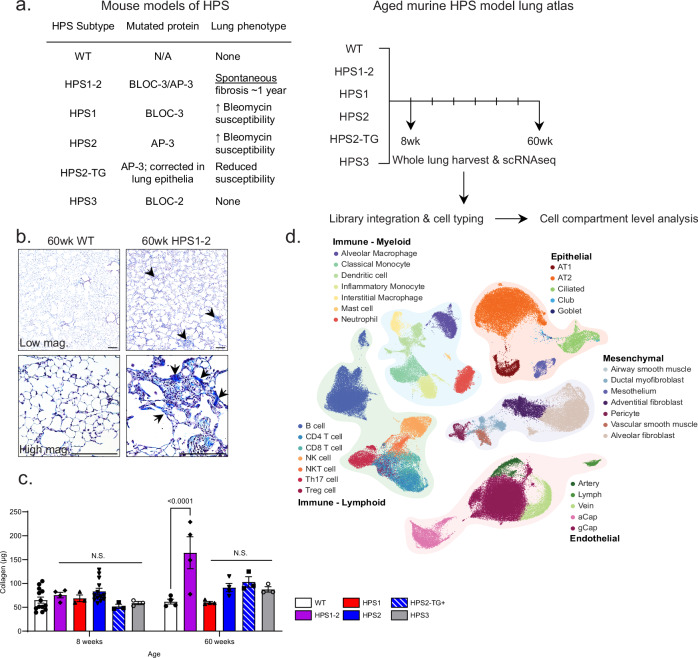
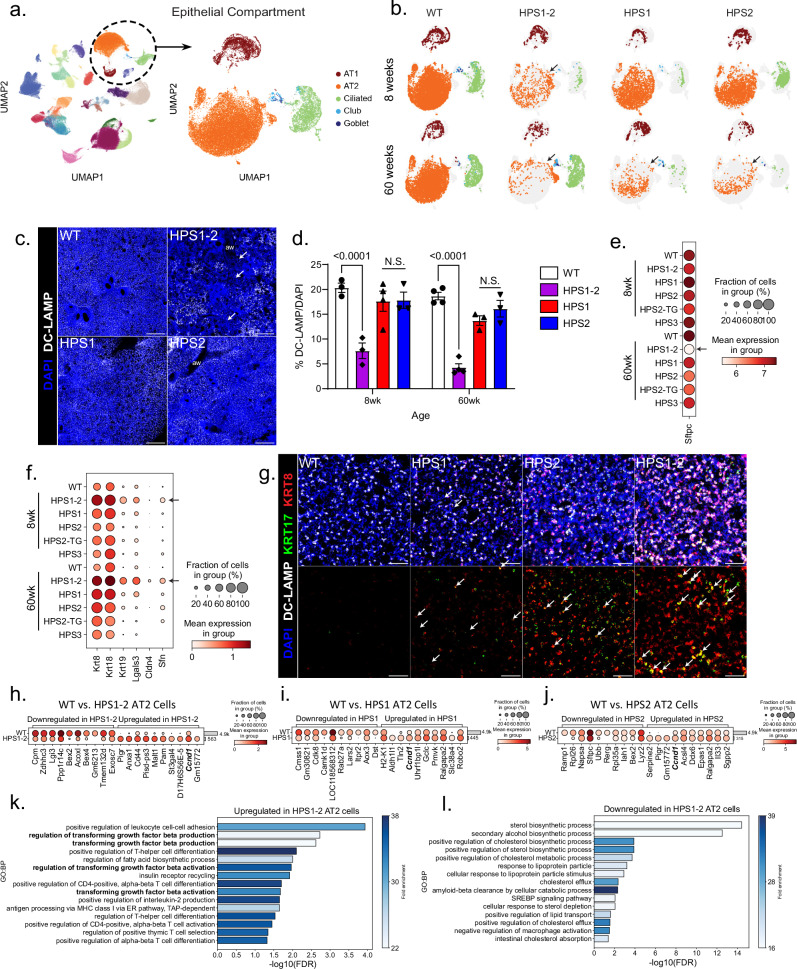
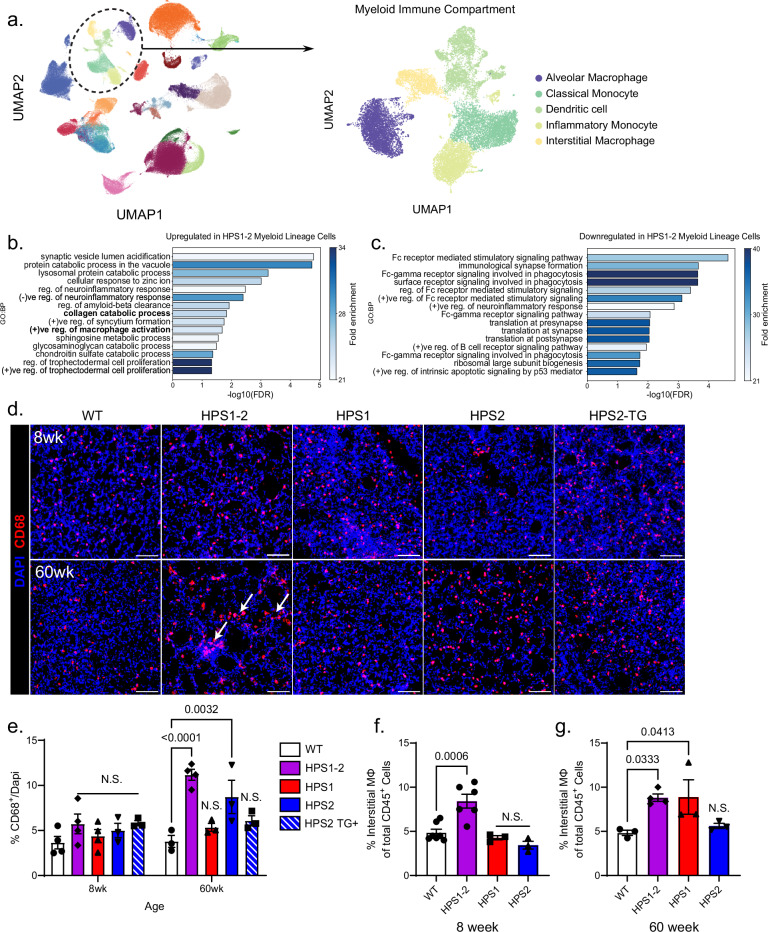
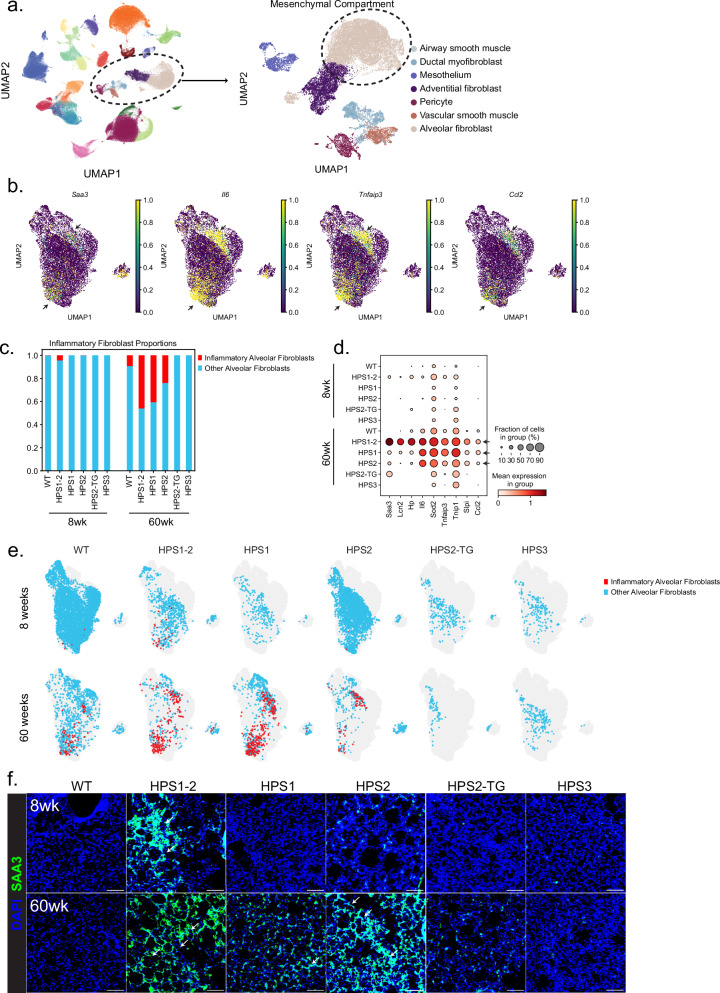
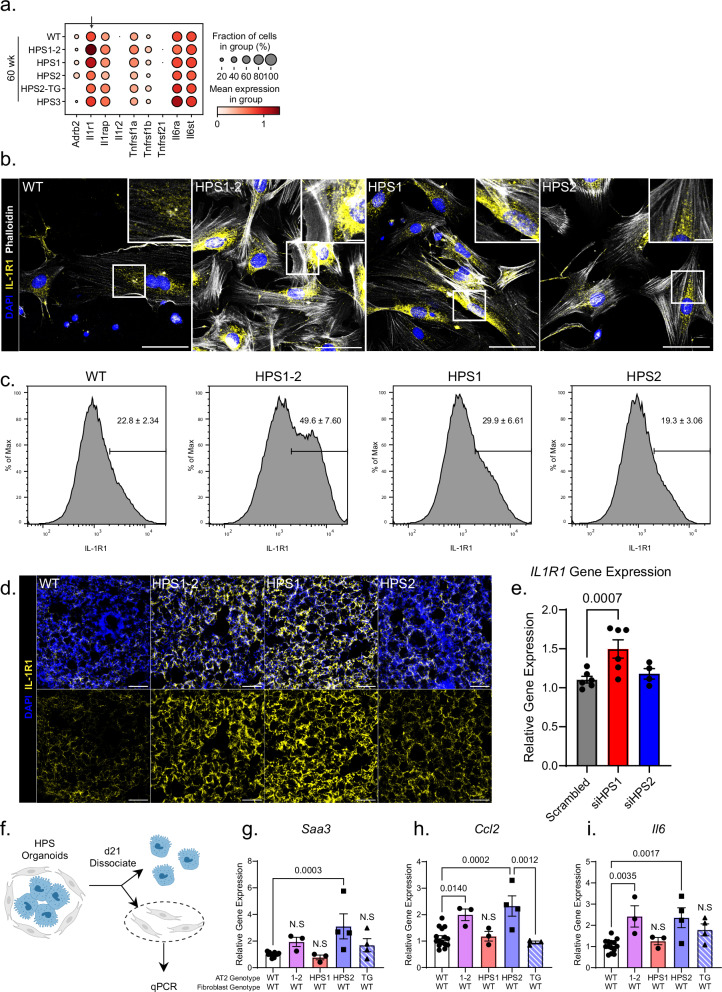
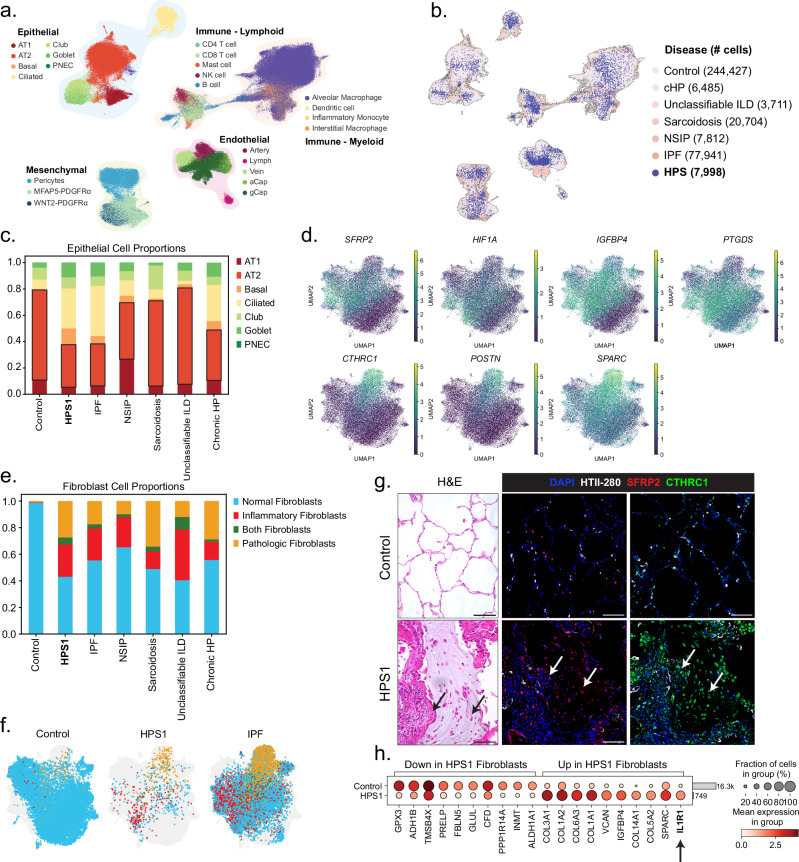
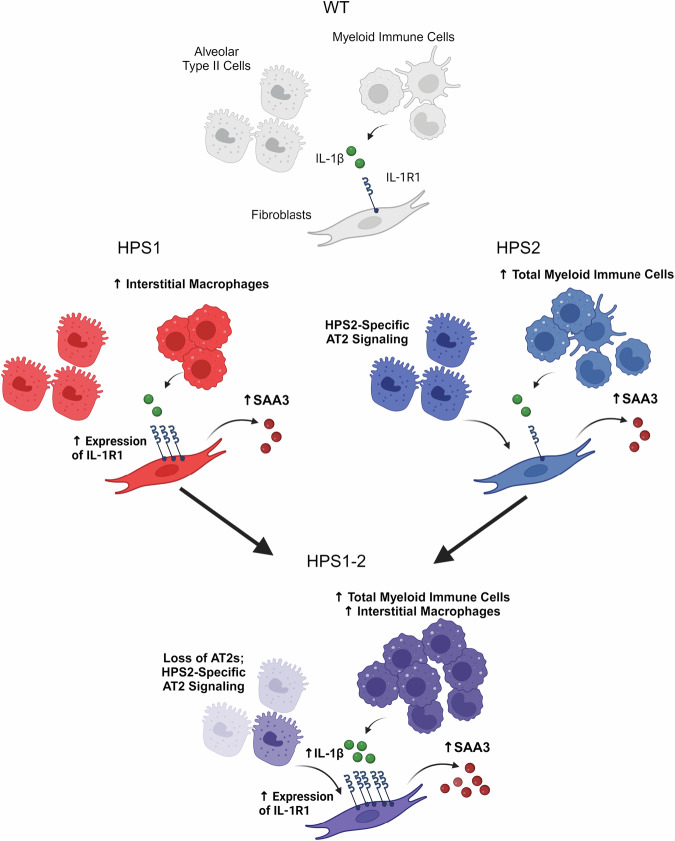
The longitudinal cellular interactions that drive pulmonary fibrosis are not well understood. To investigate the disease underpinnings associated with fibrosis onset and progression, we generated a scRNA-seq atlas of lungs from young and aged mouse models of multiple subtypes of Hermansky-Pudlak syndrome (HPS), a collection of rare autosomal recessive diseases associated with albinism, platelet dysfunction, and pulmonary fibrosis. We have identified an age-dependent increase in SAA3+ inflammatory lung fibroblasts in HPS mice, including in double-mutant HPS1-2 mice which develop spontaneous fibrosis. HPS1 fibroblasts show increased expression of IL-1R1, whereas alveolar type II epithelial cells from HPS2 mice induce the inflammatory gene signature in co-cultured fibroblasts. scRNA-seq of lung tissue from three HPS1 patients similarly shows the presence of inflammatory fibroblasts and increased IL1R1 expression on fibroblasts. These data posit complex interactions between dysfunctional epithelial cells, inflammatory fibroblasts, and recruited immune cells, suggesting potential opportunities for mitigation of the fibrotic cascade.


Conflict of interest statement

Competing interests: B.J.B. reports equity in MannKind Corporation. JLT acknowledges grants to the institution from the National Institute of Health, AstraZeneca, Boehringer Ingelheim, and Care Dx; and advisory board participation for Avalyn and Sanofi. E.C. reports consulting fees from CSL Behring and United Therapeutics, and meeting travel support from Pulmocide Ltd. E.C. also reports board participation for the International Society of Heart and Lung Transplantation, regional representative role for the UNOS Lung Committee, and as a consultant for device group for the FDA. J.A.K. reports grants from Boehringer Ingelheim and scientific advisory board membership at APIE and ARDA. L.R.Y. reports scientific advisory board participation for Boehringer Ingelheim and Sanofi and royalties from Wolters Kluwer for UpToDate authorship. All conflicts of interest reported are outside the scope of the submitted work.

Figures

Fig. 1
Fig. 1. Utilizing scRNA-seq to identify mechanisms of age-related fibrosis in HPS mice.
a Overview of experimental mouse models used in this study and a schematic of scRNA-seq experimental design. All HPS models are global knockouts or loss of function mutations, except HPS2-TG, which denotes transgenic HPS2 mice with lung epithelial-specific correction. b Masson’s Trichrome staining of microtome cut lung sections of 60-week-old WT and HPS1-2 mice. Scale bar = 200 µm. Imaging experiments were performed three times independently. Arrows indicate regions of increased collagen deposition. c Total lung collagen content from the lungs of naïve HPS mice, ages 8- and 60 weeks old. Data are presented as mean ± SEM and were obtained from n = 13 each for 8wk WT and 8wk HPS2 mice, n = 4 each for 8wk HPS1-2, 60wk WT, 60wk HPS1-2, 60wk HPS1, and 60wk HPS2 mice, and n = 3 each for 8wk HPS1, 8wk HPS2-TG, 8wk HPS3, 60wk HPS2-TG, and 60wk HPS3 mice. P-values were determined by two-way ANOVA followed by Dunnett’s post hoc analysis. N.S. = not significant. scRNA-seq. d UMAP of all cells recovered from scRNA-seq experiments.
Fig. 2
Fig. 2. Alveolar epithelial cell phenotypes in HPS mouse models with aging.
a UMAP of epithelial compartment following isolation and re-projection in 8- and 60-week-old HPS mice. b Split UMAP plots of epithelial cell compartments in WT, HPS1, HPS2, and HPS1-2 mice, separated by age and genotype. Arrows indicate the reduction of alveolar type II epithelial cells (AT2 cells) recovered in scRNA-seq experiments. c Immunostaining of DC-LAMP+ AT2 cells in 60-week-old WT, HPS1-2, HPS1, and HPS2 mice from precision cut lung sections (PCLS). Scale bar = 1 mm. aw = airways. d Quantification of DC-LAMP+ cells as a percentage of total DAPI+ cells. Data are presented as mean ± SEM and were obtained from n = 3 8wk WT, 8wk HPS1-2, 8wk HPS2, 60wk HPS1, and 60wk HPS2 mice, and n = 4 8wk HPS1, 60wk WT, and 60wk HPS1-2 mice. For each biological replicate, a minimum of three images were taken of lung parenchyma, and the percentage of DC-LAMP+ cells over total DAPI+ cells was calculated as the average of those images. P-values were obtained by two-way ANOVA with Dunnett’s post hoc analysis. N.S. = not significant. e Dot plot of Sftpc expression split by age and genotype. Arrow indicates reduced expression of Sftpc in 60wk HPS1-2 AT2 cells. f Dot plot of expression of transitional AT2 cell marker genes split by age and genotype. Arrows indicate increased expression of transitional AT2 cell marker genes in 8- and 60wk HPS1-2 AT2 cells. g Immunostaining of DC-LAMP+/KRT17+/KRT8+ aberrant transitional AT2 cells in 50 µm thick PCLS sections of 60-week-old HPS mouse models. In HPS1-2, regions of AT2 cell hyperplasia were intentionally imaged. Arrows indicate DC-LAMP+ cells that co-express KRT17 and KRT8. Top 20 differentially expressed genes (DEGs) between (h) 60-week-old WT and HPS1-2 AT2 cells, (i) 60-week-old WT and HPS1 AT2 cells, and (j) 60-week-old WT and HPS2 AT2 cells. k Over-representation analysis of biological processes that are upregulated in 60-week-old HPS1-2 AT2 cells compared to age-matched WT controls. l Over-representation analysis of biological processes that are downregulated in 60-week-old HPS1-2 AT2 cells compared to age-matched WT controls.
Fig. 3
Fig. 3. Increased myeloid immune cells and interstitial macrophage populations in aged HPS mice.
a UMAP of myeloid lineage immune compartment following isolation and re-projection in 8- and 60-week-old HPS mice, focused on macrophages, dendritic cells, and monocytes. b Over representation analysis of biological processes that are upregulated in myeloid cells from 60-week-old HPS1-2 mice compared to age matched WT controls. c Over representation analysis of biological processes that are downregulated in myeloid cells from 60-week-old HPS1-2 compared to age matched WT controls. d Representative immunostaining of CD68+ cells in HPS mice, by age and genotype. Imaging experiments were performed on 50 µm thick PCLS from at least three independent biological replicates per age and genotype. Arrows indicate regions of increased CD68+ cell clustering. Scale bar = 100 µm. e Percentage of CD68+ cells per DAPI+ cells. Data are presented as mean ± SEM and were obtained from n = 3 8wk HPS2, 8wk HPS2-TG, 60wk WT, 60wk HPS1, 60wk HPS2, and 60wk HPS2-TG mice, and n = 4 8wk WT, 8wk HPS1-2, 8wk HPS1, and 60wk HPS1-2 mice. For each biological replicate, a minimum of three images were taken of lung parenchyma, and the percentage of CD68+ cells was calculated as the average of those images. P values were obtained by two-way ANOVA with Dunnett’s post hoc analysis. f Proportion of interstitial macrophages (MΦ) (CD45+CD11b+MHCII+CD64+CD24-) in 8-week-old mice by flow cytometry, as a percentage of total CD45+ cells. Data are presented as mean ± SEM and were obtained from n = 3 each for HPS1 and HPS2 mice, n = 6 HPS1-2 mice, and n = 7 WT mice. g Proportion of interstitial macrophages (MΦ) in 60-week-old mice by flow cytometry, as a percentage of total CD45+ cells. Data are presented as mean ± SEM and were obtained from n = 3 each for WT, HPS1, and HPS2 mice, and n = 4 HPS1-2 mice. P values were obtained by one-way ANOVA with Dunnett’s post hoc analysis. N.S. = not significant.
Fig. 4
Fig. 4. Age-dependent enrichment of inflammatory lung fibroblasts in HPS models associated with fibrosis.
a UMAP of mesenchymal compartment following isolation and re-projection in 8- and 60-week-old HPS mice. b UMAPs of select inflammatory fibroblast marker genes within alveolar fibroblasts used to identify inflammatory fibroblasts. c Proportion of alveolar fibroblasts that were identified as inflammatory fibroblasts, separated by age and genotype. d Dot plot of expression of inflammatory fibroblast marker genes in alveolar fibroblasts split by age and genotype. Arrows indicate genotypes with increased expression of inflammatory fibroblast-associated genes. e Split UMAP of inflammatory fibroblast subpopulations in alveolar fibroblasts across age and genotype. f Representative immunofluorescence images from 50 µm thick PCLS showing the enrichment of SAA3+ cells in lungs of HPS1, HPS2, and HPS1-2 mice compared to age-matched WT controls, HPS3 mice, and HPS2-TG mice. Imaging experiments were performed on three independent biological replicates per age and genotype. Arrows indicate regions of increased SAA3+ expression. Scale bar = 100 µm.
Fig. 5
Fig. 5. Genotype-specific mechanisms associated with inflammatory fibroblast cell state in HPS mice.
a Dot plot of inflammatory receptor gene expression in 60-week-old alveolar fibroblasts split by genotype. Arrow indicates Il1r1, which shows increased expression in 60-week-old HPS1-2 and HPS1 fibroblasts relative to age-matched WT controls. b Representative immunocytochemistry images of IL-1R1 and phalloidin in primary PDGFRα+ fibroblasts from 60-week-old mice. Imaging experiments were performed on three independent biological replicates per genotype. Regions within the white square are magnified in the image inset. Scale bars = 50 µm (wide) or 10 µm (inset). c Cell surface expression of IL-1R1 on PDGFRα+ fibroblasts from 60-week-old mice determined by flow cytometry. Data are presented as the cumulative cell surface expression of IL-1R1 from four WT mice, five HPS1 mice, three HPS2 mice, and five HPS1-2 mice. Mean ± SEM are presented in the upper right corner of each plot. d Representative immunostaining from 50 µm PCLS showing increased expression of IL-1R1 in 60-week-old HPS1-2 and HPS1 mice compared to age-matched WT controls. Scale bar = 100 µm. e Relative gene expression of IL1R1 in MRC5 fibroblasts following 48 h knockdown experiment. Data are presented as mean ± SEM and were obtained from n = 6 replicates for Scramble control and HPS1 knockdown (denoted siHPS1), and n = 4 replicates for AP3B1 knockdown (denoted siHPS2). P-values were determined by one-way ANOVA followed by Sidak’s multiple comparisons post-hoc analysis. f Experimental outline for (gi). Relative gene expression of (g) Saa3, (h) Ccl2, and (i) Il6 in WT fibroblasts cultured for 21 days with WT, HPS1-2, HPS1, HPS2, or HPS2-TG AT2 cells in distal lung organoid model. Data are presented as mean ± SEM and were obtained from n = 15 organoids containing WT AT2 cells, n = 3 organoids containing HPS1-2 and HPS1 AT2 cells, and n = 4 organoids containing HPS2 and HPS2-TG AT2 cells. For Ccl2 gene expression, n = 3 organoids containing HPS2-TG AT2 cells. For Il6 gene expression, n = 14 organoids containing WT AT2 cells. P values were determined by one-way ANOVA followed by Sidak's post-hoc analysis. N.S. = not significant. Figure (f) created with Biorender.com.
Fig. 6
Fig. 6. Human HPS1 fibrotic lung tissue demonstrates loss of AT2 cells and increased prevalence of inflammatory fibroblasts.
a UMAP of all cells, grouped by compartment, from HPS1 patient scRNA-seq dataset merged with publicly available control and ILD patient scRNA-seq datasets,,. b UMAP of cells recovered and number of cells recovered from three separate HPS1 patient lung tissues (blue) overlaid on control tissues and ILD atlas. c Cell type proportions within the epithelial compartment of human scRNA-seq atlas, separated by disease classification. NSIP = nonspecific interstitial pneumonia, Chronic HP = chronic hypersensitivity pneumonitis. d UMAP of select inflammatory fibroblast marker genes (top panel) and fibrotic fibroblast marker genes (bottom panel) within PDGFRα+ fibroblasts used to identify each fibroblast subtype, respectively. e Proportion of PDGFRα+ fibroblasts that were classified as either normal, inflammatory, fibrotic, or both inflammatory and fibrotic in human scRNA-seq atlas by disease type. f Split UMAPs of control, HPS1, and IPF PDGFRα+ fibroblasts by identified fibroblast subtype. g Hematoxylin & eosin and immunofluorescent staining of tissue from control and HPS1 patient tissue. Sequential sections were used to localize SFRP2+ and CTHRC1+ fibroblasts in control and HPS1 patient tissue. Imaging experiment was performed on one HPS1 patient tissue and one control patient tissue. Arrows indicate similar regions across sequential tissue sections, which highlight the overlap of SFRP2+ cells with CTHRC1+ cells in fibrotic regions, as determined by H&E stain. Scale bars = 100 µm. h Dot plot of top 20 DEGs between control tissue and HPS1 patient PDGFRα+ fibroblasts. Gene expression of IL1R1 is bolded and highlighted with an arrow.
Fig. 7
Fig. 7. Models of inflammatory fibroblast emergence in HPS mouse models.
Based on the results from this study, we have identified an enrichment of inflammatory fibroblasts in 60-week-old HPS1-2 mice, that appears to coincide with numerous other observations, including increased expression of IL-1R1, increased AT2-signaling, and increases in myeloid cell accumulation, including in the proportion of interstitial macrophages. Using single mutant HPS mouse models to deconvolute the causes of these phenotypes, our results suggest that the mechanisms responsible for the emergence of these inflammatory fibroblasts are specific to the different HPS subtypes. In HPS1 mice, in addition to the observed increase in interstitial macrophages, distal lung fibroblasts have a significant increase in cell surface expression of IL-1R1, which could lead to an exaggerated response to IL-1β stimulation and a resultant hyperresponsive inflammatory response. HPS2 mice have increased total myeloid cell accumulation within the lungs, and an unknown AT2-derived factor appears to induce the inflammatory fibroblast phenotype, with a reduction of inflammatory fibroblasts occurring with epithelial-cell selective correction of Ap3b1 in the HPS2-TG model. HPS1-2 mice appear to possess features of both HPS1 (i.e., increased cell surface expression of IL-1R1) and HPS2 (i.e., AT2-derived inflammatory stimulation) mouse models and likely explains the increased severity of lung fibrosis observed in this model. Created with Biorender.com.

References

    1. Katzen, J. & Beers, M. F. Contributions of alveolar epithelial cell quality control to pulmonary fibrosis. J. Clin. Investig.130, 5088–5099 (2020). - PMC - PubMed
    1. Gieseck, R. L., Wilson, M. S. & Wynn, T. A. Type 2 immunity in tissue repair and fibrosis. Nat. Rev. Immunol.18, 62–76 (2018). - PubMed
    1. Wynn, T. A. & Vannella, K. M. Macrophages in tissue repair, regeneration, and fibrosis. Immunity44, 450–462 (2016). - PMC - PubMed
    1. Martinez, F. J. et al. Idiopathic pulmonary fibrosis. Nat. Rev. Dis. Prim. 3, 10.1038/nrdp.2017.74 (2017). - PubMed
    1. Vicary, G. W., Vergne, Y., Santiago-Cornier, A., Young, L. R. & Roman, J. Pulmonary fibrosis in Hermansky-Pudlak syndrome. Ann. Am. Thorac. Soc.13, 1839–1846 (2016). - PMC - PubMed

MeSH terms

LinkOut - more resources