. 2025 Feb 8;53(4):gkaf109.
doi: 10.1093/nar/gkaf109.

Transcription-replication conflicts drive R-loop-dependent nucleosome eviction and require DOT1L activity for transcription recovery

Affiliations

Transcription-replication conflicts drive R-loop-dependent nucleosome eviction and require DOT1L activity for transcription recovery

Marcel Werner et al. Nucleic Acids Res. .

Abstract

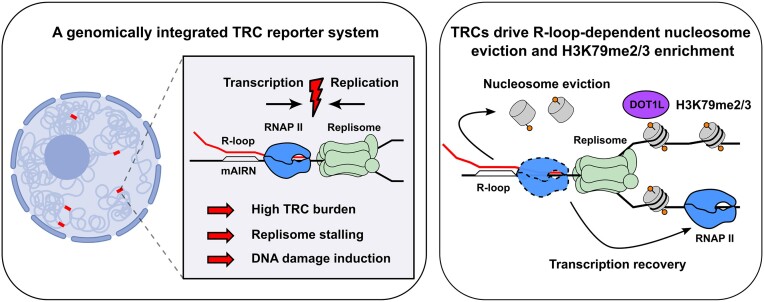
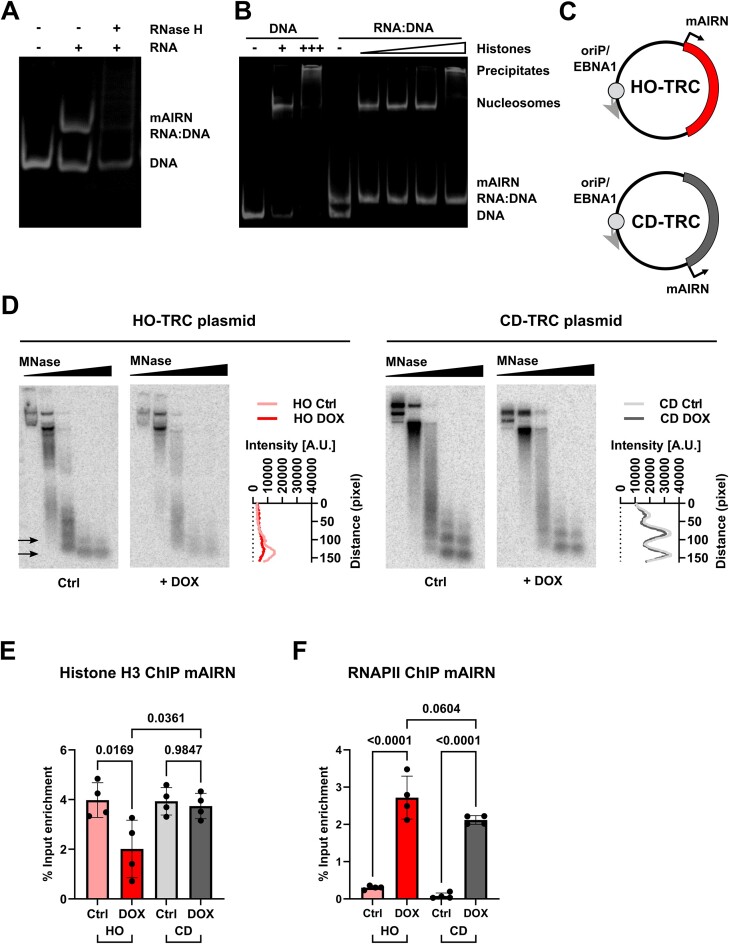
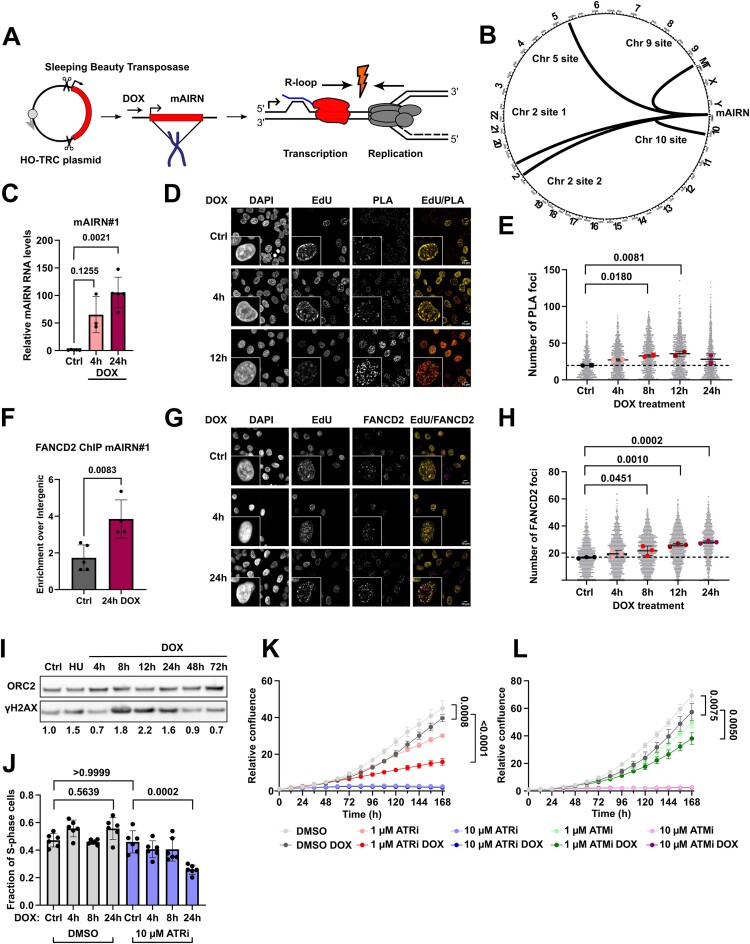
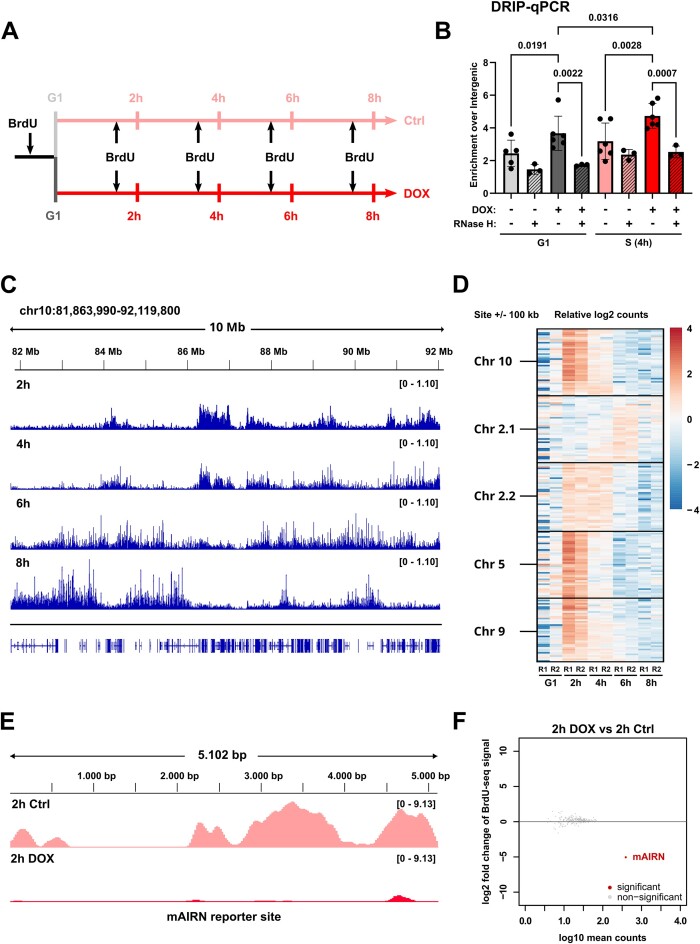
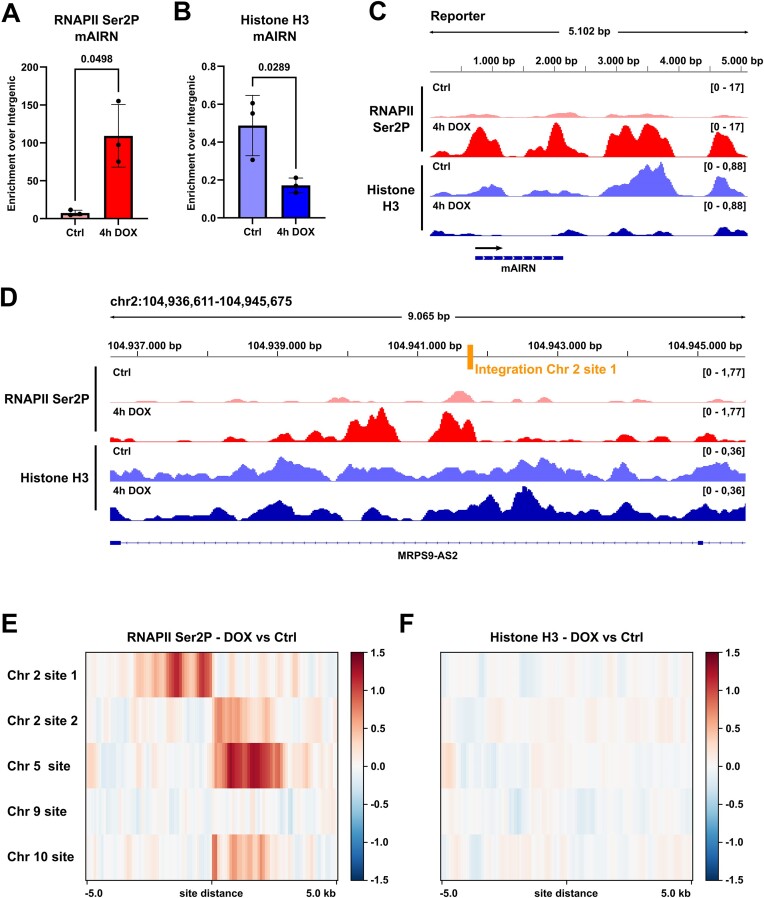
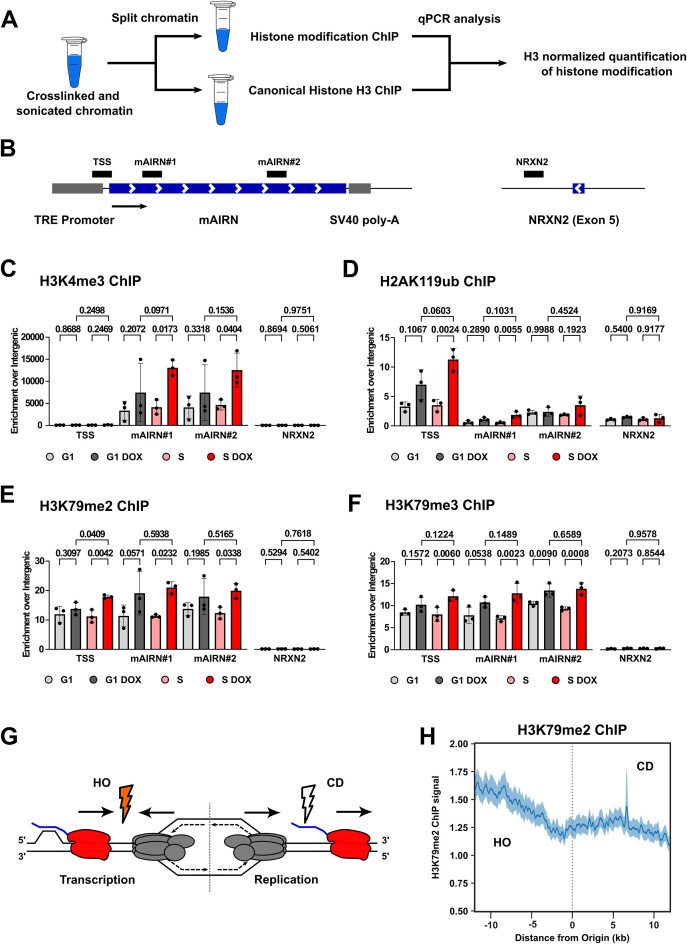
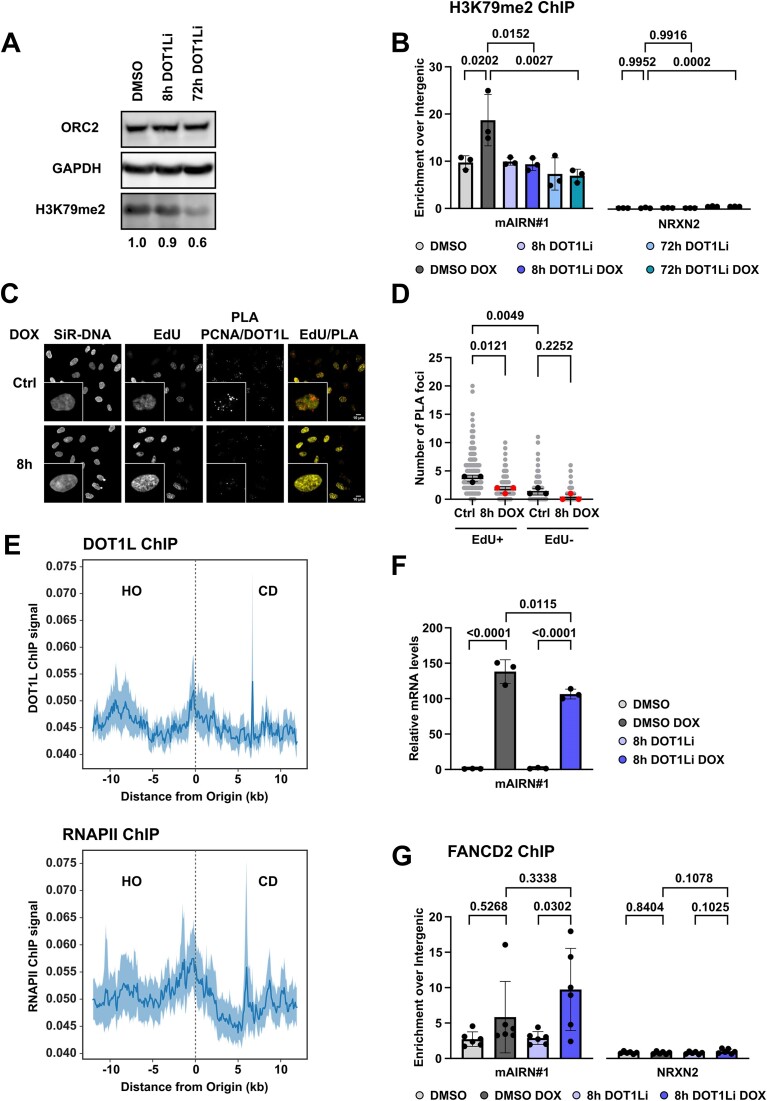
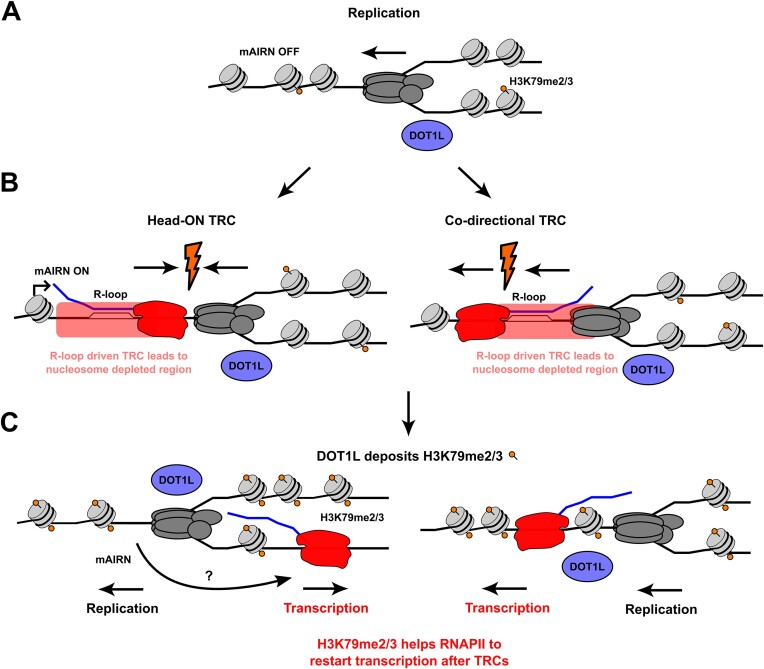
Progressing transcription and replication machineries profoundly impact their underlying chromatin template. Consequently, transcription-replication conflict (TRC) sites are vulnerable to chromatin and epigenome alterations, provoking genome instability. Here, we engineered an inducible TRC reporter system using a genome-integrated R-loop-prone sequence and characterized the dynamic changes of the local chromatin structure inflicted by TRCs, leading to reduced nucleosome occupancy and replication fork blockage. Strikingly, inducing a small number of TRCs on the genome results in a measurable global replication stress response. Furthermore, we find a TRC-dependent increase in H3K79 methylation specifically at the R-loop forming TRC site. Accordingly, inhibition of the H3K79 methyltransferase DOT1L leads to reduced transcriptional output and an exacerbated DNA damage response, suggesting that deposition of this mark is required for effective transcription recovery and resolution of TRCs. Our work shows the molecular dynamics and reveals a specific epigenetic modifier bookmarking TRC sites, relevant to cancer and other diseases.


Conflict of interest statement

None declared.

Figures

Graphical Abstract
Graphical Abstract
Figure 1.
Figure 1.
R–loop structures are incompatible with nucleosome formation in vitro and at an episomal HO-TRC reporter system in vivo. (A) Native polyacrylamide gel (6%) showing the reconstituted RNA:DNA hybrids (lane 2) compared to DNA alone (lane 1). Reconstituted RNA:DNA hybrids were treated with RNase H (5 U RNaseH, 30 min at 37°C) to indicate the specificity of the observed size shift (lane 3). (B) Native polyacrylamide gel (6 %) of the in vitro nucleosome assembly reactions on mAIRN dsDNA (lanes 1–3) versus mAIRN RNA:DNA hybrids (lanes 4–8) using increasing amounts of histone octamers, as indicated. The positions of the DNA, RNA:DNA hybrid, nucleosomes and over-assembled DNA-histone precipitates are indicated. (C) Schematic representation of the HO/CD TRC plasmid constructs. (D) Southern blot images of mAIRN HO/CD TRC plasmid constructs after treatment with 0 or 1 μg/ml DOX for 24 h. Samples were incubated with increasing concentration of MNase (0, 2.5, 25, 100, or 250 gel units of MNase). Arrows indicate nucleosome monomers and dimers. Quantification of Southern blot signal from nucleosome bands in arbitrary units (A.U.) for the 250 gel units MNase lane shown next to the blot. (E) ChIP-qPCR analysis for histone H3 at the mAIRN gene in HO and CD orientation treated with 0 or 1 μg/mL DOX for 24 h (n = 4). Ordinary one-way ANOVA with Tukey's multiple comparison test (F) ChIP-qPCR analysis for RNAPII at the mAIRN gene in HO and CD orientation treated with 0 or 1 μg/mL DOX for 24 h (n = 4). Ordinary one-way ANOVA with Tukey's multiple comparison test.
Figure 2.
Figure 2.
Chromosomal integration of an inducible R-loop forming gene increases cellular TRC levels and imposes a global replication stress response. (A) Diagram showing the generation of the chromosomal TRC reporter cell lines based on the R-loop forming mAIRN sequence of the episomal reporter plasmids. Genomic integration was achieved using Sleeping Beauty transposase integration. Inducible R-loop formation with DOX stalls RNAPII progression and strongly increases the occurrence of TRC events. (B) Circus plot showing the position of the identified integration sites of the TRC reporter construct in the monoclonal U-2 OS cell line clone#12. If not otherwise stated, clone#12 cells were used for all analyses throughout this study. Five integration sites on four chromosomes (Chr 2 site 1, Chr 2 site 2, Chr 5 site, Chr 9 site, and Chr 10 site) were found using whole genome sequencing followed by TIDDIT algorithm based structural variant calling. (C) RT-qPCR analysis of mAIRN RNA expression using primer pair mAIRN#1 in cells treated with 0 or 1 μg/mL DOX for 4 or 24 h (n = 3). Error bars indicate mean values with SDs. Welch ANOVA with Dunnett T3 comparison test (D) Representative images of TRC PLA assay with RNAPII Ser2P and PCNA antibodies (Ctrl, 4 and 12 h time points). EdU click-it staining was performed to label S-phase cells. Cells were treated with 0 or 1 μg/mL DOX for TRC induction. Scale bar 10 μm. (E) Quantification of TRC PLA foci number in S-phase cells from (D) as well as additional time points (n = 2, mean foci values per replicate as colored dots). Bars indicate mean values with SDs. Ordinary one-way ANOVA with Tukey's multiple comparison test. (F) ChIP-qPCR analysis showing FANCD2 levels in asynchronous cells at the TRC reporter sequence using the mAIRN#1 primer pair. Cells were treated with 0 or 1 μg/mL DOX for 24 h (n = 4). Error bars indicate SD. Unpaired t-test. (G) Representative images of FANCD2 IF staining (Ctrl, 4 and 24 h time points). Additional EdU click-it staining was performed to label S-phase cells. Cells were treated with 0 or 1 μg/mL DOX for TRC induction. Scale bar 10 μm. (H) Quantification of FANCD2 foci number in S-phase cells from (G) as well as additional time points (n = 3). Bars indicate mean values with SDs. Ordinary one-way ANOVA with Tukey's multiple comparison test (I) Representative Western blot analysis of DNA damage marker yH2AX using cell lysates from reporter cells treated with 0 or 1 μg/μL DOX for the indicated time points (0–72 h). 5mM Hydroxy urea (HU) was used as a positive control for DNA damage induction. ORC2 was used as loading control. Quantifications of yH2AX signal relative to the control condition shown below. (J) Quantification of fraction of S-phase cells based on EdU click-it staining in cells treated with 0 or 1 μg/mL DOX for 4, 8, or 24 h. 10 μM ATR inhibitor VE-821 (ATRi) or DMSO were additionally added as indicated. Control (Ctrl) cells were treated with ATRi or DMSO for 24h (n = 6). Bars indicate mean values with SD. Ordinary one-way ANOVA with Tukey's multiple comparison test. (K) Proliferation assay tracking the growth of TRC reporter cells upon treatment with 0 or 1 μg/mL DOX for a duration of 168 h in 12 h intervals using Incucyte S3 Live-Cell Analysis System. Cells were additionally challenged with 1 or 10 μM VE-821 (ATRi) or DMSO control treatment. Data points represent the mean of three replicates (n = 3) with error bars indicating SD. Area under the curve (AUC) measurements for each replicate were performed. Statistical analysis with Ordinary one-way ANOVA with Tukey's multiple comparison test was performed on the AUC measurements. (L) Proliferation assay identical to (K). Cells were additionally challenged with 1 or 10 μM KU-60019 (ATMi) or DMSO control treatment.
Figure 3.
Figure 3.
R-loop mediated TRCs slow or block DNA replication fork progression. (A) Treatment scheme of the BrdU-seq time course experiment. Cells were synchronized at the G1/S border using double thymidine block. Cells were released into S-phase for 2, 4, 6, or 8 h to allow S-phase progression. 30 minutes before harvesting, cells were pulsed with 25 μM BrdU for labeling of nascent DNA. Upon release, cells were treated with 0 or 1 μg/mL DOX. G1 cells were kept in thymidine conditions and treated with 0 or 1 μg/mL DOX for 8 h. (B) DRIP-qPCR analysis showing R-loop levels at the reporter sequence in G1 or 4 h released S-phase cells treated with 0 or 1 μg/mL DOX using the mAIRN#2 primer pair. For RNase H conditions, isolated genomic DNA from cells was treated with E. coli RNase H1 overnight to degrade R-loops (n ≥ 3). Error bars indicate SD. Ordinary one-way ANOVA with Tukey's multiple comparison test. (C) Genome browser snapshot of a representative region on chromosome 10 indicating that BrdU-seq time course analysis tracks DNA replication progression and identifies early and late replicating domains. (D) Heatmap of BrdU-seq signal in ± 100 kb regions (5 kb bin size) around the integration sites in synchronized G1 cells and 2, 4, 6, and 8 h released S-phase cells. BrdU-seq signal is shown as log2 normalized read counts relative to the mean of all samples. Signal of both biological replicates is shown next to each other (R1 and R2). (E) Genome browser snapshot of BrdU-seq signal at the integrated mAIRN reporter construct at the 2 h S-phase time point in 0 or 1 μg/mL DOX treated cells, data shown from one of three biological replicates. (F) MA plot showing differential regulation of BrdU-seq signal at the 2 h S-phase release time point comparing DOX vs Ctrl conditions in the ± 100 kb regions around the integration sites shown in (D), in 5 kb bins. Significant and non-significant bins are highlighted accordingly.
Figure 4.
Figure 4.
TRC induction disrupts local chromatin structure on individual integration sites. (A) ChIP-qPCR analysis showing RNAPII Ser2P levels at the reporter site (mAIRN#1 primers) in synchronized S-phase cells 4 h after release from double thymidine block. Cells were treated with 0 or 1 μg/mL DOX for 4 h (n = 3). Error bars indicate SD. Welch's t-test (B) ChIP-qPCR analysis showing histone H3 levels at the reporter site (mAIRN#1 primers) in the same conditions as (A). (C) Representative genome browser snapshot showing RNAPII Ser2P and histone H3 occupancy across the entire reporter construct in DOX treated or untreated conditions in synchronized S-phase cells. Sequencing libraries were derived from samples shown in (A) and (B). (D) Representative genome browser snapshot showing RNAPII Ser2P and histone H3 occupancy at the MRPS9-AS2 locus which contains the Chr 2 site 1 integration site (exact position highlighted with a bar) in DOX treated or untreated conditions in synchronized S-phase cells. Sequencing libraries were derived from samples shown in (A) and (B). (E) Heatmap showing log2 fold change of RNAPII Ser2P signal upon DOX treatment over control in a ± 5 kb region around the integration site locations, 100 bp bin size. (F) Heatmap showing log2 fold change of histone H3 signal upon DOX treatment over control in a ± 5 kb region around the integration site locations, 100 bp bin size.
Figure 5.
Figure 5.
H3K79 methylation is a TRC-enriched chromatin modification at the R-loop reporter and genome-wide. (A) Schematic representation of the ChIP workflow used for screening TRC-dependent histone modifications including canonical histone H3 normalization. (B) Schematic representation of the mAIRN region of the integrated reporter construct and control region near NRXN2 exon 5. Locations of the tested primer pairs (TSS, mAIRN#1, mAIRN#2, NRXN2) in subsequent ChIP experiments are highlighted with bars above. (C) H3 normalized H3K4me3 ChIP in G1 or 4 h released S-phase cells treated with 0 or 1 μg/mL DOX. H3K4me3 levels were tested at the reporter sequence with primers at TSS, mAIRN#1, mAIRN#2, or the NRXN2 control site (n = 3). Error bars indicate SD. Ordinary one-way ANOVA with Tukey's multiple comparison test. (D) H3 normalized H2AK119ub ChIP in the same conditions as (C). (E) H3 normalized H3K79me2 ChIP in the same conditions as (C). (F) H3 normalized H3K79me3 ChIP in the same conditions as (C).(G) Cartoon for the selection of genomic regions biased toward HO versus CD collisions by the identification of intragenic origins of replication within actively transcribed genes [7]. (H) Analysis of H3K79me2 ChIP signal from HeLa cells at intragenic origins within actively transcribed genes. The analysis windows around the regions are 24 kb in size and excluded from the analysis if positioned within 5 kb from promoters and terminators. H3K79me2 signal accumulates at HO side of origins in gene bodies compared to the CD side. Error bands represent a 95% confidence interval as determined by a bootstrap of the mean.
Figure 6.
Figure 6.
Evaluation of the role of H3K79 methylation at TRC sites. (A) Representative Western blot of H3K79me2 upon 5 μM DOT1L inhibition (EPZ-5676) or DMSO control treatment for 8 or 72 h. GAPDH and ORC2 loading controls. Quantifications of H3K79me2 signal relative to the DMSO condition shown below. (B) H3 normalized H3K79me2 ChIP in cells treated with 5 μM DOT1L inhibition (EPZ-5676) for 8 and 72 h as well as 0 or 1 μg/mL DOX. H3K79me2 levels were tested at the mAIRN#1 or the NRXN2 control site (n = 3). Error bars indicate SD. Ordinary one-way ANOVA with Tukey's multiple comparison test. (C) Representative images of PLA assay with DOT1L and PCNA antibodies. EdU Click-it staining was performed to label S-phase cells. Cells were treated with 0 or 1 μg/mL DOX for TRC induction. Scale bar 10 μm. (D) Quantification of (C) in EdU positive and negative cells (n = 3). Error bars indicate SD. Ordinary one-way ANOVA with Tukey's multiple comparison test. (E) Analysis of DOT1L and RNAPII ChIP signal from MOLM13 cells at intragenic origins within actively transcribed genes previously defined in HeLa cells. The analysis windows around the regions are 24 kb in size and excluded from the analysis if positioned within 5 kb from promoters and terminators. DOT1L and RNAPII signal overlaps and accumulates at HO side of origins in gene bodies compared to the CD side. Error bands represent a 95% confidence interval as determined by a bootstrap of the mean. (F) RT-qPCR analysis of mAIRN RNA expression using primer pair mAIRN#1 in cells treated with 5 μM DOT1L inhibition (EPZ-5676) or DMSO control treatment. Additionally, 0 or 1 μg/mL DOX were added for 4 h (n = 3). Error bars indicate mean values with SDs. Ordinary one-way ANOVA with Tukey's multiple comparison test. (G) FANCD2 ChIP using primer pair mAIRN#1 or NRXN2 in cells treated with 5 μM DOT1L inhibition (EPZ-5676) or DMSO control treatment. Additionally, 0 or 1 μg/mL DOX were added for 24 h (n = 3). Error bars indicate SDs. Ordinary one-way ANOVA with Tukey's multiple comparison test.
Figure 7.
Figure 7.
Model for the functional role of H3K79 methylation at TRC sites to allow effective transcription recovery. (A) Cells not transcribing the mAIRN reporter (OFF) can replicate normally without disruption of chromatin organization. (B) Upon transcriptional activation of the mAIRN reporter (ON), the mAIRN reporter forms R-loops and interferes with replication fork progression. The resulting HO or CD TRC with an associated R-loop causes a local reduction of nucleosome occupancy. Simultaneously, DOT1L dissociates from the replication machinery and deposits H3K79me2/3. (C) H3K79me2/3 helps to efficiently recover transcription at the mAIRN reporter site.

Similar articles

References

    1. Zeman MK, Cimprich KA Causes and consequences of replication stress. Nat Cell Biol. 2014; 16:2–9.10.1038/ncb2897. - DOI - PMC - PubMed
    1. López-Otín C, Blasco MA, Partridge L et al. . The hallmarks of aging. Cell. 2013; 153:1194–217.10.1016/j.cell.2013.05.039. - DOI - PMC - PubMed
    1. Hanahan D, Weinberg RA The hallmarks of cancer. Cell. 2000; 100:57–70. - PubMed
    1. García-Muse T, Aguilera A Transcription–replication conflicts: how they occur and how they are resolved. Nat Rev Mol Cell Biol. 2016; 17:553–63. - PubMed
    1. Lalonde M, Trauner M, Werner M et al. . Consequences and resolution of transcription-replication conflicts. Life (Basel, Switzerland). 2021; 11:637. - PMC - PubMed

LinkOut - more resources