. 2025 Feb 23;13(2):e009468.
doi: 10.1136/jitc-2024-009468.

Phosphatidylserine as a tumor target for CAR-T cell therapy

Affiliations

Phosphatidylserine as a tumor target for CAR-T cell therapy

Celia Martín-Otal et al. J Immunother Cancer. .

Abstract

Background: Phosphatidylserine (PS) exposed on apoptotic cells promotes immune clearance of dead cells without inducing inflammation. Conversely, PS exposure on live tumor cells promotes an immunosuppressive tumor microenvironment that hinders antitumor immune responses. After confirming elevated PS levels in various tumor cell lines and cancer tissues, we aimed to investigate its potential as a target antigen for chimeric antigen receptor T cell (CAR-T) therapy.

Methods: We used two different approaches to target PS. First, we employed the adaptor proteins, EDAnnexin or BCMAnnexin comprising annexin V and EDA (extra domain A of fibronectin) or B-cell maturation antigen (BCMA) antigens, to redirect the lytic activity of EDA CAR-T or BCMA CAR-T cells toward PS-expressing tumor cells. In a second approach, we developed an annexin V-based CAR (Anxa CAR-T) to directly recognize PS-positive tumor cells.

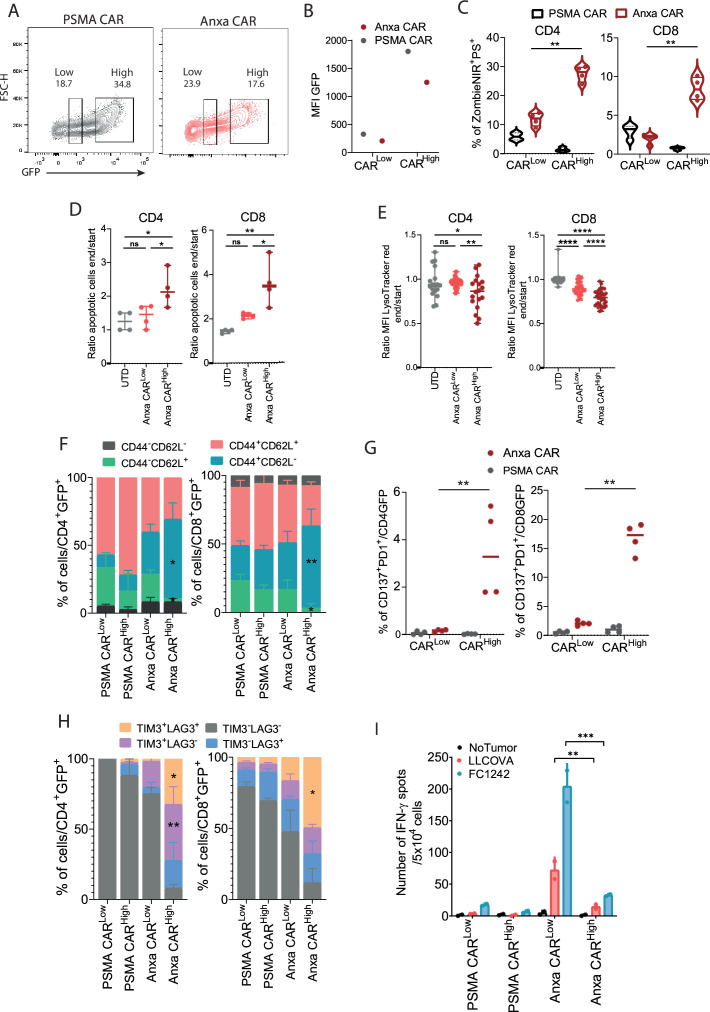
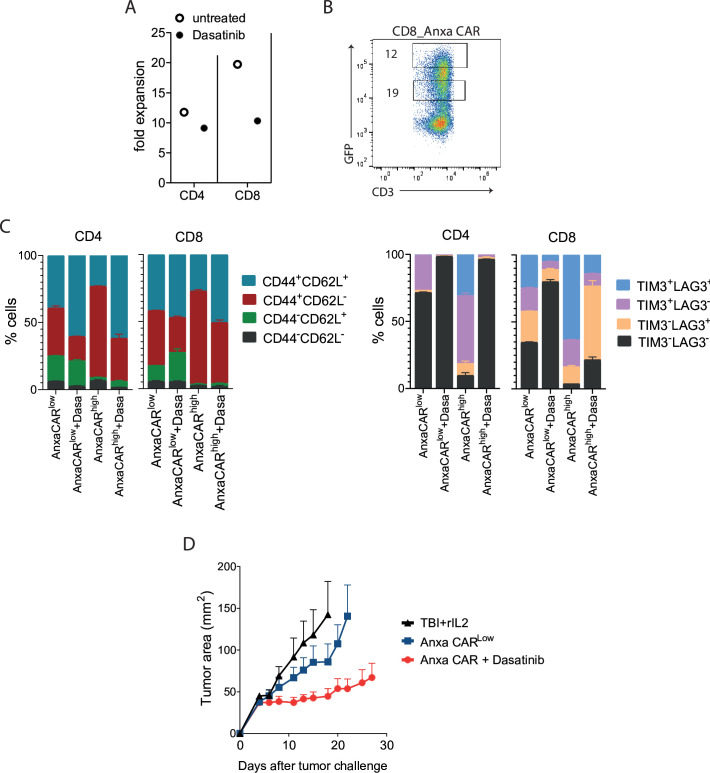
Results: The adaptors proteins EDAnnexin and BCMAnnexin successfully redirected EDA CAR-T or BCMA CAR-T cell activity, leading to an efficient recognition of PS+ tumor cells in vitro. However, the established immunological synapse differs significantly from that observed when CAR-T cells recognize the tumor cells directly. In vivo administration of the adaptor proteins, combined with the corresponding CAR-T cells, displayed antitumor activity in mice bearing PS+ tumors. Regarding the second approach, Anxa CAR-T cells effectively recognized and killed PS+ tumor cells in vitro. Nonetheless, PS exposure on T-cell membranes during T-cell activation impeded efficient Anxa CAR-T cell manufacturing due to fratricide. By optimizing retroviral dose to reduce Anxa CAR expression on the cell membrane, or by using the multikinase inhibitor dasatinib, the fratricide effect was mitigated, enabling successful Anxa CARLow-T cell production. Remarkably, Anxa CARLow-T cells demonstrated antitumor activity in in vivo murine models of PS+ hepatocarcinoma and teratocarcinoma. No signs of toxicity were observed after Anxa CAR-T cell administration.

Conclusions: PS holds promise as a target antigen for CAR-T cell therapy, underscoring the need to address fratricide as a key challenge in the development of PS-targeting CAR-T cells.

Keywords: Adoptive cell therapy - ACT; Chimeric antigen receptor - CAR; Hepatocellular Carcinoma; Immunotherapy; Solid tumor.


Conflict of interest statement

Competing interests: None declared.

Figures

Figure 1
Figure 1. PS expression in different tumor cell lines and tumor tissues. (A) PS expression in murine (A) and human (B) tumor cell lines was analyzed using flow cytometry with annexin V staining. The analysis included cells incubated in standard culture medium (untreated), nutrient-deprived SILAC medium, or following irradiation. Primary lymphocytes were also included as controls. Numbers indicate the mean fluorescence intensity for each condition. The results are representative of three independent experiments. (C) PS exposure in tumors isolated from mice previously challenged with F9, FC1242, LLCOVA or PM299L tumor cell lines. The effect of total body irradiation with 4 Gy (TBI) 24 hours before tumor extraction was also evaluated. Bars representing the mean and SD are plotted. (D) PS exposure, indicated by the MFI of annexin V staining in EpCAM+CD45Zombie-NIR cells, was measured in tumor resections of five patients with hepatocellular carcinoma. Each histogram corresponds to one patient, with annexin V staining in the non-tumor (NT) area shown in gray and the staining corresponding to the tumor area shown in color (T). The graph represents the analysis of paired samples from these five patients. (E) Tumor cell proliferation rate (3H-thymidine incorporation (cpm/cell)) and PS exposure levels in the indicated tumor cell lines plated at different cell densities. (F) PS exposure in Ki-67+ cells. (G) Immunohistochemical staining for Ki-67 in FC1242, LLCOVA or PM299L tumor tissue sections and their quantification (H). Numbers in the histogram are MFI (A, B). Data are representative of two to three independently repeated experiments. One-way analysis of variance and Bonferroni as a post hoc test (C). paired t-test (D). *p<0.05. MFI, mean fluorescence intensity; NT, non-treated; ns, no significance; PS, phosphatidylserine; TBI, total body irradiation.
Figure 2
Figure 2. Annexin V-based adaptor protein to redirect CAR-T cell activity. (A) Scheme representing the strategy to redirect EDA CAR-T cells to PS+ expressing tumors by using the EDAnnexin adaptor protein. (B) Coomassie blue staining of the recombinant proteins EDA, annexin V and EDAnnexin. (C) EDA recognition by anti-EDA single-chain variable fragment of an antibody F8 measured by ELISA. (D) Binding of EDAnnexin to the PS+ LLCOVA, FC1242 and F9 tumor cell lines, measured by flow cytometry using anti-His-APC labeled antibodies. (E) IFN-γ production by CD4+ and CD8+ PSMA CAR-T or EDA CAR-T cells in response to OVA, EDA and EDAnnexin proteins or (F) in response to tumor cell lines in the presence/absence of EDAnnexin. (G) Flow cytometric analysis of CD4 (G) and CD8 (H) PSMA CAR-T and EDA CAR-T after in vitro stimulation with FC12142 tumor cell lines in the presence of EDA or EDAnnexin protein. (I) Relative lytic capacity of PSMA CAR-T or EDA CAR-T cells incubated with LLCOVA or FC1242 tumor cell lines. (J, K) Distance of the Golgi apparatus (J) and measurement of F-actin polarization (K) to the immune synapse when EDA CAR-T cells recognize EDA in the membrane of PM299L-EDA cells (direct lysis) or when EDA CAR-T cells recognize PM299L (EDA negative) through the adaptor protein EDAnnexin (redirected lysis). Data are representative of two to three independently repeated experiments. *p<0.05, **p<0.01, ***p<0.005, ****p<0.001. One-way analysis of variance with Bonferroni multiple comparisons test (E– J). Bars representing the mean and SD are plotted. CAR, chimeric antigen receptor; EDA, extra domain A of fibronectin; IFN, interferon; IL, interleukin; PS, phosphatidylserine; PSMA: Prostate-Specific Membrane Antigen; TNF: Tumor necrosis factor.
Figure 3
Figure 3. In vivo antitumor activity of CAR-T cells redirected with annexin V-based fusion proteins protein. (A) In vivo biodistribution of 99mTc-labeled EDA-OVA and EDAnnexin proteins in mice bearing F9 tumors, 22 hours after protein injection (B) Biodistribution of the labeled proteins at different time points into the subcutaneous tumor-bearing mice (n=3 mice per group. A representative example is shown). Red arrows highlight the tumor retention of EDAnnexin into the tumor 22 hours after injection. (C) Effect of different CAR-T treatments on tumor progression in mice bearing s.c. F9 tumors (n=6–10 randomized mice per group). Follow-up of the individual tumor areas for each mouse in the different groups. Mean tumor area and mice survival are plotted. (D) Graphical representation of the BCMA CAR-T cell redirection by using BCMAnnexin adaptor protein through PS+tumor cells and Coomassie blue staining of the purified BCMAnnexin protein. (E) Binding of BCMAnnexin or EDAnnexin to tumor cells. (F) IFN-γ production of BCMA CAR-T cells in response to stimulation with the indicated proteins coated to the culture plates or (G) in response to tumor cells previously incubated with EDAnnexin or BCMAnnexin proteins. (H) Antitumor effect of BCMA CAR-T cells combined with BCMAnnexin protein administration in mice bearing PM299L tumors (n=6–7 mice per group). Data are representative of two independent experiments. Two-way analysis of variance and Bonferroni as a post hoc test (F, G). ***p<0.005. B, bladder; BCMA, B cell maturation antigen; CAR, chimeric antigen receptor; EDA, extra domain A of fibronectin; IFN, interferon; lv, liver; PS, phosphatidylserine; PSMA: Prostate-Specific Membrane Antigen; rc, renal cortex; rIL, recombinant interleukin; TBI, total body irradiation.
Figure 4
Figure 4. Anxa CAR-T exerts a fratricide effect that impairs CAR-T cell production. (A) Schematic representation of PSMA and annexin V-based CAR-T cell constructs. (B) CAR expression measured by GFP expression or (C) by staining with anti-annexin V antibody in both CD4+ and CD8+ T cells. (D) Cell viability of CD4+ and CD8+ PSMA CAR-T and Anxa CAR-T cells measured by flow cytometry as percentage of Zombie NIR+ cells. (E) Fold expansion capacity of PSMA CAR-T and Anxa CAR-T cells after 5 days of culture. (F) PS expression of unstimulated and activated CD4 and CD8 T cells measured by flow cytometry using annexin-APC. (G) Number of IFN-γ producing CD4+ and CD8+ CAR-T cells after 5 days of in vitro expansion. (H) PS exposure in LLCOVA tumor cells untreated or treated with cisplatin for 16 hours. (I) Number of IFN-γ producing CD4+ and CD8+ CAR-T cells in the presence of LLCOVA cells previously treated or not with cisplatin. Data are representative of two to three independently repeated experiments. ns, no significant, *p<0.05, **p<0.01, ***p<0.005, ****p<0.001. Student’s t-test (E). One-way ANOVA (D, G) and two-way ANOVA (I) with Bonferroni multiple comparisons test. Bars representing the mean and SD are plotted. ANOVA, analysis of variance; APC: Antigen presenting cell; CAR, chimeric antigen receptor; GFP: Green fluoresecence protein; IFN, interferon; PS, phosphatidylserine; PSMA: Prostate-Specific Membrane Antigen.
Figure 5
Figure 5. Anxa CARLow-T had lower fratricide effect in vitro. (A) Level of CAR expression in PSMA CAR-T and Anxa CAR-T cells measured by flow cytometry. (B) Mean fluorescence intensity of GFP present in CAR-THigh and CAR-TLow cells. (C, D, E) Cell viability measured as percentage of ZombiNir+PS+ cells (C), Level of apoptosis (end/start ratio) in cultures of CD4+ or CD8+ CAR-Thigh and CAR-Tlow cells (D), degranulation measured as changes in MFI of LysoTracker staining (end/start ratio) in CD4+ and CD8+ CAR-Thigh and CAR-Tlow cells (E). Phenotype (F), percentage of CD137+ PD-1+ cells (G) and percentage TIM3+ and LAG3+ cells (H) in CAR-THigh and CAR-TLow cells. (I) Number of IFN-γ producing cells in 5×10⁴ CAR-T cells after stimulation with LLCOVA or FC1242 tumor cell lines. ns, no significant, *p<0.05, **, p<0.01, ***p<0.005, ****p<0.001. One-way ANOVA with Bonferroni multiple comparisons test (C, D, E, G) and two-way ANOVA (F, H, I). Data are representative of two independent experiments. Bars representing the mean and SD are plotted. ANOVA, analysis of variance; CAR, chimeric antigen receptor; GFP: green fluorescence protein; IFN, interferon; LAG3: Lymphocyte Activation Gene-3; MFI, mean fluorescence intensity; PS, phosphatidylserine; PSMA: Prostate-Specific Membrane Antigen; TIM3, transmembrane immunoglobulin and mucin 3.
Figure 6
Figure 6. Anxa CARLow-T exerts antitumor activity in vivo. (A) CAR-T cell expression and (B) cell viability after one single infection with retrovirus expressing Anxa CAR in CD4+ and CD8+ T cells. (C) T-cell phenotype measured by CD44 and CD62L expression, (D) percentage of PD-1+CD137+ cells and CD69+ cells and (E) percentage of TIM3+ LAG3+ cells in PSMA CAR-T and Anxa CARLow-T cells. (F, H) Graphical scheme of the in vivo experiment in mice bearing PM299L tumors (F) or F9 tumors (H). (G) Tumor progression after treatment of mice with 5×10⁶ CD4+ and 5×10⁶ CD8+ Anxa CARLow-T cells or PSMA CAR-T cells (n=10 randomized mice per group). (H) Mean tumor progression and mice survival after treatment of mice with 5×10⁶ CD4+ and 5×10⁶ CD8+ Anxa CARLow-T cells or PSMA CAR-T cells in mice bearing F9 tumors (n=6–8 mice per group). (A–E) Data are representative of two independent experiments. Bars representing the mean and SD are plotted. (G, I) Analyzed using one-way-analysis of variance with Bonferroni as a post hoc test. Non-lineal fit model (G, I). *p<0.05, **p<0.01, ***p<0.005. CAR, chimeric antigen receptor; GFP: Green fluorescence protein; LAG-3: Lymphocyte Activation Gene-3; MFI, mean fluorescence intensity; PD1: Programmed Cell Death Protein 1; rIL, recombinant interleukin; s.c.: subcutaneous route; TBI, total body irradiation; TIM3, transmembrane immunoglobulin and mucin 3.
Figure 7
Figure 7. Effect of transient exposure of CAR-T cells to dasatinib on CAR-T cell expansion, phenotype and antitumor activity. CAR-T cells were expanded in the presence of dasatinib during the manufacturing process. Fold expansion in the presence or absence of dasatinib (A), the level of Anxa CAR expression (B) and phenotypic analysis measured by flow cytometry (C) are plotted. (D) Antitumor effect of Anxa CAR-T cells in mice bearing PM299L tumors (n=6–8 mice per group). CAR, chimeric antigen receptor; GFP: Greeen fluorescence protein;LAG-3: Lymphocyte Activation Gene-3; rIL, recombinant interleukin; TBI, total body irradiation; TIM3, transmembrane immunoglobulin and mucin 3.

References

    1. Doran AC, Yurdagul A, Tabas I. Efferocytosis in health and disease. Nat Rev Immunol. 2020;20:254–67. doi: 10.1038/s41577-019-0240-6. - DOI - PMC - PubMed
    1. Graham DK, DeRyckere D, Davies KD, et al. The TAM family: phosphatidylserine sensing receptor tyrosine kinases gone awry in cancer. Nat Rev Cancer. 2014;14:769–85. doi: 10.1038/nrc3847. - DOI - PubMed
    1. Zagórska A, Través PG, Lew ED, et al. Diversification of TAM receptor tyrosine kinase function. Nat Immunol. 2014;15:920–8. doi: 10.1038/ni.2986. - DOI - PMC - PubMed
    1. Taniguchi H, Yamada T, Wang R, et al. AXL confers intrinsic resistance to osimertinib and advances the emergence of tolerant cells. Nat Commun. 2019;10:259. doi: 10.1038/s41467-018-08074-0. - DOI - PMC - PubMed
    1. Taylor A, Verhagen J, Blaser K, et al. Mechanisms of immune suppression by interleukin-10 and transforming growth factor-beta: the role of T regulatory cells. Immunology. 2006;117:433–42. doi: 10.1111/j.1365-2567.2006.02321.x. - DOI - PMC - PubMed

Substances

LinkOut - more resources