. 2025 Feb 23;22(1):47.
doi: 10.1186/s12974-025-03368-9.

Astroglial modulation of synaptic function in the non-demyelinated cerebellar cortex is dependent on MyD88 signaling in a model of toxic demyelination

Affiliations

Astroglial modulation of synaptic function in the non-demyelinated cerebellar cortex is dependent on MyD88 signaling in a model of toxic demyelination

Melanie Lohrberg et al. J Neuroinflammation. .

Abstract

Progressive neurological decline in multiple sclerosis is associated with axonal loss and synaptic dysfunction in the non-demyelinated normal appearing gray matter (NAGM) and prominently in the cerebellum. In contrast to early disease stages, where synaptic and neuro-axonal pathology correlates with the extent of T cell infiltration, a prominent role of the innate immune system has been proposed for progressive MS. However, the specific contribution of microglia and astrocytes to synaptic cerebellar pathology in the NAGM- independent of an adaptive T cell response - remains largely unexplored. In the present study, we quantified synaptic changes in the cerebellar NAGM distant from demyelinated lesions in a mouse model of toxic demyelination. Proteomic analysis of the cerebellar cortex revealed differential regulation of synaptic and glutamate transport proteins in the absence of evident structural synaptic pathology or local gray matter demyelination. At the functional level, synaptic changes manifested as a reduction in frequency-dependent facilitation at the parallel fiber- Purkinje cell synapse. Further, deficiency of MyD88, an adaptor protein of the innate immune response, associated with a functional recovery in facilitation, reduced changes in the differential expression of synaptic and glutamate transport proteins, and reduced transcription levels of inflammatory cytokines. Nevertheless, the characteristics of demyelinating lesions and their associated cellular response were similar to wild type animals. Our work brings forward an experimental paradigm mimicking the diffuse synaptic pathology independent of demyelination in late stage MS and highlights the complex regulation of synaptic pathology in the cerebellar NAGM. Moreover, our findings suggest a role of astrocytes, in particular Bergmann glia, as key cellular determinants of cerebellar synaptic dysfunction.


Conflict of interest statement

Declarations. Ethical approval: Not applicable. Competing interests: The authors declare no competing interests.

Figures

Fig. 1
Fig. 1
Cuprizone feeding induces demyelinated lesions with pronounced gliosis in the cerebellar nuclei with sparing of the cerebellar cortex. a. Cuprizone was administered for 5 consecutive weeks, followed by histological or electrophysiological analysis. b Schematic representation of the analyzed regions of the murine cerebellum, namely the cerebellar nuclei (CN) and the cerebellar cortex, consisting of the subcortical lobar white matter (WM), the granule cell layer (GCL) and the molecular layer (ML). Analysis of the cerebellar cortex was performed in the area of the vermis (v). c Representative overview micrographs depict the cuprizone-induced demyelinated lesion in the CN and the fully myelinated cortical region in LFB-PAS staining (left). Abundant MAC3+ activated microglial cells are detectable within the lesion. In the subcortical lobar WM and GCL close to the lesion, some activated microglial cells (red arrows) can be observed (middle image, MAC3 IHC). Astrogliosis is apparent in the lesion, to some extent reaching into the myelinated subcortical lobar WM and GCL close to the lesion (right image, GFAP-IHC). d Quantification of MAC3+ cells in different cerebellar regions, in and outside of the demyelinated lesion, comparing cuprizone-fed vs. naive mice. Higher magnification images (right upper panel) show the cerebellar cortex with only single MAC3+ cells (red arrow) in contrast to a massive microglial activation within the lesion (lower right panel). Each point represents a measurement from an individual animal (naive n = 4; CUP5W n = 6). e Quantification of GFAP+ area in different cerebellar regions of cuprizone-fed vs. naive mice. High magnification images (right panel) indicate GFAP+ Bergmann glia cells in naive (top) vs. cuprizone-fed mice (bottom) (GFAP-IHC). Each point represents a measurement from an individual animal (naive n = 7; wt CUP5W n = 8). Missing values in d (CN) correspond to insufficient cerebellar nuclei areas in two CUP5W samples. Whiskers represent mean ± SEM. P values were obtained after two-way ANOVA followed by Sidak’s multiple comparisons test. Asterisks represent significant p-values (*p < 0.05, **p < 0.01, ***p < 0.001, **** p < 0.0001)
Fig. 2
Fig. 2
Cerebellar neuro-axonal and synaptic structural integrity in cuprizone-fed mice. a NF200-IHC of the Purkinje cell layer (left panel) and quantification (right panel) showing preserved PC numbers in naive and CUP5W. Purkinje cell numbers were normalized to the proximal perimeter of the molecular layer corresponding to the Purkinje cell layer. Each point represents average measurements from a single animal (naive n = 12; CUP5W n = 10). b. Representative images of MAP2-IHC and quantification showing a significant decrease in MAP2+-area in the granule cell layer (naive n = 4; CUP5W n = 6). c. Left panel: High magnification confocal images of the molecular layer fluorescently labelled with anti-calbindin (yellow) and anti-vGlut1 (magenta) antibodies. Nuclei are counterstained with DAPI (white). Right Panel: Quantification pre- (above) and postsynaptic area (below) as percentage of cerebellar cortex. Each point represents average values for a single animal (naive n = 7; CUP5W n = 8). d. Representative electron microscopic images of the molecular layer showing individual synapses (yellow asterisks) in naive and CUP5W mice (left panel), upon quantification (right panel) no significant differences in synaptic density could be observed. Each point represents average values for a single animal (naive n = 5; CUP5W n = 5). Whiskers represent mean ± SEM. P values were obtained after Mann Whitney test for a, c and d or two-way ANOVA with Sidak’s multiple comparisons for b. Asterisks represent significant p-values (*p < 0.05, **p < 0.01, ***p < 0.001, **** p < 0.0001)
Fig. 3
Fig. 3
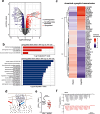
Differential expression of synaptic proteins in the cerebellar cortex and reduction of facilitation at the Purkinje cell - parallel fiber synapse in cuprizone-fed mice. a Volcano plot of proteomic analysis of the cerebellar cortex of wild type naive and cuprizone fed mice (CUP5W), depicting individual proteins and their regulation status in CUP5W as downregulated (blue), upregulated (red) and not differentially regulated (grey). Individual names are plotted for selected proteins (n = 3 independent samples per group). b. Up- (top) and down- (bottom) regulated gene sets from GO_Biological_process_2021 sets in WT mice after treatment with cuprizone. For clarity, gene sets containing the term “RNA” were filtered out, and up to 10 most significant gene sets are shown. The complete list can be found in supplementary Table 1. c. Heatmap representation of proteomic analysis showing differential expression of proteins related to glutamatergic synaptic transmission, showing an overall reduced relative expression in CUP5W. d Schematic representation of the PF-PC synapse. Parallel fibers are stimulated with an extracellular electrode (red) and EPSCs are recorded on PC using whole-cell patch clamp (blue arrow). e Relative amplitude of 2nd to 1st EPSC showing a reduction in CUP5W facilitation with time of cuprizone feeding. Each point represents an individual cell. Whiskers represent mean ± SEM, P values were obtained after unpaired t-test. Asterisks represent significant p-values (*p < 0.05, **p < 0.01, ***p < 0.001, **** p < 0.0001). f Representative excitatory post-synaptic current (EPSC) traces of naive (grey, top panel) and CUP5W (pink, bottom panel) animals upon stimulation of parallel fibers at 50 Hz
Fig. 4
Fig. 4
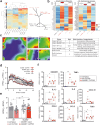
Differential regulation of synaptic proteins and inflammatory cytokines in cuprizone treated MyD88 deficient mice. a Pairwise sample correlation (left panel) and phylogenetic distance clustering (right panel) of samples based on protein expression in the cerebellar cortex of wild type (WT, gray and pink) and MyD88−/− (white and red) mice with (Cup) or without (Ctrl) 5 week cuprizone feeding (n = 3 independent samples per group). Note that cuprizone treatment had a stronger effect than genotype in sample correlation and clustering. b Heatmap representation and Gene Set Z-score (GSZ) of proteome analysis revealing differential expression of proteins related to innate immune system response (reactome, left panel) and glutamatergic synapse (gene ontology, right panel). c Self organizing maps (SOM) and sample portraits for the different experimental conditions depicting overexpression spots (A-G) and their specific expression and function in different groups (table). Normalized Purkinje cell EPSC amplitudes at 50 Hz stimulation frequency of parallel fibers presented as a stimulus train (d) or 2nd EPSC (e) show a reduction in facilitation in WT animals after cuprizone treatment (wt CUP5W, pink) as compared to naive WT animals (wt naive, grey). Each point represents mean normalized EPSC value ± SEM. No differences in facilitation are observed in naive (MyD88−/− naive, white) or cuprizone fed (MyD88−/− CUP5W, red). Each point represents an individual cell. Bars’ heights represent mean ± SEM. f Quantification of relative mRNA expression (qPCR) of selected immune modulatory mediators in the cerebellar nuclei (CN) showing a significant increase in several genes (CX3CR1, CCL3, TNFα, and TGFβ) in WT animals after cuprizone treatment. A similar cytokine upregulation of CX3CR1 and TGFβ was observed in MyD88−/− mice who also showed an increase in IL-1β and a trend towards a decrease in TNFα and CCL3 when compared to WT CUP5W mice. Each point represents mean relative expression of two technical replicates for a single animal. Bar height represents mean relative expression ± SEM. P values were obtained after two-way ANOVA followed by Tukey’s multiple comparisons test (e) and one-way ANOVA followed by Tukey’s multiple comparisons test (f). Asterisks represent significant p-values (*p < 0.05, **p < 0.01, ***p < 0.001, **** p < 0.0001)
Fig. 5
Fig. 5
Rescue of expression of synaptic proteins in MyD88-/- mice. Cuprizone treatment reduced the expression of a number of genes in the “chemical synaptic transmission” gene set (see also Fig. 3). In MyD88-/- animals, a substantial subset of these genes were not or only slightly altered upon cuprizone treatment. (a) Ratios of expression after and before cuprizone treatment in WT animals. (b) Ratio of expression between MyD88-/ and WT animals treated with cuprizone. The color corresponds to the -log10 transformed FDR. Most prominently, the glutamate transporters SLC1A6 and SLC1A3 (EAAT4 and GLAST), proteins involved in synapse structure and maintenance (e.g. GRID2, CBLN1, SHISA6), and several glutamate receptor subunits (GRIN2C, GRM1, GRM4, GRIA1, GRIA4) are rescued

References

    1. Dutta R, Trapp BD. Mechanisms of neuronal dysfunction and degeneration in multiple sclerosis. Prog Neurobiol. 2011;93:1–12. - PMC - PubMed
    1. Peterson JW, Bö L, Mörk S, Chang A, Trapp BD. Transected neurites, apoptotic neurons, and reduced inflammation in cortical multiple sclerosis lesions. Ann Neurol. 2001;50:389–400. - PubMed
    1. Vercellino M, Plano F, Votta B, Mutani R, Giordana MT, Cavalla P. Grey Matter Pathology in multiple sclerosis. J Neuropathology Experimental Neurol. 2005;64:1101–7. - PubMed
    1. Wegner C, Esiri M, Chance S, Palace J, Matthews P. Neocortical neuronal, synaptic, and glial loss in multiple sclerosis. Neurology. 2006;67:960–7. - PubMed
    1. Jürgens T, Jafari M, Kreutzfeldt M, Bahn E, Brück W, Kerschensteiner M, Merkler D. Reconstruction of single cortical projection neurons reveals primary spine loss in multiple sclerosis. Brain. 2016;139:39–46. - PubMed

MeSH terms

LinkOut - more resources