. 2025 Feb 23;16(1):84.
doi: 10.1186/s13287-025-04229-1.

OCT4 translationally promotes AKT signaling as an RNA-binding protein in stressed pluripotent stem cells

Affiliations

OCT4 translationally promotes AKT signaling as an RNA-binding protein in stressed pluripotent stem cells

Wenjie Chen et al. Stem Cell Res Ther. .

Abstract

Background: Despite numerous studies addressing the molecular mechanisms by which pluripotent stem cells (PSCs) maintain self-renewal and pluripotency under normal culture conditions, the fundamental question of how PSCs manage to survive stressful conditions remains largely unresolved. Post-transcriptional/translational regulation emerges to be vital for PSCs, but how PSCs coordinate and balance their survival and differentiation at translational level under extrinsic and intrinsic stress conditions is unclear.

Methods: The high-throughput sequencing of cross-linking immunoprecipitation cDNA library (HITS-CLIP) was employed to decipher the genome-wide OCT4-RNA interactome in human PSCs, a combined RNC-seq/RNA-seq analysis to assess the role of OCT4 in translational regulation of hypoxic PSCs, and an OCT4-protein interactome to search for OCT4 binding partners that regulate cap-independent translation initiation. By taking the Heterozygous Knocking In N-terminal Tags (HKINT) approach that specifically disrupts the 5'-UTR secondary structure and tagging its protein product of the mRNA from one allele while leaving that from the other allele intact, we examined the effect of disrupting the OCT4/5'-UTR interaction on translation of AKT1 mRNA.

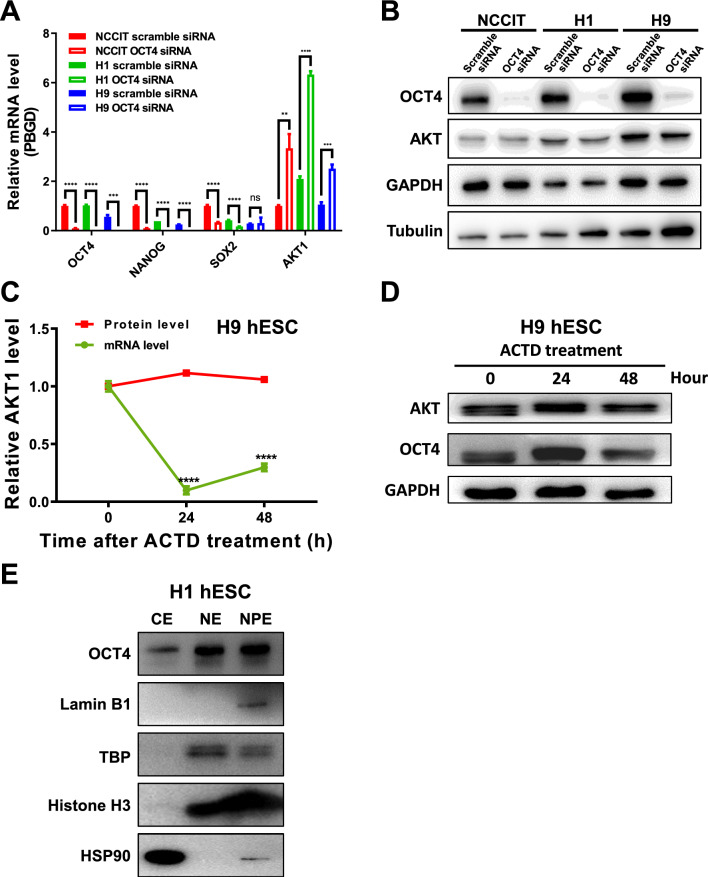
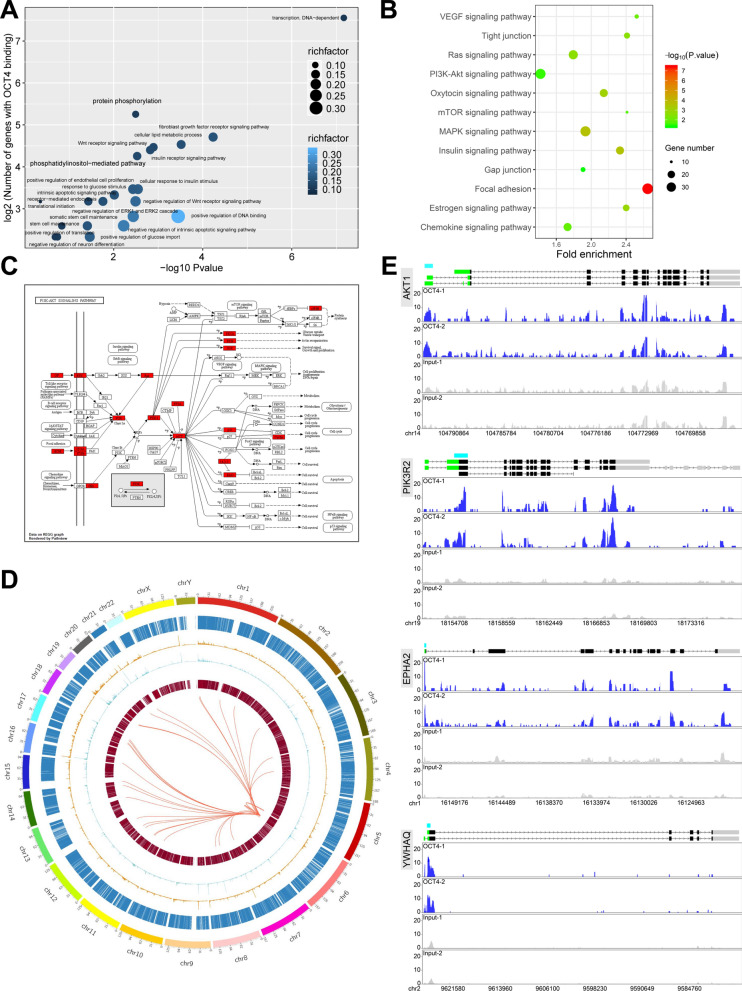
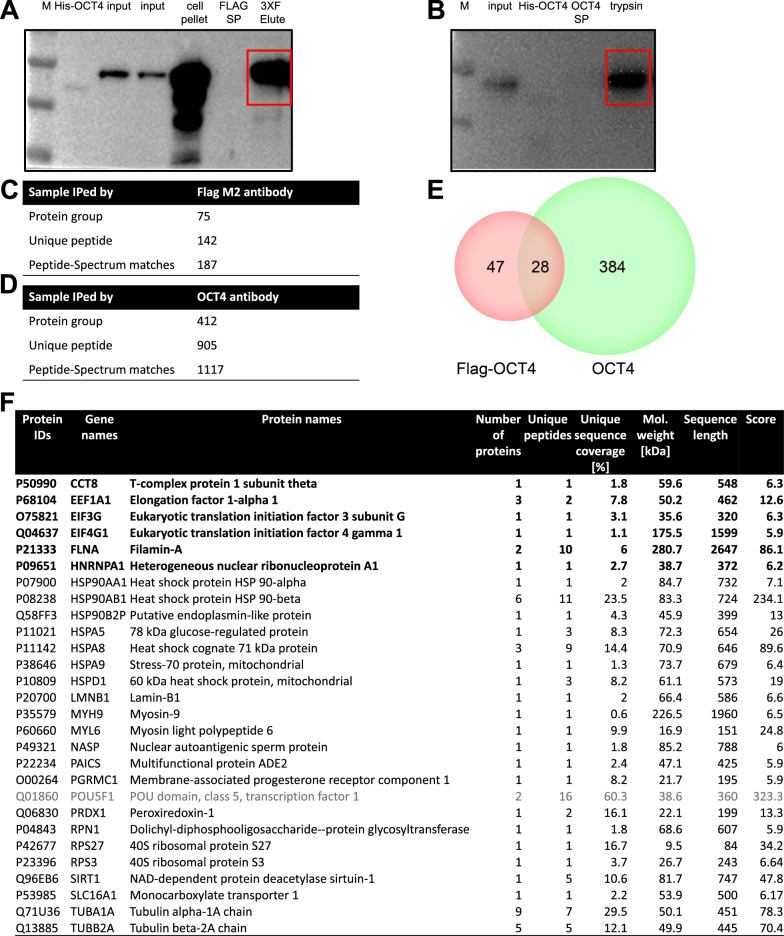
Results: We revealed OCT4 as a bona fide RNA-binding protein (RBP) in human PSCs that bound to the 5'-UTR, 3'-UTR and CDS regions of mRNAs. Multiple known proteins participating in IRES-mediated translation initiation were detected in the OCT4-protein interactome, and a combined RNC-seq/RNA-seq analysis further confirmed a crucial role of OCT4 in translational regulation of PSCs in response to hypoxic stress. Remarkably, OCT4 bound to the GC-rich elements in the 5'-UTR of AKT1 and multiple PI3K/AKT-pathway-gene mRNAs, and promoted their translation initiation via IRES-mediated pathways under stress conditions. Specifically disrupting the AKT1 mRNA 5'-UTR structure and the OCT4/5'-UTR interaction by the HKINT approach significantly reduced the translation level of AKT1 that led to a higher susceptibility of PSCs to oxidative stress-induced apoptotic death and prioritized differentiation toward ectoderm and endoderm.

Conclusions: Our results reveal OCT4 as an anti-stress RBP for translational regulation that critically coordinates the survival and differentiation of PSCs in response to various stressors.

Keywords: AKT; OCT4; Oxidative stress; Pluripotent stem cells (PSCs); RNA-binding protein (RBP); Translation initiation.


Conflict of interest statement

Declarations. Ethics approval and consent to participate: Human (h) ESC line H1 (SCSP-301) cells ( https://www.cellbank.org.cn/search-detail.php?id=483 ) and H9 (SCSP-302) cells ( https://www.cellbank.org.cn/search-detail.php?id=484 ) were acquired from the Cell Bank of the Chinese Academic of Sciences, Shanghai, China, under Material Transfer Agreements. The Cell Bank obtained prior ethical approval from WiCell Research Institute for the collection of hESC lines. The handling, storage and preparation of those cells was conducted following the protocols provided by the Cell Bank. All experiments using the obtained hESC lines in this study were approved by the Research Ethics Committee of the First Affiliated Hospital, College of Medicine, Zhejiang University, and were performed according to institutional guidelines. Title of the approved project: Endogenous OCT4 promoter-driven reporter system to study self-renewal of pluripotent and cancer stem cells. Name of the institutional approval committee or unit: Research Ethics Committee of the First Affiliated Hospital, College of Medicine, Zhejiang University. Approval number: 2019–377. Date of approval: February 8, 2019. Consent for publication: Not applicable. Competing interest: The authors declare that they have no conflict of interest.

Figures

Fig. 1
Fig. 1
Post-transcriptional regulation of AKT1 by OCT4. A NCCIT, H1 and H9 cells were transfected with scramble siRNA or OCT4 siRNAs for 48 h, and the mRNA levels of OCT4, NANOG, SOX2 and AKT1 were determined by qRT-PCR. B NCCIT, H1 and H9 cells were transfected with scramble siRNA or OCT4 siRNAs. After 48 h, cells were lysed and the whole cell lysates were subjected to immunoblotting with indicated antibodies. Data shown were from one of two independent experiments that gave similar results, and the densitometric analyses were presented in Supplementary file 6: Fig. S1D and E. C, D H9 cells were treated with 5 ng/ml Actinomycin D (ACTD) for varying period, samples were collected for qRT-PCR (C) and immunoblotting (D). The band intensities of AKT and OCT4 in D were normalized by those of GAPDH, and plotted in (C). Data in (A) and C were presented as mean ± SD of three independent experiments. In C, values at 24 h and 48 h were statistically compared with those at 0 h. Unless otherwise specified, the statistical significance of compared measurements was evaluated with one-way ANOVA and LSD test using SPSS 19.0. ns, not significant, **P < 0.01, ***P < 0.001, ****P < 0.0001. E Relative quantity of OCT4 proteins in cytoplasmic extract (CE), nuclear extraction (NE) and nuclear pellet extraction (NP, enriched in nuclear matrix proteins) of H1 cells. Full-length blots/gels are presented in Supplementary file 7: Fig. S28
Fig. 2
Fig. 2
OCT4 preferentially binds to the 5′-UTR of targeted transcripts. A The PCR products of the duplicate OCT4-IP and input samples subjected to HITS-CLIP were analyzed. The main bands were between 200 and 500 bp, and were purified and used to prepare the library for high-throughput sequencing. B Percentages of 5′-UTR, CDS, 3′-UTR, nc_exon, introns, intergenic region, and antisense CLIP-seq tags in OCT4-IP versus Input samples. C OCT4-IP CLIP tags are significantly enriched in 5′-UTR, CDS and 3′-UTR. D The distribution of OCT4-IP versus Input reads in the vicinity of transcriptional initiation site, transcriptional termination site, taking the transcriptional initiation site (TSS) and transcriptional termination site (TTS) as the origin, the distribution of reads in the upstream and downstream 1 kb range was calculated. E The distribution of OCT4-IP versus Input reads in the vicinity of start codon and stop codon, taking the start codon and stop codon as the origin, respectively, the distribution of reads in the upstream and downstream 1 kb range was calculated. F The Venn diagram showing the number of genes overlapping between the two repeated OCT4 CLIP-seq analysis. G The top 8 motifs of OCT4 binding tags analyzed using MEME software. H Overrepresented OCT4-binding motifs identified by CLIP-seq. Histogram of Z scores indicates the enrichment of hexamers in CLIP-seq clusters compared to randomly chosen regions of similar sizes in the same genes. Z score of the top hexamer is indicated. I, J Distribution of the two overrepresented OCT4 binding motifs in binding genes. K, L Distribution of the two overrepresented binding motifs (insert) relative to the start codon (indicated as 0) are indicated by green and red curves for two repeats, respectively
Fig. 3
Fig. 3
Enriched OCT4 binding to PI3K/AKT-pathway-gene transcripts. A Gene Ontology (GO) analysis of OCT4 binding targets. Significantly enriched GO terms of genes with OCT4 binding were identified using the Bingo software (hypergeometric test with Benjamini and Hochberg false discovery rate correction). The x axis indicates the enrichment P value on a − log10 scale; the y axis indicates number of genes with OCT4 binding on a log2 scale. The size of each point is proportional to the ratio of OCT4-bound genes associated with one GO term to all genes associated with this GO term. B Enrichment analysis of the KEGG pathway. The size and color of the dots represents the number of enriched genes and the adjusted P values, respectively. C OCT4 binding targets enriched in PI3K/AKT pathway. D Circos diagram shows enriched OCT4 binding sites at PI3K/AKT pathway transcripts: from outer to inner, there are circle 1, human chromosomes (indicated as chr01-23 with different colors); circle 2, heat map displaying all of human genes; circle 3, binding density of Input counts is normalized to tag per million (TPM); circle 4, binding density of OCT4 indicating all the OCT4 binding sites across the transcriptome counts is normalized to tag per million (TPM); circle 5, heat map view of genes with OCT4 binding; circle 6, red link lines indicate PI3K/AKT pathway transcripts with OCT4 binding. E Distribution and percentage of OCT4 binding sites in genes. Binding sites are shown as wiggle plots (dark blue for the OCT4 library). CDS regions are boxed in black. The 5′-UTR and 3′-UTR are boxed in green and grey, respectively. Introns are indicated as lines. The cyan boxes above gene structures indicate predicted OCT4 binding peaks. The x axis indicates genomic positions in chromosomes. The y axis indicates normalized HITS-CLIP/CLIP-seq abundance. HITS-CLIP/CLIP-seq tag counts were normalized to tag per million (TPM) to adjust for differences of two HITS-CLIP/CLIP-seq libraries in sequencing depth
Fig. 4
Fig. 4
Identification of cap-independent translation initiation components in OCT4-protein interactome in hESCs. A TAP-OCT4 H1 whole cell lysates were immunoprecipitated with the FLAG M2 antibody, the immune complexes eluted with FLAG-tripeptide (3 × F Elute), together with the post-IP supernatant (SP), the whole cell lysate (input), cell pellet, and recombinant His-OCT4 protein, were subjected to SDS-PAGE and immunoblotting with anti-OCT4. The TAP-OCT4 band is indicated. B TAP-OCT4 H1 whole cell lysates were immunoprecipitated with the anti-OCT4 antibody (SC-5279), the immune complexes were washed, eluted, and subjected to SDS-PAGE and immunoblotting. The OCT4 band is indicated. C, D Summary of mass spectrometry analysis for OCT4-interacting proteins immunoprecipitated by FLAG M2 antibody C or by anti-OCT4 antibody (D). E The Venn diagram showing the number of proteins overlapping between the two OCT4-protein interactome analyses in (C) and (D). F List of 27 OCT4-interacting proteins commonly identified in two mass spectrometry analyses shown in (C) and (D). OCT4 (POU5F1) was consistently detected in all analyses and therefore also included in the table. Full-length blots/gels are presented in Supplementary file 7: Fig. S28
Fig. 5
Fig. 5
PI3K/AKT-pathway gene mRNAs are commonly bound by OCT4 and OCT4-interacting RBPs. A Gene ontology (GO) cellular localization analysis of the identified OCT4-interacting proteins in hESCs. B GO biological process analysis of the identified OCT4-interacting proteins in hESCs. C Computational construction of OCT4-interacting protein network using STRING database (https://string-db.org). Interactions include direct (physical) and indirect (functional) associations. Light-blue edge: known interaction from curated databases; purple edge: experimentally determined interaction; green edge: text mining; black edge: co-expression; dark-blue edge: protein homology. (D) The Venn diagram showing the number of peaks overlapping among the OCT4-, HNRNPA1- and EIF3G-bound targets. (E, F) The genomic structures of AKT1 and EIF4E are shown in the top panel. Dark blue for the OCT4 library, CDS regions are boxed in black. The 5′-UTR and 3′-UTR are boxed in green and grey, respectively. Introns are indicated as lines. Wiggle plots of four HITS-CLIP/CLIP seq (OCT4 CLIP-1,2, HNRNPA1 CLIP-1,2 (from ENCODE database) and EIF3G CLIP-1,2 (from ENCODE database)) are shown below the gene structures. OCT4 binding peaks in the 5′-UTR of AKT1 and EIF4E are indicated by cyan boxes. The x axis indicates genomic positions in chromosomes. The y axis indicates normalized HITS-CLIP/CLIP-seq abundance. HITS-CLIP/CLIP seq counts were normalized to tag per million (TPM) to adjust for differences of two libraries in sequencing depth
Fig. 6
Fig. 6
OCT4 critically regulates the translation ratio of PI3K/AKT-pathway gene mRNAs in hESCs exposed to hypoxia. A Parental WT H9 cells were transfected with scramble siRNA (siNC) or OCT4 siRNA (siOCT4) under 20% O2 normoxia. After 48 h, a half of the cells were maintained under normoxia, and the other half of the cells were switched to 1% O2 hypoxia and cultured for another 24 h, the last 8 h of which were treated with 60 μM 4E1RCat. Samples were harvested and subjected to genome-wide mRNA-seq (left) and RNC-seq (right), respectively. The RPKM values of hypoxic siNC (N1) or hypoxic siOCT4 (S1)-treated cells were normalized by RPKM values of their normoxic counterparts (N20 and S20, respectively) to yield normalized RPKM N1/N20 and S1/S20, respectively, and the ratios of (S1/S20)/(N1/N20) were calculated. Genes with ratio values > 2 and P < 0.05 were considered as up-regulated (red), genes with ratio values < 0.5 and P < 0.05 were considered as down-regulated (green), and both are differentially transcribed or translated genes between siOCT4- and siNC-treated H9 cells. B The RPKM values from RNC-seq were divided by RPKM values from mRNA-seq to yield translation ratio (TR), i.e., the ratio of translating mRNA versus total transcribed mRNA. The ratios of (S1 TR/S20 TR)/(N1 TR/N20 TR) were calculated. Genes with ratio values > 2 and P < 0.05 were considered as up-regulated, genes with ratio values < 0.5 and P < 0.05 were considered as down-regulated. The percentages of up-regulated genes (red), down-regulated genes (green) and not significantly-changed genes (grey) in all detected genes (left) or in ten RIP-qPCR validated PI3K/AKT-pathway genes (right) were shown. C The duplicate (− 1, − 2) TR values of ten RIP-qPCR validated PI3K/AKT-pathway genes in hypoxic siNC (N1), normoxic siNC (N20), hypoxic siOCT4 (S1), normoxic siOCT4 (S20)-treated cells, the ratios of S1/S20, N1/N20, (S1/S20)/(N1/N20) and associated P values were calculated and presented. D, E Gene ontology (GO) biological process analysis for identified genes with down-regulated D or up-regulated E TR by siOCT4 under 1% O2 hypoxia. The size and color of the dots represented the number of enriched genes and the adjusted P values, respectively. F, G KEGG pathway analysis for identified genes with down-regulated F or up-regulated G TR by siOCT4 under 1% O2 hypoxia. The size and color of the dots represented the number of enriched genes and the adjusted P values, respectively
Fig. 7
Fig. 7
OCT4 promotes IRES-like structure-mediated translation initiation of AKT1. A OCT4-binding sites on AKT1 mRNA identified from two independently repeated HITS-CLIP experiments. B Genome view of relative positions of identified OCT4-binding sites on three AKT1 splicing variants. C Predicted secondary structure of the 5′-UTR of AKT1v3 by using the Mfold webserver. The identified OCT4-binding region is marked in light blue. D Schematic representation of the plasmids used in (E). E Relative luciferase activity indicative of IRES activity in H1 cells transfected with a series of plasmids in (D). Firefly luciferase (FLUC) activity was measured and normalized by Renilla luciferase (RLUC) activity. Data were presented as mean ± SD of three independent experiments. **P < 0.01, ***P < 0.001 compared with the control groups. F H9 and H1 cells transfected with OCT4 siRNA- or scramble siRNA in normoxia for 48 h were placed under hypoxic (1% O2) or normoxic (20% O2) conditions for another 24 h, the last 8 h of which were treated with or without 30 μM 4E1RCat. Samples were lysed and the whole cell lysates were immunoblotted with indicated antibodies (upper panels). The intensities of the AKT bands were quantified by densitometry and normalized by those of the GAPDH bands. The normalized AKT protein levels were plotted in the bottom panel. Data were presented as mean ± SD of three independent experiments. *P < 0.05, **P < 0.01, ***P < 0.001, ****P < 0.0001. G H9 cells transfected in similar manners as in F were placed under hypoxic (1% O2) condition and treated with 30 μM 4E1RCat for 4 h. The nascent protein synthesis (translation) rates of treated cells were determined as described in the Methods, and presented as a scatter dot plot. Each dot represented the measurement for a single cell, and randomly selected 300 cells from three independent experiments (with 100 cells from each experiment) were analyzed for each treatment group. The lines represented mean ± SD of the measurements for 300 cells. *P < 0.05, **P < 0.01, ***P < 0.001. H Working model for OCT4 as an RBP and a probable ITAF regulating IRES-like structure-mediated translation initiation. Full-length blots/gels are presented in Supplementary file 7: Fig. S28
Fig. 8
Fig. 8
OCT4-promoted AKT1 translation counteracts hypoxic and oxidative stresses and regulates lineage specification. A Heterozygous Knocking In N-terminal Tags (HKINT) by CRISPR/Cas9 system. In this strategy, a 171 bp TAP tag, followed by a 647 bp intron, and a PuroR expression cassette with LoxP sequence on both sides was knocked into the exon 2 of AKT1 gene in wild-type parental H9 cells. A long ssDNA donor fragment flanked at both ends by the 1 kb homology arms was used as a template to induce the homology-directed repair mechanism after the CRISPR/Cas9-mediated double-strand break. After Puro screening, clones with the full-length cassette knocked-in were treated with Cre recombinase to remove the PuroR expression cassette. A heterozygotic H9 clone (A11) with a wild-type AKT1 allele (blue) and a PuroR cassette-containing TAP-PuroR-AKT1 knock-in allele (black), two heterozygotic H9 clones (A1101, A1103) with a wild-type AKT1 allele (blue) and a TAP-AKT1 knock-in allele (red) were selected for further analyses. B Agarose gel image showing the PCR amplicons using primers spanning the PuroR cassette and the TAP tag, respectively to confirm the removal of the PuroR cassette and genomic integrity of H9 clones A1101 and A1103. C The whole cell lysates of wild-type parental H9, Cre-treated H9, H9 clones A11, A1101, A1102 and A1103 were subjected to immunoblotting with anti-AKT1. The TAP-AKT1 and unedited native AKT1 bands were marked in red and blue, respectively. D Parental H9 and heterozygotic TAP-AKT1 H9 clones A1101 and A1103 cells cultured under normoxia were harvested and the whole cell lysates were subjected to immunoblotting. Band intensities of TAP-AKT1 and WT-AKT1 in H9, A1101 and A1103 cells were quantified by ImageJ software and plotted as relative protein levels. More details were included in Supplementary file 6: Fig. S20. E The relative mRNA levels of WT-AKT1 in parental H9 and in H9 clones A1101 and A1103, and those of TAP-AKT1 in A1101 and A1103 were calculated and presented. More details were included in Supplementary file 6: Fig. S21. F Schematic representation for altered secondary structure of AKT1 v3 mRNA 5′-UTR induced by TAP knock-in. OCT4 protein is presumed to bind to the identified OCT4-binding region (green) of the 5′-UTR transcribed by the AKT1 WT allele, but not the altered 5′-UTR transcribed by the TAP-AKT1 KI allele. The remaining part of the 5′-UTR is marked in grey, the TAP sequence is marked in cyan, AKT1 CDS is marked in yellow, and the ATG start codon is marked in red. G Parental H9 and heterozygotic TAP-AKT1 H9 clone A1101 and A1103 cells exposed to 1% O2 hypoxia for varying period were harvested and the whole cell lysates were subjected to immunoblotting with the indicated primary antibodies. H Band intensities of TAP-AKT1 and WT-AKT1 from three independent experiments were quantified by ImageJ software, and the ratios of TAP-AKT1/WT AKT1 band intensities were plotted as mean ± SD (n = 3). More details were included in Supplementary file 6: Fig. S24 I Parental H9, TAP-AKT1 H9 clone A1101 and A1103 cells cultured under normoxia (20% O2) were analyzed by flow cytometry. Dead cells, living cells and cells underwent early or late apoptotic cell death were plotted as percentages of total cells. J Parental H9, A1101 and A1103 cells cultured under normoxia (20% O2) were treated with 1000 μM H2O2 for 2 h, and analyzed by flow cytometry. Dead cells, living cells and cells underwent early or late apoptotic cell death were plotted as percentages of total cells. The primary data for (I) and J were presented in Supplementary file 6: Fig. S26. (K) Cells of parental H9 and heterozygotic TAP-AKT1 H9 clones A1101 and A1103 cultured under 20% O2 normoxia in mTeSRTM1 media were switched to STEMdiff™ Trilineage Ectoderm, Mesoderm, or Endoderm Medium (lineage inducer +), respectively. The Trilineage Medium were replaced with fresh medium daily and the induction proceeded for five to seven days. Cells grown in mTeSRTM1 media throughout (lineage inducer −) served as a control. Cells were harvested and their RNA samples were analyzed by qRT-PCR using primers that amplify marker genes for three germ layers. The expression levels of germ layer marker mRNAs were normalized by that of GAPDH, and the derived values were further normalized by those of “H9 lineage inducer –” samples, with the latter being set as 1 (Supplementary file 6: Fig. S27). The ratios of “lineage inducer + ”/ “lineage inducer –” for three cell lines were expressed as mean ± SD of triplicate measurements from one of three independent experiments, which gave similar results. *P < 0.05, **P < 0.01, ****P < 0.0001. Full-length blots/gels are presented in Supplementary file 7: Fig. S28

References

    1. Trounson A, DeWitt ND. Pluripotent stem cells progressing to the clinic. Nat Rev Mol Cell Biol. 2016;17(3):194–200. - PubMed
    1. Yu JSL, Cui W. Proliferation, survival and metabolism: the role of PI3K/AKT/mTOR signalling in pluripotency and cell fate determination. Development. 2016;143(17):3050–60. - PubMed
    1. Zhao H, Jin Y. Signaling networks in the control of pluripotency. Curr Opin Genet Dev. 2017;46:141–8. - PubMed
    1. Godoy-Parejo C, Deng C, Liu W, Chen G. Insulin stimulates PI3K/AKT and cell adhesion to promote the survival of individualized human embryonic stem cells. Stem Cells. 2019;37(8):1030–41. - PMC - PubMed
    1. Singh AM, Reynolds D, Cliff T, Ohtsuka S, Mattheyses AL, Sun Y, et al. Signaling network crosstalk in human pluripotent cells: a Smad2/3-regulated switch that controls the balance between self-renewal and differentiation. Cell Stem Cell. 2012;10(3):312–26. - PMC - PubMed

MeSH terms

Substances

LinkOut - more resources