. 2025 Feb 23;11(1):74.
doi: 10.1038/s41420-025-02362-7.

Chromobox protein homolog 7 suppresses the stem-like phenotype of glioblastoma cells by regulating the myosin heavy chain 9-NF-κB signaling pathway

Affiliations

Chromobox protein homolog 7 suppresses the stem-like phenotype of glioblastoma cells by regulating the myosin heavy chain 9-NF-κB signaling pathway

Kaixiang Ni et al. Cell Death Discov. .

Abstract

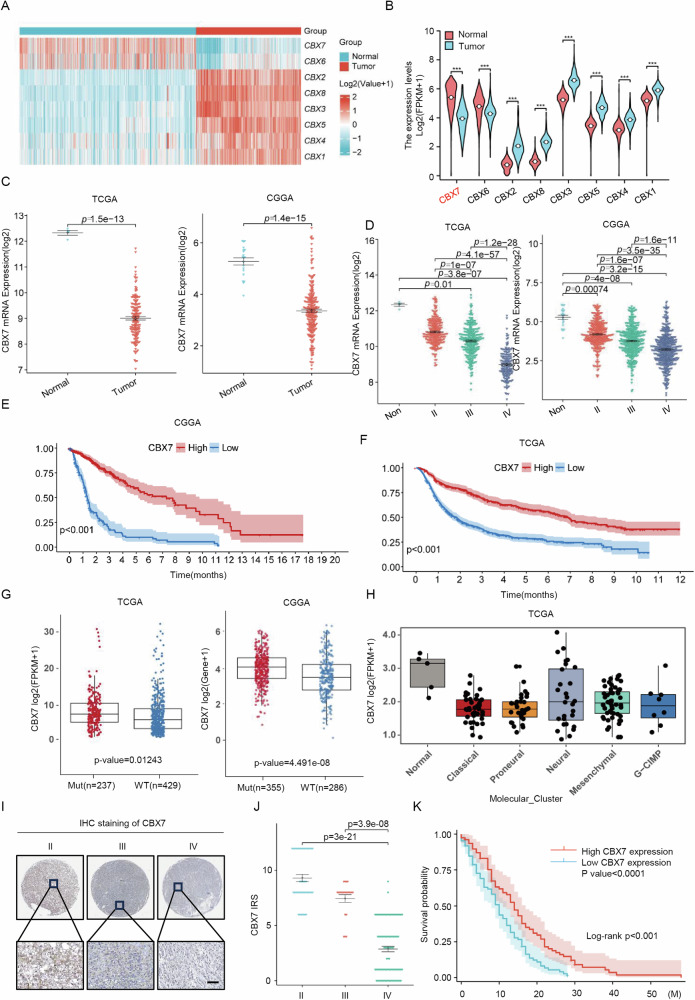
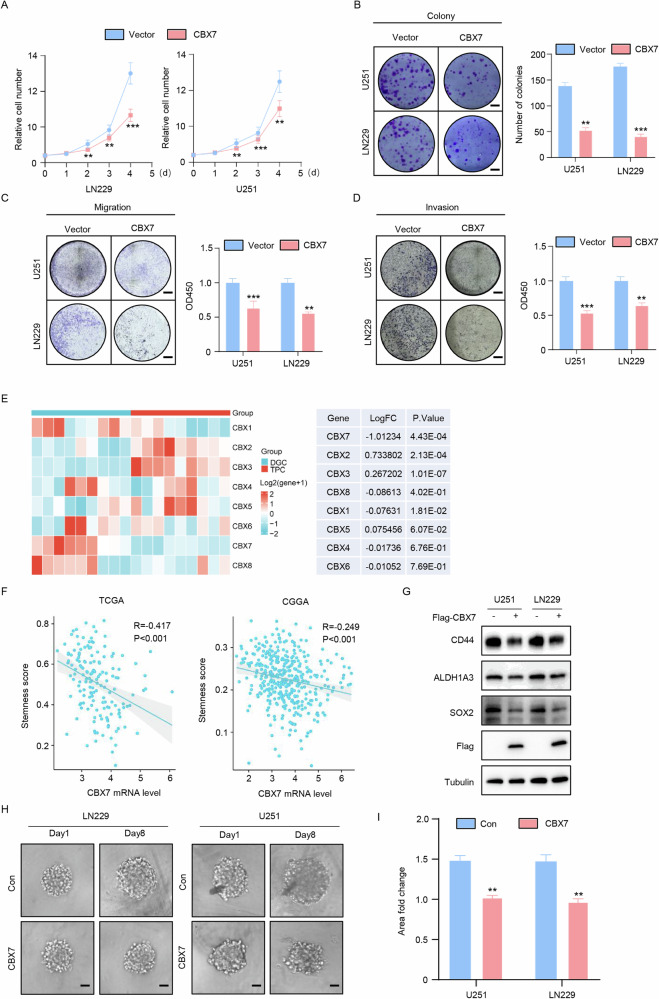
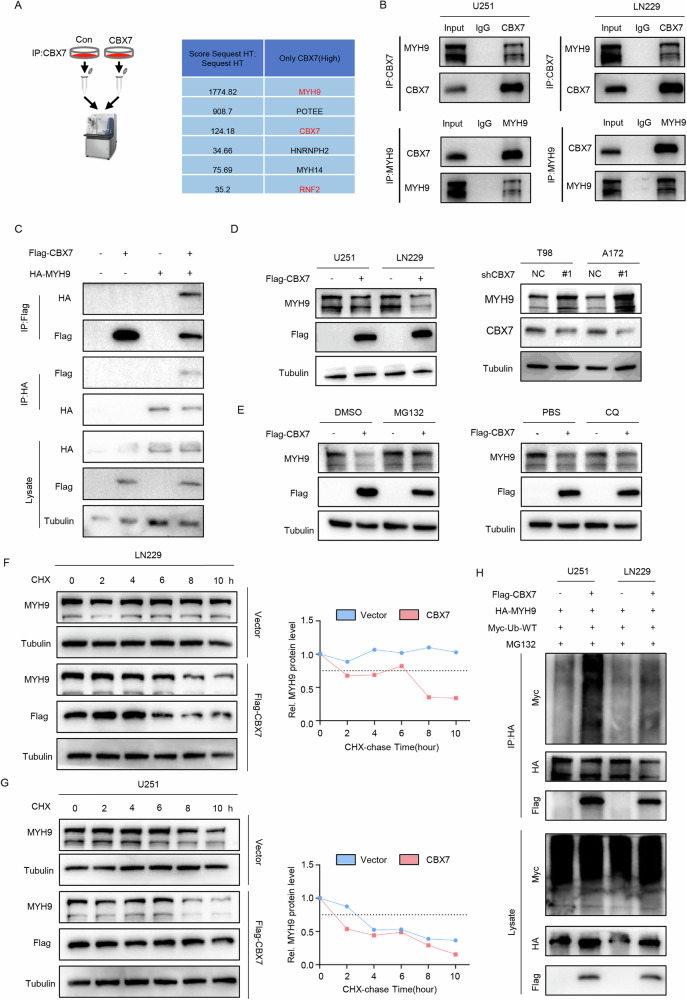
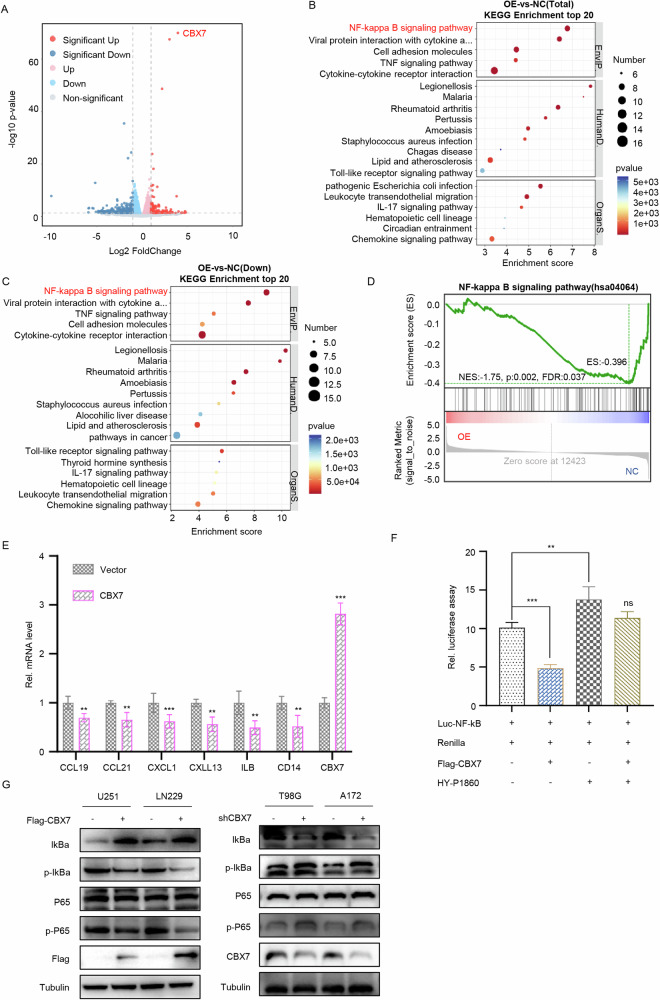
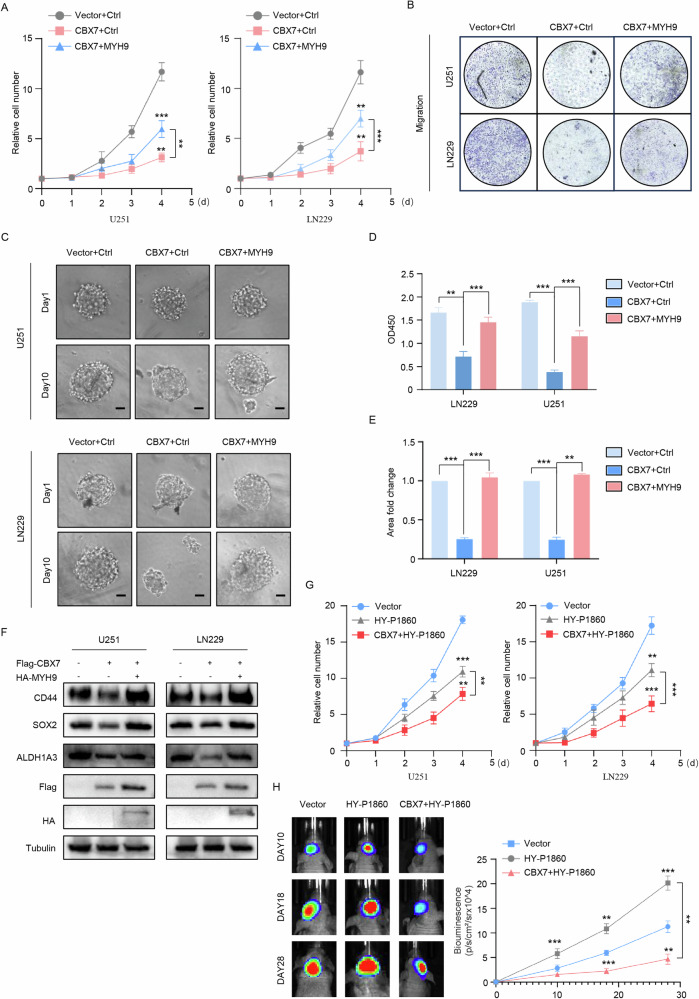
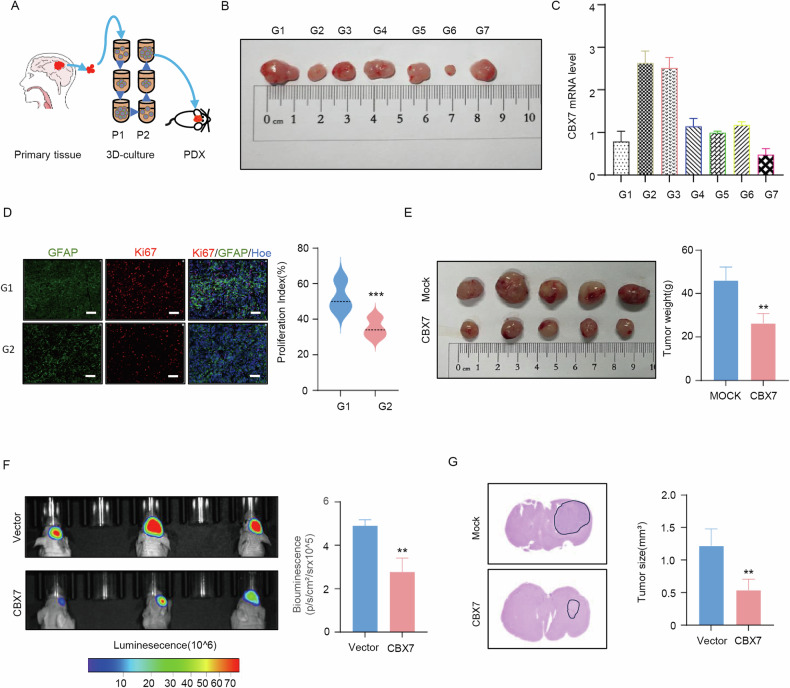
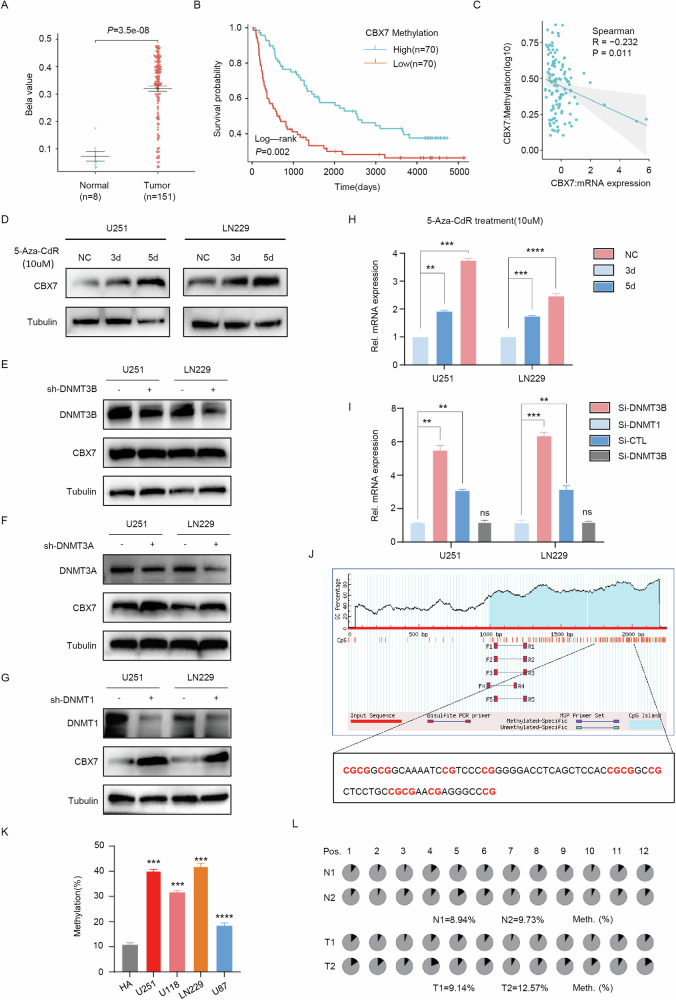
Cancer stem cells (CSCs) are significant factors in the treatment resistance and recurrence of glioblastoma. Chromobox protein homolog 7 (CBX7) can inhibit the progression of various tumors, but its impact on the stem cell-like properties of glioblastoma cells remains unclear. Clinically, low levels of CBX7 are associated with poor prognosis and increased distant metastasis in glioblastoma patients, and this low expression is caused by methylation of the CBX7 promoter. Our current research indicates that CBX7 plays a key role in suppressing the stem-like phenotype of glioblastoma. In this study, through bioinformatics analysis, we found that CBX7 is the most significantly downregulated member of the CBX family in glioblastoma and is closely associated with the stem-like phenotype of glioblastoma cells. We show that CBX7 promotes the degradation of myosin heavy chain 9 (MYH9) protein through the ubiquitin-proteasome pathway via the polycomb repressive complex 1 (PRC1) and suppresses the stem-like phenotype of glioblastoma cells by inhibiting the nuclear factor kappa-B (NF-κB) signaling pathway. Furthermore, overexpression of MYH9 in glioblastoma cells reverses the inhibitory effects of CBX7 on migration, proliferation, invasion, and stemness of glioblastoma cells. In summary, CBX7 acts as a tumor suppressor by inhibiting the stem cell-like characteristics of glioblastoma. The CBX7-MYH9-NF-κB signaling axis may serve as a potential therapeutic target for glioblastoma.


Conflict of interest statement

Competing interests: The authors declare no competing interests. Ethics approval: The study was approved by the Institutional Ethics Committee of Wuxi People’s Hospital of Nanjing Medical University at the commencement of the study.

Figures

Fig. 1
Fig. 1. Frequent downregulation of CBX7 predicts poor prognosis in glioblastoma patients.
A Clustering heat map of mRNA expression of the CBX family in TCGA-GTEx-GBM between tissues of Normal and Tumor. Heat map visualization performed using the ComplexHeatmap package. B Analysis of differences in mRNA expression of CBX family members in tumor and normal tissues. Data derived from the TCGA-GTEx-GBM dataset, and visualized using the ggplot2 package. Significant differences are observed across all members with increases in CBX1, 2, 3, 4, 5 and 8 and decreases in CBX6 and 7 (n = 1323, ***p < 0.001, Wilcoxon rank sum test). C The difference in mRNA expression of CBX7 in glioblastoma was analyzed using The Cancer Genome Atlas (TCGA) and the Chinese Glioma Genome Atlas (CGGA) databases. The data were obtained from the Gliovis online website (p values as indicated, Student’s t test). D Statistical analysis of CBX7 mRNA expression across different grades of gliomas derived from the datasets indicated in (C). (p values as indicated, two-tailed Student’s t test). E, F Overall survival analysis based on CBX7 mRNA expression in the indicated glioblastoma datasets (***p < 0.001, Kaplan–Meier survival test). G Box plot graphs show the differences in expression of CBX7 at the mRNA level of TCGA mutant glioma samples (Mut) and wild-type glioma samples (WT) (p values as indicated, Student’s t test). H. The box plot shows the expression of the CBX7 gene in different subtypes of glioblastoma in the TCGA database. I Immunohistochemical (IHC) analysis of CBX7 protein expression in a tissue array containing different grades of primary glioblastoma tissues. Scale bar = 20 μm. J CBX7 protein was frequently decreased in high grade glioblastoma compared with low grade glioblastoma (p values as indicated, Student’s t test). K Overall survival analysis based on CBX7 expression in glioblastoma tissues. Groups were ranked according to CBX7 IHC scores. The median expression of CBX7 was used as a cutoff (Log-rank χ2 = 5.823, ***p < 0.001).
Fig. 2
Fig. 2. CBX7 inhibited glioblastoma cell stemness.
A Cell growth assay of control (Vector) and CBX7 transfected LN229 and U251 cells using the Cell Counting Kit-8 demonstrated that the expression of CBX7 significantly decreases cell viability at all time points measured (mean ± SD, n = 4, **p < 0.01, ***p < 0.001, Student’s t test). B Colony formation (left) of control cells or those ectopically expressing CBX7 and the accompanying statistical analysis (right) (n = 4, **p < 0.01, ***p < 0.001, Student’s t test). C, D. Transwell invasion and migration assay of the indicated cells (left) and statistical analysis (right; n = 4, **p < 0.01, ***p < 0.001, Student’s t test,) demonstrate that transfection with CBX7 results in decreased levels of invasion and migration. E Clustering heat map of the expression of CBX family members at the mRNA level in non-stem glioma cells (DGC) and tumor propagating cells (TPC). Differentially expressed genes were calculated using the limma R package (p-values as indicated, Student’s t-test). Results demonstrate that CBX7 was the most significantly downregulated gene amongst the CBX family. F Correlation analysis between CBX7 mRNA levels and cell stemness scores in the specified dataset reveal a significant negative correlation between CBX7 mRNA expression and glioblastoma (p-values as indicated, Student’s t test). G Western blot analysis of CD44, ALDH1A3 and SOX2 in LN229 and U251 demonstrate a downregulation of these proteins following ectopic expression of CBX7. Tubulin served as a loading control. H, I. 3D-tumor spheroid growth was recorded (left) and quantitatively analyzed (right; n = 8, **p < 0.01, Student’s t test) and demonstrated that CBX7 expression resulted in significantly reduced sphere-forming capability in both U251 and LN229 cells. Scale bars = 200 μm.
Fig. 3
Fig. 3. CBX7 promotes MYH9 degradation in the form of ubiquitination modification.
A LC-MS/MS (Left) with an anti-FLAG-tag antibody and IgG in designated cells identified MYH9 as a potential binding target, as it had the highest peptide match score (sorted by Score Sequest HT(Right)) with CBX7. B Co-immunoprecipitation (Co-IP) followed by western blotting using anti-CBX7 or anti-MYH9 antibodies confirmed the endogenous association of CBX7 and MYH9 in U251 and LN229 cells. C Co-IP followed by western blotting using anti-Flag or anti-HA antibodies revealed the exogenous association of CBX7 and MYH9 in U251 and LN229 cells. D Expression of Flag-tagged CBX7 in either U251 or LN229 cells resulted in the downregulation of endogenous MYH9 levels. Knockdown of endogenous CBX7 using the shCBX7 silencing vector (#1) resulted in an upregulation of endogenous CBX7. NC refers to a scrambled silencing sequence that was used as a transfection control. Tubulin was used as a loading control. E Transfection of 293T cells with CBX7-overexpressing vector resulted in decreased expression of endogenous MYH9 and this was reversed following treatment with the proteasome inhibitor MG132 (left panel) whilst treatment with the lysosome inhibitor chloroquine (CQ) had no effect on MYH9 levels in the cells (right panel). F, G Treatment of CBX7-overexpressing LN229 (F) and U251 (G) cells with cycloheximide (CHX), used to block new protein synthesis, revealed that CBX7 overexpression significantly promoted the degradation of endogenous MYH9 protein. The relative levels of MYH9 protein at the indicated timepoints are shown in the panel on the right. H Co-transfection of U251 and LN229 cells with indicated plasmids revealed that CBX7 overexpression substantially increased the polyubiquitination levels of endogenous MYH9. Cell lysates were subjected to denaturing-IP, and the ubiquitination of MYH9 and the indicated proteins were detected by western blotting.
Fig. 4
Fig. 4. CBX7 regulates the NF-κB signaling pathway through MYH9.
A Overexpression of CBX7 in the glioblastoma cell line U251 was confirmed via RNA sequencing (RNA-seq) 48 h following transfection. B, C KEGG pathway enrichment analysis indicated that the NF-κB signaling pathway was significantly enriched following CBX7 overexpression (B) and that overexpression of CBX7 resulted in notable suppression of the NF-κB signaling pathway (C). D Gene set enrichment analysis (GSEA) also revealed that overexpression of CBX7 in U251 cells leads to an inhibition of the NF-κB signaling pathway. E U251 cells were infected with control or AD-CBX7 for 36 h. Cells were collected for RT-qPCR analysis. (Data presented as mean ± SD with 3 replicates, **p < 0.01; ***p < 0.001, Student’s t test). F A luciferase assay to detect levels of NF-κB transcriptional activity in transformed U251 cells revealed that CBX7 overexpression results in an inhibition of NF-κB activity whilst the addition of HY-P1860 (20 ng/ml; n = 3), an NF-κB signaling pathway activator, added 24 h before the assay, led to a reversal of the inhibitory effects of CBX7 (**p < 0.01, ***p < 0.001, ns—not significant, Student’s t test). G Representative western blot analysis of NF-κB signaling pathway markers P65, IκBα and p-P65 in U251 and LN229 cells transfected with the indicated plasmids. Results demonstrate that CBX7 overexpression (Flag-CBX7) substantially inhibited the activation of NF-κB pathway markers (p65, IκBα), while CBX7 knockdown (shCBX7) increased their expression.
Fig. 5
Fig. 5. CBX7 inhibits glioblastoma cell stemness through MYH9.
A Proliferation of glioblastoma cells transfected with the indicated plasmids was measured using CCK-8 (n = 4, **p < 0.01, ***p < 0.001, Student’s t test). Results reveal that transfection with a CBX7-overexpressing plasmid alone results in a significant reduction in stemness characteristics, whereas co-transfection with CBX7 and MYH9 partially reversed the inhibitory effects of CBX7. B, D Transwell migration assays (B) and the statistical analysis (D; n = 6, **p < 0.01, Student’s t test) reveal significant differences when CBX7 is co-transfected with MYH9 in both LN229 and U251 cells compared to when CBX7 is transfected by itself, which leads to significant decreases in stemness characteristics. C, E 3D-tumor spheroid growth was recorded (C) and quantitatively analyzed (E; n = 12, **p < 0.01, ***p < 0.001, Student’s t test) and illustrates the inhibitory effects of CBX7 compared to CBX7 co-transfected with MYH9 on spheroid growth. Scale bars, 200 μm. F Representative western blots of stem cell markers CD44, ALDHIA3, SOX2 in U251 and LN229 cells transfected with indicated plasmids. Transfection with CBX7 decreases expression of the stem cell markers whilst co-transfection of CBX7 and MYH9 stabilizes expression of the markers. G Measurement of proliferative capacity of CBX7 transfected cells revealed that whilst CBX7 significantly inhibited cell proliferation, treatment with an activator of the NF-κB signaling pathway, HY-P1860, significantly reversed the inhibitory effects. Proliferation was measured using the CCK-8 assay (n = 6, **p < 0.01, ***p < 0.001, Student’s t test). H To determine the in vivo effects of CBX7, we obtained bioluminescent images of intracranial xenografts derived from the implantation of the indicated cells (left) and statistical analysis of tumor volume (right; n = 9, Student’s t test, **p < 0.01, ***p < 0.001) revealed significant differences in the inhibitory effects of CBX7, indicating that CBX7 plays a biological role in tumor suppression by inhibiting activation of the NF-κB signaling pathway.
Fig. 6
Fig. 6. CBX7 inhibits the growth of tumor cells in vivo.
A Illustration of the 3D-PDX model of patient derived glioblastoma tissues. The patient-derived glioblastoma cells were cultured in 3D and the second passages were used for xenograft models and subsequent analysis. B, C. Xenograft tumors derived from 3D-cultured patient-derived glioblastoma cells (B) and CBX7 mRNA expression levels in the xenografts (C). Analysis revealed that CBX7 mRNA expression levels in these cells were somewhat inversely correlated with tumor volume (except for G6), indicating that higher CBX7 levels are associated with reduced tumorigenicity. D Cell immunofluorescence analysis of Ki-67 expression (a marker of proliferation) in tumors derived from primary glioblastoma cell lines (left; at 20x magnification). Statistical analysis revealed that tumors formed by the glioblastoma primary cell line G1 exhibit a higher proliferative capacity (right; ***p < 0.001, Student’s t test). E Representative images of subcutaneous xenografts at day 21 following U251 injection. The right panel illustrates the tumor weight analysis, revealing that U251 cells overexpressing CBX7 resulted in a significant reduction in tumor volume and size (n = 5, **p < 0.01, Student’s t test). F Bioluminescent images of intracranial xenografts derived from the implantation of either vector or CBX7 expressing cells (left) and statistical analysis of tumor volume revealed that CBX7 overexpression significantly inhibited intracranial tumor development (right; n = 6, **p < 0.01, Student’s t test). G Representative hematoxylin and eosin (H&E) stained images demonstrating that overexpression of CBX7 reduces the volumes of xenograft tumors by more than 2-fold.
Fig. 7
Fig. 7. DNMT1 and DNMT3A mediate hypermethylation of the CBX7 promoter.
A Beta values of Cbx7 in control brain and Glioblastoma samples, from CGGA data set, plotted as a cellular map (p values are as indicated, Student’s t test). B. Log-rank survival curve based on the methylation levels of CBX7 in the CGGA data set. The median expression of CBX7 was used as a cutoff. Results show that patients with lower methylation levels had significantly better survival outcomes (Log-rank χ2 = 3.823, p = 0.002). C Correlation analysis, indicating a significant negative correlation between Cbx7 methylation and its expression in the TCGA dataset (Spearman’s correlation analysis, p value and correlation coefficient R are as indicated). D, H. Protein (D) and mRNA levels (H) of CBX7 were restored in U251 and LN229 cells following treatment with 5-Aza-CdR at 10 μM for the indicated times (n = 6, **p < 0.01, ***p < 0.001, Student’s t test). EG Western blotting analysis indicated that the knockdown of DNMT1 (E) and DNMT3A (F) in U251 and LN229 cells led to a significant increase in the level of CBX7. However, the knockdown of DNMT3B (G) did not have the same effect. I CBX7 mRNA levels were examined in DNMT1, DNMT3A, or DNMT3B-silenced U251 and LN229 cells by qRT-PCR (n = 8, **p < 0.01, ***p < 0.001, ns, not significant). Results revealed that whilst knockdown of DNMT1 and DNMT3A resulted in significant increases in the relative levels of CBX7 mRNA, knockdown of DNMT3B had no effect on CBX7 mRNA levels. J Design of primers targeting the promoter region of CBX7 for pyrosequencing. The solid box contains the primer sequences, and nucleotides in red indicate the 12 CG sites detected by the primers. K, L Methylation status of the CBX7 promoter in glioblastoma cell lines (K) and paired (L) glioblastoma tissues (T) and their adjacent noncancerous tissues (N). Percentage methylation of promoter was calculated as total percent of methylated cytosines from the 12 sites (n = 5, ***p < 0.001, Student’s t test). Pyrosequencing revealed that the methylation rate of CBX7 was higher in glioma cells (K) and in cancer tissues compared to adjacent non-cancerous tissues (L).

Similar articles

References

    1. van Wijnen AJ, Bagheri L, Badreldin AA, Larson AN, Dudakovic A, Thaler R, et al. Biological functions of chromobox (CBX) proteins in stem cell self-renewal, lineage-commitment, cancer and development. Bone. 2021;143:115659. - PubMed
    1. Klauke K, Radulovic V, Broekhuis M, Weersing E, Zwart E, Olthof S, et al. Polycomb Cbx family members mediate the balance between haematopoietic stem cell self-renewal and differentiation. Nat Cell Biol. 2013;15:353–62. - PubMed
    1. Ballmer D, Tardat M, Ortiz R, Graff-Meyer A, Ozonov EA, Genoud C, et al. HP1 proteins regulate nucleolar structure and function by secluding pericentromeric constitutive heterochromatin. Nucleic Acids Res. 2023;51:117–43. - PMC - PubMed
    1. Wang L, Ren B, Zhuang H, Zhong Y, Nan Y. CBX2 Induces Glioma Cell Proliferation and Invasion Through the Akt/PI3K Pathway. Technol Cancer Res Treat. 2021;20:15330338211045831. - PMC - PubMed
    1. Xiao Q, Wang G, Yin X, Luo Z, Margariti A, Zeng L, et al. Chromobox protein homolog 3 is essential for stem cell differentiation to smooth muscles in vitro and in embryonic arteriogenesis. Arterioscler Thromb Vasc Biol. 2011;31:1842–52. - PubMed

LinkOut - more resources