. 2025 Feb 23;16(1):86.
doi: 10.1186/s13287-025-04215-7.

Autologous iPSC- and MSC-derived chondrocyte implants for cartilage repair in a miniature pig model

Affiliations

Autologous iPSC- and MSC-derived chondrocyte implants for cartilage repair in a miniature pig model

Ming-Song Lee et al. Stem Cell Res Ther. .

Abstract

Background: Induced pluripotent stem cell (iPSC)-derived mesenchymal stem cells (iMSCs) have greater potential for generating chondrocytes without hypertrophic and fibrotic phenotypes compared to bone marrow-derived mesenchymal stem/stromal cells (BMSCs). However, there is a lack of research demonstrating the use of autologous iMSCs for repairing articular chondral lesions in large animal models. In this study, we aimed to evaluate the effectiveness of autologous miniature pig (minipig) iMSC-chondrocyte (iMSC-Ch)-laden implants in comparison to autologous BMSC-chondrocyte (BMSC-Ch)-laden implants for cartilage repair in porcine femoral condyles.

Methods: iMSCs and BMSCs were seeded into fibrin glue/nanofiber constructs and cultured with chondrogenic induction media for 7 days before implantation. To assess the regenerative capacity of the cells, 19 skeletally mature Yucatan minipigs were randomly divided into microfracture control, acellular scaffold, iMSC, and BMSC subgroups. A cylindrical defect measuring 7 mm in diameter and 0.6 mm in depth was created on the articular cartilage surface without violating the subchondral bone. The defects were then left untreated or treated with acellular or cellular implants.

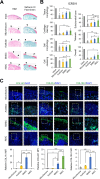
Results: Both cellular implant-treated groups exhibited enhanced joint repair compared to the microfracture and acellular control groups. Immunofluorescence analysis yielded significant findings, showing that cartilage treated with iMSC-Ch implants exhibited higher expression of COL2A1 and minimal to no expression of COL1A1 and COL10A1, in contrast to the BMSC-Ch-treated group. This indicates that the iMSC-Ch implants generated more hyaline cartilage-like tissue compared to the BMSC-Ch implants.

Conclusions: Our findings contribute to filling the knowledge gap regarding the use of autologous iPSC derivatives for cartilage repair in a translational animal model. Moreover, these results highlight their potential as a safe and effective therapeutic strategy.


Conflict of interest statement

Declarations. Ethical approval and consent to participate: The animals used and the experimental procedures conducted in this study adhered to an animal protocol approved by the University of Wisconsin-Madison Institutional Animal Care and Use Committee. The protocol titled “Cartilage Implants in a Pig Model” with ID# V005016-R02 received approval on June 8th, 2020. Consent for publication: No consent is required for publication. Competing interests: The authors declare no competing interests.

Figures

Fig. 1
Fig. 1
Timelines of major experimental stages for cartilage repair in minipigs. Minipig iPSCs were generated from the skin fibroblasts of 3-month-old minipigs, and BMSCs were isolated from the iliac crest of 9-month-old minipigs. All animals were maintained until the age of 2 years before undergoing autologous engineered cartilage transplantation. Four months after the transplantation, all groups, including the acellular and microfracture groups (not depicted), were euthanized to collect tissues for analysis
Fig. 2
Fig. 2
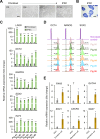
Characterization of minipig iPSCs reprogrammed from dermal fibroblasts. (A) Changes in cell morphology from minipig fibroblasts to iPSCs during cellular reprogramming between days 0 and 16. (B) Representative iPSC colonies stained with alkaline phosphatase for determination of pluripotency. (C) Transcript levels of pluripotency markers in fibroblasts and iPSCs individually derived from 6 minipigs. (D) Flow cytometry analysis of expression of pluripotency markers in 6 independent iPSC lines. (E) Transcript levels of ectodermal markers PAX6 and SOX1, mesodermal markers T and CXCR4, and endodermal markers GATA4 and SOX7. Scale bar = 200 μm. *p < 0.05, **p < 0.01, ***p < 0.001; n = 6 biological replicates
Fig. 3
Fig. 3
Characterization of minipig iMSCs and BMSCs. (A) Morphology of iMSCs and BMSCs. (B) Proliferation of iMSCs and BMSCs measured by DNA content at different time points. (C) Cumulative population doubling levels of iMSCs and BMSCs measured at each passage up to 100 days. (D) Flow cytometry analysis of iMSCs and BMSCs for detection of MSC-associated surface markers (CD29, CD44, and CD90) and hematopoietic marker (CD45). (E) Oil red O staining and quantification of lipid droplets following adipogenesis, and (F) transcript levels of adipose-associated markers (PPARG and LPL) in iMSCs and BMSCs after adipogenesis. (G) Alcian blue staining and quantification of glycosaminoglycans (GAGs) following chondrogenesis, and (H) transcript levels of cartilage-associated markers (SOX9 and ACAN) in iMSCs and BMSCs after chondrogenesis. (I) Alizarin red S staining and quantification of calcium deposition following osteogenesis, and (J) transcript levels of bone-associated markers (ALP and OC) in iMSCs and BMSCs after osteogenesis. Scale bar = 200 μm. *p < 0.05, **p < 0.01, ***p < 0.001; n = 3 biological replicates
Fig. 4
Fig. 4
Chondrogenic evaluation of iMSCs and BMSCs seeded in fibrin glue/nanofiber constructs. (A) Schematic of the fibrin glue/nanofiber sandwich construct, where iMSCs or BMSCs are mixed with fibrin glue and assembled with nanofibrous mats to assess chondrogenic capacity. (B) Live (green) and dead (red) staining of iMSCs or BMSCs cultured in the fibrin glue/nanofiber construct at different time points. (C) Proliferation of iMSCs and BMSCs cultured in the construct, measured by DNA content at days 1, 4, and 7. (D) Quantification of GAG production per DNA content of iMSCs and BMSCs following chondrogenesis in the sandwich construct, measured at different time points. (E) Transcript levels of hyaline cartilage-associated markers (SOX9, COL2A1, and ACAN), hypertrophic chondrocyte-associated markers (MMP13, RUNX2, COL10A1, and ALP), fibrocartilage-associated marker (COL1A1 and COL3A1) during chondrogenic differentiation of iMSCs or BMSCs at different time points. *p < 0.05, **p < 0.01, ***p < 0.001; n = 3 biological replicates. N.D.: not detected
Fig. 5
Fig. 5
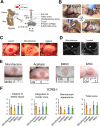
Chondral defects on medial femoral condyles, engineered cartilage construct implantation, and macroscopic assessment of articular cartilage repair. (A) Illustration of the custom-designed trocar tool utilized to create a critical-sized articular cartilage defect, measuring 7 mm in diameter and 0.6 mm in depth, while preserving the integrity of the subchondral bone. (B) Step-by-step procedure for creating an articular cartilage defect in a minipig as follows: (1) A 10-cm skin incision was made to expose the defect site on the weight-bearing surface of the medial femoral condyle. (2) The trocar tool was placed on the surface of the articular cartilage. (3) The end mill was inserted into the trocar along with a 0.6 mm thick shim and a secure collar. (4) The shim was then removed, and gentle back and forth movements of the end mill were applied to create a critical-sized articular cartilage defect with a diameter of 7 mm and a depth of 0.6 mm. (C) Representative images of chondral lesions generated by the trocar tool prior to scaffold implantation or microfracture drilling (all groups; left), after microfracture drilling (microfracture group; middle), and after engineered construct implantation (acellular and cellular groups; right). (D) MRI images captured 1 month after surgery demonstrating the repaired status of the defects in the microfracture and construct implantation groups. (E) Representative macroscopic images of the repaired articular cartilage lesions in minipigs, taken 4 months after the surgical procedure. The images portray the repair outcomes of different treatment groups, including the microfracture group (clinical treatment control) and the acellular group (cellular treatment control). (F) The ICRS-I scoring system utilized for the visual assessment of the repaired articular cartilage in minipigs. The graph presents the scores obtained from the evaluation, with statistical significance indicated by asterisks (*p < 0.05). The data reflects a sample size of 5 biological replicates
Fig. 6
Fig. 6
Histological assessment of articular cartilage repair. (A) H&E-stained images showing the histological assessment of the articular cartilage defect in minipigs, taken 4 months after surgery. Safranin O/Fast Green staining performed to analyze cartilage regeneration, with cartilage matrix stained red and other connective tissues stained green. Intact cartilage serves as the reference control, and the site of the created defect is indicated by black arrows. (B) The histological assessment of the regenerated minipig articular cartilage conducted using the ICRS-II grading score. The graph presents the scores obtained from the evaluation, with statistical significance indicated by asterisks. The assessment was performed on a sample size of n = 5. (C) Immunofluorescence staining performed on the regenerated minipig articular cartilage to detect the presence of cartilage-associated markers, including COL1A1, COL2A1, and COL10A1. The magnified images on the right represent regions enclosed by dashed boxes in the left columns. The relative mean fluorescence intensity (MFI) was used to quantify the immunofluorescence staining of the markers. The nuclear DNA is labeled with DAPI. The scale bar in the images corresponds to a length of 200 μm. *p < 0.05, **p < 0.01, ***p < 0.001; n = 5 biological replicates
Fig. 7
Fig. 7
Inflammatory cytokine levels in synovial fluid and stiffness of regenerated cartilage in repaired joints. (A) Assessment of anti- and pro-inflammatory marker expression in synovial fluid from repaired joints of minipigs. The expression levels of these markers were evaluated to analyze the microenvironment within the repaired joints. (B) The indentation hardness of both intact and repaired cartilage measured to assess their mechanical characteristics. Statistical significance is indicated by asterisks. *p < 0.05, **p < 0.01, ***p < 0.001; n = 5 biological replicates. N.D.: not detected

References

    1. Pizzute T, Lynch K, Pei M. Impact of tissue-specific stem cells on lineage-specific differentiation: a focus on the musculoskeletal system. Stem Cell Rev Rep. 2015;11(1):119–32. - PMC - PubMed
    1. Mithoefer K, McAdams T, Williams RJ, Kreuz PC, Mandelbaum BR. Clinical efficacy of the microfracture technique for articular cartilage repair in the knee: an evidence-based systematic analysis. Am J Sports Med. 2009;37(10):2053–63. - PubMed
    1. Saris DB, Vanlauwe J, Victor J, Haspl M, Bohnsack M, Fortems Y, Vandekerckhove B, Almqvist KF, Claes T, Handelberg F, et al. Characterized chondrocyte implantation results in better structural repair when treating symptomatic cartilage defects of the knee in a randomized controlled trial versus microfracture. Am J Sports Med. 2008;36(2):235–46. - PubMed
    1. Knutsen G, Drogset JO, Engebretsen L, Grøntvedt T, Isaksen V, Ludvigsen TC, Roberts S, Solheim E, Strand T, Johansen O. A randomized trial comparing autologous chondrocyte implantation with microfracture. Findings at five years. J Bone Joint Surg Am. 2007;89(10):2105–12. - PubMed
    1. Hunziker EB. Articular cartilage repair: basic science and clinical progress. A review of the current status and prospects. Osteoarthritis Cartilage. 2002;10(6):432–63. - PubMed

LinkOut - more resources