. 2025 Feb 23;16(1):1898.
doi: 10.1038/s41467-025-56918-3.

Increased ectodysplasin-A2-receptor EDA2R is a ubiquitous hallmark of aging and mediates parainflammatory responses

Collaborators, Affiliations

Increased ectodysplasin-A2-receptor EDA2R is a ubiquitous hallmark of aging and mediates parainflammatory responses

Maria Chiara Barbera et al. Nat Commun. .

Abstract

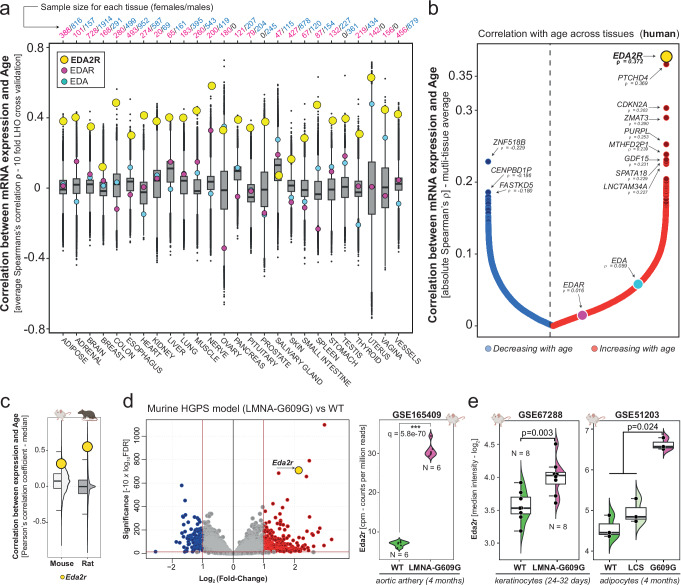
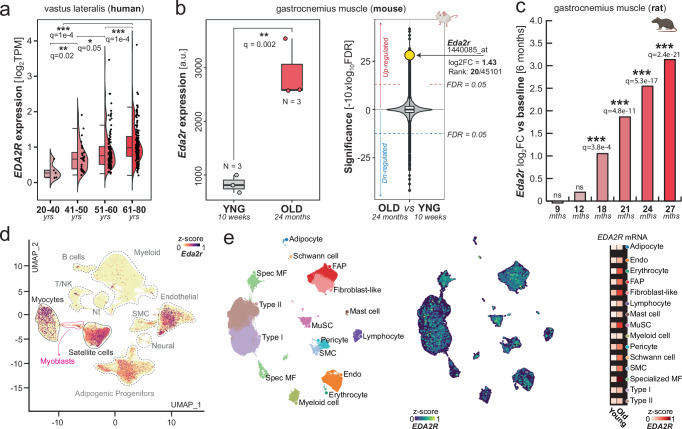
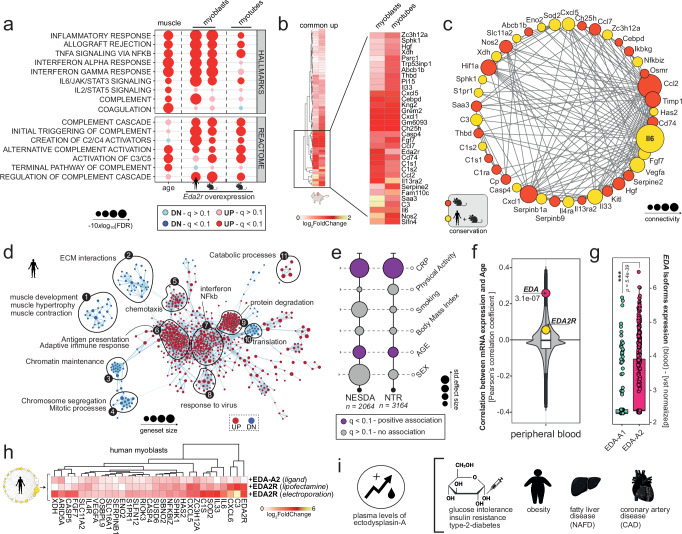
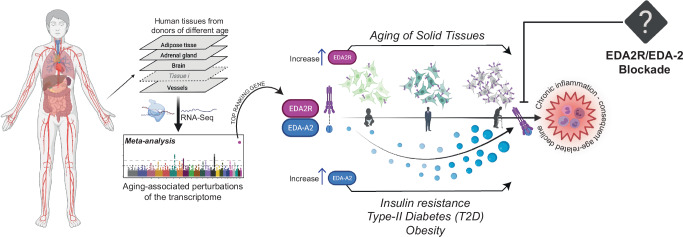
Intensive efforts have been made to identify features that could serve as biomarkers of aging. Yet, drug-based interventions aimed at lessening the detrimental effects of getting older are lacking. This is largely attributable to tissue-specificity, sex-related differences, and to the difficulty of identifying actionable targets, which continues to pose a significant challenge. Here, we implement a bioinformatics approach revealing that aging-associated increase of the transmembrane Ectodysplasin-A2-Receptor is a prominent tissue-independent alteration occurring in humans and other species, and is particularly pronounced in models of accelerated aging. We show that strengthening of the Ectodysplasin-A2-Receptor signalling axis in myogenic precursors and differentiated myotubes suffices to trigger potent parainflammatory responses, mirroring aspects of aging-driven sarcopenia. Intriguingly, obesity, insulin-resistance, and aging-related comorbidities, such as type-2-diabetes, result in heightened levels of the Ectodysplasin-A2 ligand. Our findings suggest that targeting the Ectodysplasin-A2 surface receptor represents a promising pharmacological strategy to mitigate the development of aging-associated phenotypes.


Conflict of interest statement

Competing interests: The authors declare no competing interests.

Figures

Fig. 1
Fig. 1. Cross-species correlation of EDA2R expression with age and upregulation in premature aging models.
a Boxplots representing average Spearman’s correlation coefficients between mRNA expression of all genes with age, from the GTEX dataset. Correlations were calculated across 10-fold Leave-Half-Out random resampling per tissue. Relative rankings of EDA2R, EDAR, and EDA are indicated. Sample sizes for each tissue stratified by sex are shown at the top. b Representation of the mean Spearman’s correlation coefficients (ρ) for each gene across solid tissues, with red and blue dots indicating genes that increase or decrease with age, respectively. c Boxplots representing the median Pearson’s correlation coefficients between age and mRNA expression across tissues of mice (lightgrey) and rats (darkgrey), as determined from Tabula Muris Senis (GSE132040 dataset, 14 tissues, n = 850 distinct samples) and Rat BodyMap (GSE53960 dataset, 11 tissues, n = 320 distinct samples). Mouse and rat icons: Created in BioRender. Bolis, M. (2025) https://BioRender.com/h42n006. d Left, Volcano-plot representing differential expression in murine aortic artery of HGPS, 2 months old mice (LMNA-G609G mutant, n = 6) versus wild-type, 2 months old age-matched mice (GSE165409, n = 6). Blue and red colors indicate down or upregulated genes with a log2 fold-change lower than -1 or greater than 1 and an FDR < 0.05. Right, Boxplots representing Eda2r expression in the aortic artery of HGPS (pink, n = 6) and wild-type (green, n = 6) mice. P-values were computed using Wald statistics (two-sided) as implemented in DESeq2, with p-values adjusted for multiple comparisons using the Benjamini-Hochberg procedure. Indicated is the exact FDR of Eda2r q = 5.8e−70. Mouse icon: Created in BioRender. Bolis, M. (2025) https://BioRender.com/i32c095. e Left, boxplots comparing microarray expression levels of Eda2r between HPGS (pink) and age-matched wild-type (green) mice in murine keratinocytes (GSE67288, n = 8 biological replicates in each group) and (right) gonadal adipocytes (GSE51203, n = 3 biological replicates in each group). Mutant mice deficient of Lamin C but not Lamin A (LCS, lightgreen) are provided as comparison. P-values were calculated using the Wilcoxon Rank-Sum test (two-sided) and adjusted for multiple comparisons using FDR. Mouse icon: Created in BioRender. Bolis, M. (2025) https://BioRender.com/m99g202. – Boxplots boundaries and source data are provided as a Source Data file.
Fig. 2
Fig. 2. EDA2R Expression in Aging Muscle at Bulk and Single-Cell Levels.
a mRNA expression (TPM) of EDA2R in human samples derived from vastus lateralis (n = 291, phs001048). Patients were categorized into 4 groups based on their age (20–40 n = 5; 41–50 n = 29; 51–60 n = 110; 61–80 n = 147). P-values were determined using Wilcoxon rank sum test (two-sided) and adjusted for multiple comparison using FDR. Exact q-values are provided. (***q ≤ 001; **q ≤ 0.01; *q ≤ 0.05). Darker shades of red represent older age groups. b Left, RMA-normalized expression of Eda2r measured by microarrays is indicated as normalized fluorescence intensity (arbitrary units: a.u.). Boxplots compare murine gastrocnemius samples derived from young (lightgrey) and old (red) mice (n = 3 biolgical replicates in each group, GSE52550). P-values were calculated using the Wilcoxon Rank-Sum test (two-sided). Statistical significance was adjusted using FDR. (***q ≤ 001; **q ≤ 0.01; *q ≤ 0.05; Exact q-value for Eda2r = 0.002). Right, Microarray probes ranked by their statistical significance derived from the same comparison. Mouse icon: Created in BioRender. Bolis, M. (2025) https://BioRender.com/i39v752. c Changes in Eda2r expression in rat gastrocnemius muscle with age (GSE53960). Indicated P-values were computed using Wald statistics (two-sided) as implemented in DESeq2, with p-values adjusted for multiple comparisons using the FDR. (*** indicates FDR < 0.001). Darker shades of red represent older age groups. (6 months, n = 7; 9 months, n = 7; 12 months, n = 8; 18 months, n = 7; 21 months, n = 7; 24 months, n = 8; 27 months, n = 8). Rat icon: Created in BioRender. Bolis, M. (2025) https://BioRender.com/g32r397. d UMAP depicting Eda2r expression at single-cell resolution, including over 365,000 cells, in murine muscle as quantified from McKellar et al.(Nt Neutrophils, SMC smooth muscle cells). e UMAP showing single cells from human limb skeletal muscles, as quantified by Lai et al., including over 387,000 cells/nuclei from individuals aged 15 to 99 years. Left: Major cell types annotated (MF Myofiber, Endo Endothelial, MuSC muscle stem cells, SMC smooth muscle cells, FAP fibro-adipogenic progenitors). Center: Expression of EDA2R. Right: EDA2R expression across cell-types in young and old individuals. – Boxplots boundaries and source data are provided as a Source Data file.
Fig. 3
Fig. 3. Activation of EDA2R/EDA-A2 triggers parainflammatory responses.
a Age-dependent (column 1), EDA2R/Eda2r overexpression-dependent (columns 2–4) enrichments in Hallmark and Reactome inflammation-related gene sets, as computed in aging human gastrocnemius muscle (GTEX dataset, column1) in human myoblasts (column 2), C2C12 murine myoblasts (column 3), and C2C12 differentiated murine myotubes (column 4). P-Values were adjusted for multiple testing using FDR. Human and mouse icons: Created in BioRender. Bolis, M. (2025) https://BioRender.com/s08q603. b Heatmap representing genes significantly upregulated (FDR < 0.05) in both murine myoblasts and differentiated murine myotubes following Eda2r overexpression. Highlighted genes exhibit higher levels of fold induction. Mouse icon: Created in BioRender. Bolis, M. (2025) https://BioRender.com/v79d694. c Resulting protein-protein interaction network (String-DB). Genes whose induction is confirmed in human myoblasts following EDA2R overexpression are indicated in yellow. Human and mouse icons: Created in BioRender. Bolis, M. (2025) https://BioRender.com/q91f320. d Enrichment map depicting significant induction or repression of gene sets from the comparison of transcriptional profiles of EDA2R-overexpressing vs. wild-type human myoblasts. Each dot represents an individual gene set, with the size of dots proportional to the size of each gene set. Edges between nodes represent shared genes between adjacent pathways. The analysis includes gene sets from the Hallmark, Reactome, Wikipathways, and GeneOnotlogy (BP-biological processes) collections. Human icon: Created in BioRender. Bolis, M. (2025) https://BioRender.com/u50k325. e Dotplot representing associations between EDA2R expression in peripheral blood with Age, Sex, BMI, Smoking, Physical Activity and plasmatic levels of C-reactive protein. NESDA=Netherlands Study of Depression and Anxiety (n = 2064); NTR Netherlands Twin Registry (n = 3164). Statistical significance (fdr-adjusted q-value < 0.1) is indicated in violet, and dot dimension reflects the magnitude of the estimated effect size. f Violin-plot representing Pearson’s correlations between expression and age for all human genes in venous blood (GTEX dataset, n = 497 distinct individuals). g Expression of EDA-A1 (green) and EDA-A2 (pink) isoforms (TPM) in human venous blood. Statistical significance was assessed using two-sided Wilcoxon non-parametric test (GTEX dataset, n = 755 distinct individuals). h Heatmap depicting the relative fold-change compared to matched controls of conserved genes identified in c across human myoblasts subjected to EDA-A2 ligand treatment, EDA2R overexpression by transfection, and EDA2R overexpression by electroporation. Human icon: Created in BioRender. Bolis, M. (2025) https://BioRender.com/j36h607. i Health conditions and aging-associated comorbidities linked to increased levels of plasmatic EDA. Created in BioRender. Bolis, M. (2025) https://BioRender.com/t14o510. – Boxplots boundaries and source data are provided as a Source Data file.
Fig. 4
Fig. 4. Increase of EDA2R is reinforced by elevation of EDA-A2 in aging-associated comorbidities.
The figure summarizes our findings, illustrating the tissue-wide correlation analysis that identified EDA2R as the top-ranking gene associated with aging across multiple tissues. The observed increase in EDA2R expression is accompanied by elevated levels of its ligand, EDA-A2, under specific aging-related conditions such as insulin resistance, type 2 diabetes (T2D), and obesity. Enhanced activation of the EDA2R/EDA-A2 signaling axis triggers parainflammatory responses, representing a potential therapeutic target for intervention using EDA2R-specific antagonists. Created in BioRender. Bolis, M. (2025) https://BioRender.com/u99v533.

References

    1. Tanikawa, C., Ri, C., Kumar, V., Nakamura, Y. & Matsuda, K. Crosstalk of EDA-A2/XEDAR in the p53 signaling pathway. Mol. Cancer Res.8, 855–863 (2010). - PubMed
    1. Sinha, S. K., Zachariah, S., Quinones, H. I., Shindo, M. & Chaudhary, P. M. Role of TRAF3 and -6 in the activation of the NF-kappa B and JNK pathways by X-linked ectodermal dysplasia receptor. J. Biol. Chem.277, 44953–44961 (2002). - PubMed
    1. von Renesse, J. & Mirtschink, P. Ectodysplasin A2 receptor-NF-kappaB-inducing kinase axis: a new player in muscle wasting to cancer cachexia. Sig. Transduct. Target Ther.8, 383 (2023). - PMC - PubMed
    1. Brosh, R. et al. p53-dependent transcriptional regulation of EDA2R and its involvement in chemotherapy-induced hair loss. FEBS Lett.584, 2473–2477 (2010). - PubMed
    1. de Vries, M. et al. Lung tissue gene-expression signature for the ageing lung in COPD. Thorax, 10.1136/thoraxjnl-2017-210074 (2017). - PubMed

LinkOut - more resources