. 2025 Feb 23;16(1):1903.
doi: 10.1038/s41467-025-57133-w.

Dual-mode action of scalable, high-quality engineered stem cell-derived SIRPα-extracellular vesicles for treating acute liver failure

Affiliations

Dual-mode action of scalable, high-quality engineered stem cell-derived SIRPα-extracellular vesicles for treating acute liver failure

Seohyun Kim et al. Nat Commun. .

Abstract

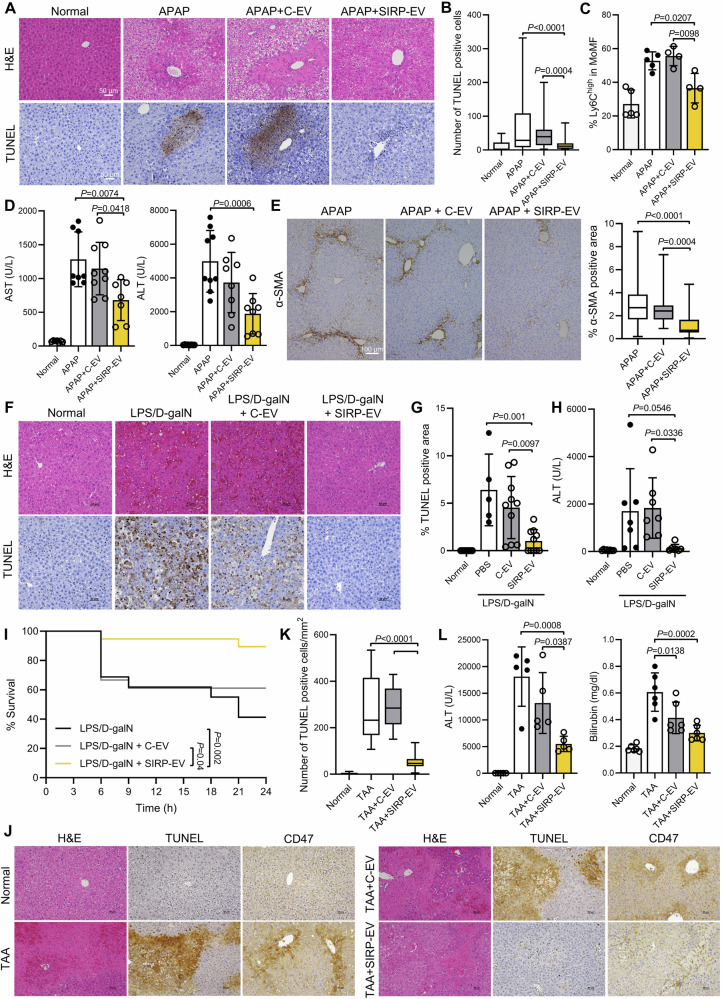
Acute liver failure (ALF) is a life-threatening condition caused by rapid hepatocyte death and impaired liver regeneration. Here we show that extracellular vesicles engineered to express Signal Regulatory Protein Alpha (SIRP-EVs), produced via a scalable 3D bioreactor process with high yield and purity, exhibit significant therapeutic potential by targeting damaged cells and promoting tissue repair. SIRP-EVs block CD47, a crucial inhibitory signal on necroptotic cells, to enhance macrophage-mediated clearance of dying hepatocytes. They also deliver regenerative cargo from mesenchymal stem cells, reprogramming macrophages to support liver regeneration. In male animal models, SIRP-EVs significantly reduce liver injury markers and improve survival, demonstrating their dual-function therapeutic efficacy. By integrating the resolution of necroptosis with regenerative macrophage reprogramming, SIRP-EVs represent a promising platform for restoring liver function. These findings support the development of EV-based in vivo macrophage reprogramming therapies for ALF and other inflammation-driven diseases, paving the way for the clinical application of engineered EV therapeutics.


Conflict of interest statement

Competing interests: I.-S.K. and G.-H.N. are the co-founders and have stock interest in SHIFTBIO INC. S.K. (Seohyun Kim), Y.K.K., S.K. (Seonghyun Kim), Y.-S.C., I.L., H.J., J.K., Y.C., and G.B.K. are employees of SHIFTBIO INC. T.D.S., J.J., E.Z., and S.L. are employees of RoosterBio, Inc. H.C. are the co-founder and have stock interest in Portrai, Inc. J.P. is an employee of Portrai, Inc. The remaining authors declare no competing interests.

Figures

Fig. 1
Fig. 1. CD47 is overexpressed on necroptotic hepatocytes in the damaged liver of ALF models.
A Biochemical evaluation (AST and ALT levels) of the ALF model after APAP induction (left). Representative images of H&E and CD47 staining of liver samples from an ALF model induced by APAP (right) (n = 4). B CD47 expression levels of cell populations within liver tissue (n = 4). C CD47 expression in hepatocytes from normal and APAP-ALF livers (n = 3). D Graphical representation of early apoptotic (Annexin V+/7-AAD), late apoptotic/necroptotic (Annexin V+/7-AAD+), and necrotic (Annexin V/7-AAD+) cell populations in liver hepatocytes from normal (n = 4) and APAP-ALF (n = 3) mice. E Expression of RIP3 and pMLKL in liver samples from normal and APAP-ALF groups. F Representative confocal images of liver sections from normal and APAP-ALF mice. Scale bar, 50 μm. G Scatter plot visualization of the Spearman correlation (R) between 121 necroptosis gene scoring and RNA levels of CD47 across samples. H STopover analysis to map the spatial overlap and interactions between cell types in liver tissue from normal and APAP-ALF mice. Highlights include 121 necroptosis gene scores (yellow) and macrophage RNA levels (blue), with overlapping areas shown in green. The plots below represent the three regions. I Violin plot visualizing SIRPα expression levels in different regions based on spatial correlation results. The numbers marked on the plot represent the median values of the SIRPα expression. Bar graph data are presented as mean ± SD. Statistical significance was determined by two-tailed unpaired Student’s t test (A), two-way ANOVA with Sidak’s post hoc test (B, D), and two-tailed test (G). Hepa hepatocytes, Immune immune cells, Endo endothelial cells. Source data are provided as a Source Data file.
Fig. 2
Fig. 2. Scalable SIRP-EV production from engineered MSCs using 3D Bioreactor systems, ensuring high purity and integrity.
A Trilineage differentiation of engineered MSCs: adipogenic differentiation by lipid droplets (left), osteogenic differentiation by mineralized matrices (middle), and chondrogenic differentiation by cartilage matrix (right). B Surface marker expression on SIRP-MSCs post-transduction and control C-MSCs, confirming MSC phenotype with markers CD73, CD90, CD105, CD166, and absence of CD14, CD34, CD45. C Cytokine secretion profiles (FGF, HGF, IL-8, TIMP-1, TIMP-2, VEGF) of C-MSCs (n = 2 for bFGF; n = 3 for HGF, IL-8, TIMP-1, TIMP-2, and VEGF) and SIRP-MSCs (n = 2 for bFGF and HGF; n = 3 for IL-8, TIMP-1, TIMP-2, and VEGF). D Inter- and intra-donor variability in SIRP-MSCs shown by fold expansion 5 days post-thaw (left), nanoparticle concentration at final harvest (middle), and percentage of SIRPα-stained cells (right). Two independent vials from a single donor and one from a second donor were evaluated (n = 3). E Visualization of cells in 2D CellSTACKs and 3D bioreactor systems (Ambr250 and STR). F The time course measurements of particle concentration during two independent runs for each of the 2D CellSTACKs (2D), 3D Ambr250 (Ambr), and 3D STR (STR) systems. G Size distributions of particles using NTA from 2D CellSTACKs and 3D bioreactor systems (Ambr250 and STR). H SIRPα expression levels of MSCs before harvest from STR runs, with controls from Ambr and 2D systems (n = 2). I Schematic of the downstream processing flow for SIRP-EV isolation, encompassing clarification to sterile filtration. Created with BioRender.com (https://BioRender.com/r97a555). JL In-process analytics results for SIRP-EV: J protein, (K) dsDNA, human serum albumin clearance, and (L) cumulative yield of SIRP-EV. M The purity of SIRP-EV per step is quantified as the particle count per mg protein. BD, H, JM Bar graph data are presented as mean ± SD. J, L, M Bars represent the mean of independent process replicate points using mean analytical test results. n = 1 for Harvest, Clar., Buffer Ex., and Sterile Filt.; n = 3 for Concen.; n = 2 for Guard Filt., and Chrom. K dsDNA and albumin tests included n = 3 technical test replicates. The numbers displayed on a bar graph represent the exact numerical values of the bar. Clar clarification, Concen concentration, Guard Filt guard filtration, Chrom chromatography, Buffer Ex buffer exchange, Sterile Filt sterile filtration. Source data are provided as a Source Data file.
Fig. 3
Fig. 3. Comprehensive analysis of MSC-derived SIRP-EV.
AC Protein profile comparisons and reproducibility between C-EVs and SIRP-EVs. A Scatter plot consistency and R2 values for protein identification across replicates; Venn diagram overlaps of EV type-specific proteins. B Correlation coefficient analysis of protein profile similarities between replicates. C Quantification of SIRPα overexpression in SIRP-EVs compared to C-EVs. D Protein expression of EVs to examine SIRPα, EV markers (CD81, CD9, CD63, and TSG101), and non-EV marker, prohibitin. E Representative cryo-TEM image of EVs. F Size distribution of EVs analyzed by DLS. G Zeta potential measurements of EVs analyzed using NTA, which denote the surface charge distribution (left, n = 3). MemGlow staining of EVs (right). H Network diagram displaying over-represented Gene Ontology Biological Processes (GOBPs) among the top 506 SIRP-EV proteins. Analysis shows the proportion of these proteins compared to the total, with significant GOBPs (P < 0.05) indicated by black and red lines for group and individual function significance, respectively. I Quantification of cell binding, following a 30-min co-incubation of Cy5.5-labeled C-EV and SIRP-EV with CD47 KO and CD47 WT cells (n = 3). Bar graph data are presented as mean ± SD. Statistical significance was determined by two-tailed unpaired Student’s t test (G), two-way ANOVA with Sidak’s post hoc test by comparing the groups treated with the same concentration of EVs (I). ****P < 0.0001. Source data are provided as a Source Data file.
Fig. 4
Fig. 4. SIRP-EV preferentially accumulates in CD47-overexpressing injured liver after systemic delivery.
A FPLC elution profiles of Cy5.5-labeled SIRP-EV, Cy5.5 dye, and SIRP-EV. Fluorescence was detected using a UV-Vis detector at 280 nm and 700 nm. B Ex vivo imaging of the organ distribution in mice 24 h after intravenous administration of 2.5 × 1010 Cy5.5-labeled SIRP-EVs. C, D Systemic delivery and uptake of EVs in mice liver tissues. C Dose-dependent accumulation of SIRP-EVs in liver tissues of APAP-ALF mice was observed within 24 h. The in vivo imaging system (IVIS) are shown (left), and quantitative fluorescence signals from ex vivo livers are presented (right). Representative images (n = 2) of independent repeated experiments. D A reduction in SIRP-EV accumulation in APAP-ALF liver tissues resulted from pre-blocking with the anti-CD47 antibody. Representative images (n = 2) of independent repeated experiments. Source data are provided as a Source Data file.
Fig. 5
Fig. 5. SIRP-EV targets CD47-expressing necroptotic hepatocytes to promote therapeutic efficacy via enhanced efferocytosis and liver regeneration in ALF.
A Representative histological images of CD47 staining (left) and quantification of CD47-positive area (right) in liver tissue from normal and APAP-ALF mice. Box graph data are presented as mean ± SD. Box plot minima = 1.3, 5.2, 5.2; maxima = 6, 41.2, 39.1; center = 3.05, 22.8, 8.85. B Representative multiplex IHC images from APAP-ALF mouse liver after 4 × 109 SIRP-EVs treatment. The left panel shows a broader view, while the right panel focuses on a necrotic area, as delineated by the dashed line. C Representative multiplex IHC of APAP-ALF mouse liver tissue and D the quantification of CD47-positive necroptotic cells (CD47+pMLKL+) is shown on the right panel. Box graph data are presented as mean ± SD. Box plot minima = 8, 0; maxima = 52, 21; center = 22.5, 1. E Cell type-specific biodistribution of SIRP-EV in APAP-ALF livers (n = 4 per experimental group and n = 2 for the saline control group). F CD47 expression in liver tissue cell types after systemic treatment with SIRP-EVs compared to C-EVs (n = 4). G Representative confocal images of liver sections from mice 24 h post-induction with a 500 mg/kg APAP dose, treated with 4 × 109 SIRP-EVs. Cells were immunostained for F4/80 (green) and pMLKL (red), with white arrowheads indicating engulfed necroptotic cells. H Serum AST and ALT levels were determined 48 h after APAP injection in subjects receiving the indicated dose of SIRP-EV (AST: n = 7 for normal and NT, n = 6 for APAP-treated groups; ALT: n = 6 per group). I Representative multiplex IHC of APAP-ALF mouse liver treated with 4 × 109 SIRP-EVs. Quantification of Ki67-positive proliferative hepatocytes (Ki67+HNFα+) in APAP-ALF mouse liver is shown in the right panel. Box graph data are presented as mean ± SD. Statistical significance was determined by one-way ANOVA with Tukey’s post hoc test (A, E, H), two-tailed unpaired Student’s t test (D, I) and two-way ANOVA with Sidak’s post hoc test (F). Hepa hepatocytes, Immune immune cells, Endo endothelial cells. Source data are provided as a Source Data file.
Fig. 6
Fig. 6. SIRP-EV outperforms C-EV in ALF models, attributed to SIRPα expression.
A Representative histological images of H&E and TUNEL in liver tissue from normal and APAP-ALF mice after EVs treatment. B Quantification of TUNEL-positive cells. Box graph data are presented as mean ± SD. Box plot minima = 0, 0, 2, 1; maxima = 49, 332, 200, 58; center = 1, 28.5, 38.5, 6. C Flow cytometry determination of Ly6Chigh as a percentage of total liver CD11bhigh F4/80low MoMFs (n = 4 for Normal and APAP groups, and n = 5 for APAP + C-EV and APAP + SIRP-EV groups). D Serum AST (n = 7 for Normal and APAP + SIRP-EV groups, n = 8 for APAP group, and n = 9 for APAP + C-EV groups) and ALT (n = 8 for Normal, APAP + C-EV, and APAP + SIRP-EV groups, n = 9 for APAP group) levels were measured 48 h post-500 mg/kg APAP induction in subjects treated with 4 × 109 EVs. E Representative IHC images of α-SMA staining in liver tissues from mice that survived 120 h after induction with a 700 mg/kg dose of APAP. Quantification of α-SMA is shown in the right panel. Box represents the distribution of combined sample results across independent experiments. Box graph data are presented as mean ± SD. Box plot minima = 0.189, 0.884, 0.061; maxima = 9.321, 7.306, 4.731; center = 2,696, 2.406, 0.725. FI Therapeutic effects of 9 × 108 EVs on an LPS/d-galN-induced ALF model. F Representative histological images of H&E and TUNEL staining in liver tissue from normal and LPS/d-galN-induced ALF mice after the indicated treatment. G Quantification of the TUNEL-positive area (n = 5 for PBS group, n = 10 for Normal, C-EV, and SIRP-EV groups). H Serum ALT levels were determined 8 h post-LPS/d-galN injection (n = 7 for PBS, C-EV, and SIRP-EV groups, n = 8 for the Normal group). I Kaplan–Meier survival curves for LPS/d-galN-induced ALF mice treated with EVs (n = 16 for LPS/d-galN group, n = 18 for LPS/d-galN+C-EV group, and n = 19 for LPS/d-galN+SIRP-EV group, across three independent experiments). JL Therapeutic efficacy of 5 × 108 EVs in TAA-induced ALF models. J Representative histological images of H&E, TUNEL, and CD47 staining in liver tissue from both normal and TAA-induced ALF mice following EVs treatment. K Quantification of TUNEL-positive cells in liver tissue. Box graph data are presented as mean ± SD. Box plot minima = 0, 107, 150.8, 5; maxima = 11.6, 533.7, 429.3, 136; center = 0, 232.1, 284.3, 46.5. L Serum ALT (n = 5 per group) and total bilirubin (n = 6 per group) levels were determined 40 h post-TAA injection. Bar graph data are presented as mean ± SD. Statistical significance was determined by one-way ANOVA with Tukey’s post hoc test (BE, G, H, K, L). Source data are provided as a Source Data file.
Fig. 7
Fig. 7. SIRP-EV leverages MSC properties to elevate ALF treatment, promoting regeneration, and diminishing inflammation.
AF Therapeutic efficacy of 4 × 109 EVs in 500 mg/kg APAP-ALF models. A Serum AST (n = 8 for Normal, APAP + HEKSIRP-EV, and APAP + SIRP-EV groups, n = 10 for APAP group) and ALT (n = 8 for APAP + HEKSIRP-EV and APAP + SIRP-EV groups, n = 10 for Normal and APAP groups) levels were determined 48 h after APAP injection in subjects treated with EVs. B Representative histological images of TUNEL staining in liver tissue from normal and APAP-ALF models after the indicated treatment. Quantification of the TUNEL-positive area is shown in the right panel (n = 8 for the APAP group, n = 10 for the Normal group, and n = 13 for APAP + HEKSIRP-EV and APAP + SIRP-EV groups). C Flow cytometry determination of Ly6G-positive neutrophils as a percentage of the total liver CD45+ leukocytes (n = 7 for APAP + HEKSIRP-EV and APAP + SIRP-EV groups, and n = 8 for Normal and APAP groups). D The abundance of proteins associated with the prevention of cell death (PAPPA, SOD2), cell proliferation (FGF, HGF, WNT ligands), and angiogenesis (uPAR, uPA) in SIRP-EVs compared to HEKSIRP-EV (n = 3 per group). P values are annotated on the bar, ****P < 0.0001. E Principal component analysis (PCA) of RNA sequencing data from CD11b+ cells from liver tissues in APAP, APAP + HEKSIRP-EV, and APAP + SIRP-EV groups (n = 3 per group). F Heatmap of 404 representative genes from each gene cluster identified. G, H Therapeutic efficacy of 4 × 109 SIRP-EVs in APAP-ALF models with CD11b reduction. G Representative histological images showing CD47 staining in liver tissue from APAP-ALF models following the specified treatment. H Serum ALT levels were measured 48 h post-APAP injection in subjects receiving the indicated treatments (n = 5 for IgG+SIRP-EV and αCD11b + SIRP-EV groups and n = 6 for IgG and αCD11b groups). I Serum AST and ALT levels were measured 48 h after injection of 300 mg/kg APAP-ALF models in subjects receiving the indicated treatments (n = 3 for APAP, APAP + NAC, and APAP + SIRP-EV groups and n = 4 per Normal group). Bar graph data are presented as mean ± SD. Statistical significance was determined by one-way ANOVA with Tukey’s post hoc test (AC, H, I), two-tailed unpaired Student’s t test (D), Benjamini–Hochberg adjusted P values (F). Source data are provided as a Source Data file.
Fig. 8
Fig. 8. A dual-mode action therapeutic strategy for ALF, SIRP-EV from engineered mesenchymal stem cells resolves CD47 in necroptotic hepatocytes and delivers regenerative cargo.
SIRP-EVs mitigate necroptosis by targeting CD47 on necroptotic hepatocytes, modulate the function of macrophages, and enhance hepatocyte regeneration, ultimately promoting liver regeneration in ALF. Created with BioRender.com. (https://BioRender.com/w56l251).

References

    1. Chen, L. et al. Inflammatory responses and inflammation-associated diseases in organs. Oncotarget9, 7204–7218 (2018). - PMC - PubMed
    1. Stravitz, R. T. & Kramer, D. J. Management of acute liver failure. Nat. Rev. Gastroenterol. Hepatol.6, 542–553 (2009). - PubMed
    1. Deutsch, M. et al. Divergent effects of RIP1 or RIP3 blockade in murine models of acute liver injury. Cell Death Dis.6, e1759 (2015). - PMC - PubMed
    1. Jaeschke, H., Ramachandran, A., Chao, X. & Ding, W.-X. Emerging and established modes of cell death during acetaminophen-induced liver injury. Arch. Toxicol.93, 3491–3502 (2019). - PMC - PubMed
    1. Zhao, H. et al. Role of necroptosis in the pathogenesis of solid organ injury. Cell Death Dis.6, e1975 (2015). - PMC - PubMed

MeSH terms

LinkOut - more resources