. 2025 Apr 2;33(4):1449-1465.
doi: 10.1016/j.ymthe.2025.02.030. Epub 2025 Feb 22.

Long-term effects of s-KL treatment in wild-type mice: Enhancing longevity, physical well-being, and neurological resilience

Affiliations

Long-term effects of s-KL treatment in wild-type mice: Enhancing longevity, physical well-being, and neurological resilience

Joan Roig-Soriano et al. Mol Ther. .

Erratum in

Abstract

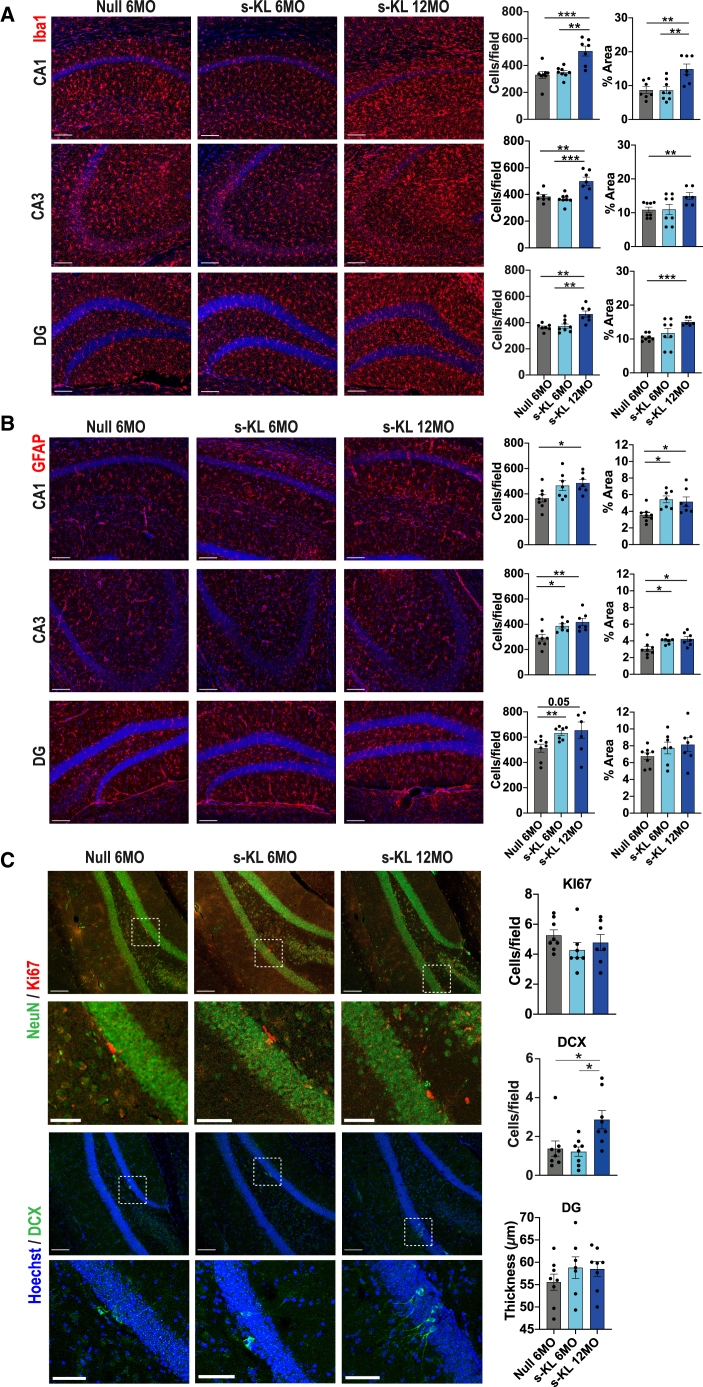
Aging is a major risk factor for pathologies including sarcopenia, osteoporosis, and cognitive decline, which bring suffering, disability, and elevated economic and social costs. Therefore, new therapies are needed to achieve healthy aging. The protein Klotho (KL) has emerged as a promising anti-aging molecule due to its pleiotropic actions modulating insulin, insulin-like growth factor-1, and Wnt signaling pathways and reducing inflammatory and oxidative stress. Here, we explored the anti-aging potential of the secreted isoform of this protein on the non-pathological aging progression of wild-type mice. The delivery of an adeno-associated virus serotype 9 (AAV9) coding for secreted KL (s-KL) efficiently increased the concentration of s-KL in serum, resulting in a 20% increase in lifespan. Notably, KL treatment improved physical fitness, related to a reduction in muscle fibrosis and an increase in muscular regenerative capacity. KL treatment also improved bone microstructural parameters associated with osteoporosis. Finally, s-KL-treated mice exhibited increased cellular markers of adult neurogenesis and immune response, with transcriptomic analysis revealing induced phagocytosis and immune cell activity in the aged hippocampus. These results show the potential of elevating s-KL expression to simultaneously reduce the age-associated degeneration in multiple organs, increasing both life and health span.

Keywords: AAV; Klotho; anti-aging; bone; longevity; muscle; neuroinflammation; osteoporosis; sarcopenia.


Conflict of interest statement

Declaration of interests Portions of this work are the subject of patent applications held by the Universitat Autonoma de Barcelona (UAB, Spain); the Universitatde Barcelona (UB, Spain); the Institucio Catalana de Recerca i Estudis Avançats (ICREA, Spain); and the Vall d'Hebron Institute of Research (VHIR, Spain). J.R.S., A.B., M.C., A.L.S. and P.M., are included in these patent applications. M.C.R. is scientific advisor of ANEW medical, a company that is seeking to develop KL-boosting therapeutics.

Figures

None
Graphical abstract
Figure 1
Figure 1
Longevity experiment follow-up and AAV treatment effectivity assessment (A) Schematic representation of the experimental plan. AAV9, IV, and ICV. (B) Body weight follow-up. (C) Violin plots of the median survival of the different treatments tested in males. (D) Longevity of the different male groups represented with Kaplan-Meyer longevity curves. Mean ± SEM, n = 11–12. (E) Schematic representation of the experimental plan. (F) s-KL gene expression analysis in the liver. Data presented as fold change expression compared with null-treated animals. (G) Quantification of total s-KL protein concentration in serum. Data presented as mean ± SEM, n = 4; ∗p < 0.05; ∗∗p < 0.01; ∗∗∗p < 0.001; ∗∗∗∗p < 0.001.
Figure 2
Figure 2
Physical tests and histological analysis of muscular tissue from treated naturally aged animals (A) Results of the accelerating rotarod test, showed as the maximum speed at which the animals were able to run. (B) Results of horizontal bar test, presented as time animals held on the bar. (C) Results of grip strength test, presented as the average force that each group exhibit in the three trials done. Data presented as mean ± SEM, n = 8–11; ∗p < 0.05; ∗∗p < 0.01; ∗∗∗p < 0.001. (D) Hematoxylin and eosin staining of fibers of the soleus muscle of male mice. Fiber size was quantified and the average size per animal was presented. (E) Sirius red staining of the soleus muscles. Graphs present the percentage of fibrotic area present in each sample. Scale bar, 100 μm. Data presented as mean ± SEM, n = 4; ∗p < 0.05; ∗∗p < 0.01.
Figure 3
Figure 3
Histological analysis of muscle from s-KL-treated animals 7 days after transplantation (A) Representative images of grafted muscular tissue stained for embryonic myosin heavy-chain by immunohistochemistry. Scale bar, 100 μm. (B) Quantification of muscular fibers presented as average fiber size and (C) frequency of the different fiber sizes. (D) Quantification of double PAX7 and Ki67 positive cells (first row) and double MyoD and Ki67 positive cells (second row) found in the grafts. Scale bars, 25 μm. Data presented as mean ± SEM, n = 8–9 (males and females); ∗p < 0.05; ∗∗p < 0.01; ∗∗∗p < 0.001.
Figure 4
Figure 4
MicroCT structural and gene expression analysis in treated bones of 24-MO mice (A) Micro-computed tomography (MicroCT) analysis of different structural variables. Cortical bone: BV, bone volume), B.Pm, bone perimeter; CsTh, cross-sectional thickness; MD, mineral density. Trabecular bone: BV/TV ratio, bone volume/tissue volume; Tb.N, trabecular number; Tb.Th, trabecular thickness; Tb.Sp, trabecular space. (B) Bone reconstruction of the regions of interest analyzed. (C) Effect of the s-KL treatment on the expression of genes representative of the different bone cell types, and bone morphogenic and bone matrix proteins. Data presented as fold change expression compared with null-treated animals. Mean ± SEM, n = 4–7; ∗p < 0.05; ∗∗p < 0.01.
Figure 5
Figure 5
Histological analysis of Iba1, GFAP, and neurogenesis markers in CNS from aged animals (A) Immunofluorescence analysis of brain slices for Iba1 (A) and GFAP (B) markers in the CA1, CA3 and dentate gyrus (DG) of the hippocampus. Scale bar, 100 μm. Value measured as average number of cells per slide (first graph) and percentage of positively stained area per image (second graph). (C) Quantification of markers representative of different differentiation stages of neurons. Cell proliferation marker (neuronal stem cells) (Ki67 in red), immature neurons (DCX in green), and mature neurons (NeuN) in green. Value measured as average number of cells per slide, or as thickness. Scale bar for images, 100 μm (first and third row) and 50 μm (second and fourth row). Each brain area was analyzed at least at three different anteroposterior positions, and in duplicate. Mean ± SEM, n = 7–8 (males and females).
Figure 6
Figure 6
Transcriptomic analysis of hippocampal RNA-seq data (A) Principal component analysis (PCA) showing overall gene expression patterns in null young (5 MO), null old (24 MO), and s-KL old (24 MO) male mice; n = 4–5. (B) Venn diagram showing the number of shared DEGs between the different male mice groups. (C) Bar chart presenting the pathway enrichment analysis of DEGs. (D) Schematic representation of the altered pathways’ activation and the main molecules driving these changes.

References

    1. Cristea M., Noja G.G., Stefea P., Sala A.L. The Impact of Population Aging and Public Health Support on EU Labor Markets. Int. J. Environ. Res. Public Health. 2020;17 - PMC - PubMed
    1. Sorond F.A., Cruz-Almeida Y., Clark D.J., Viswanathan A., Scherzer C.R., De Jager P., Csiszar A., Laurienti P.J., Hausdorff J.M., Chen W.G., et al. Aging, the Central Nervous System, and Mobility in Older Adults: Neural Mechanisms of Mobility Impairment. J. Gerontol. A. Biol. Sci. Med. Sci. 2015;70:1526–1532. - PMC - PubMed
    1. Hughes V.A., Frontera W.R., Wood M., Evans W.J., Dallal G.E., Roubenoff R., Fiatarone Singh M.A. Longitudinal muscle strength changes in older adults: influence of muscle mass, physical activity, and health. J. Gerontol. A. Biol. Sci. Med. Sci. 2001;56:B209–B217. - PubMed
    1. Volpi E., Nazemi R., Fujita S. Muscle tissue changes with aging. Curr. Opin. Clin. Nutr. Metab. Care. 2004;7:405–410. - PMC - PubMed
    1. Siparsky P.N., Kirkendall D.T., Garrett W.E., Jr. Muscle changes in aging: understanding sarcopenia. Sports Health. 2014;6:36–40. - PMC - PubMed