. 2025 Apr 1;152(7):dev204511.
doi: 10.1242/dev.204511. Epub 2025 Apr 7.

Quantifying the relationship between cell proliferation and morphology during development of the face

Affiliations

Quantifying the relationship between cell proliferation and morphology during development of the face

Lucas D Lo Vercio et al. Development. .

Abstract

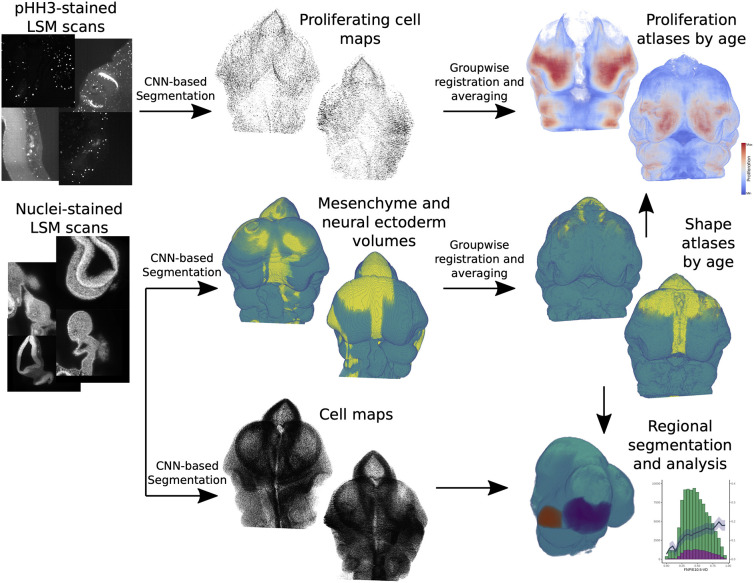
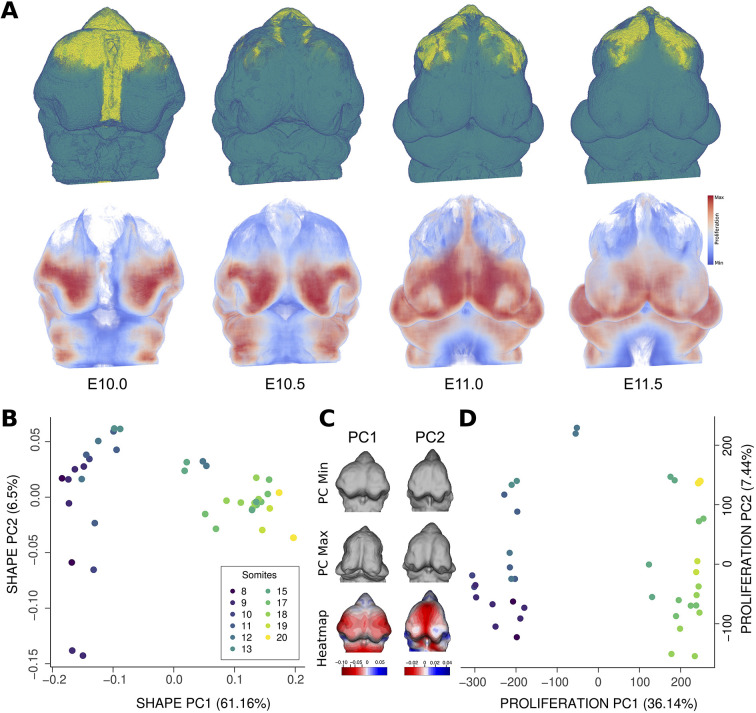
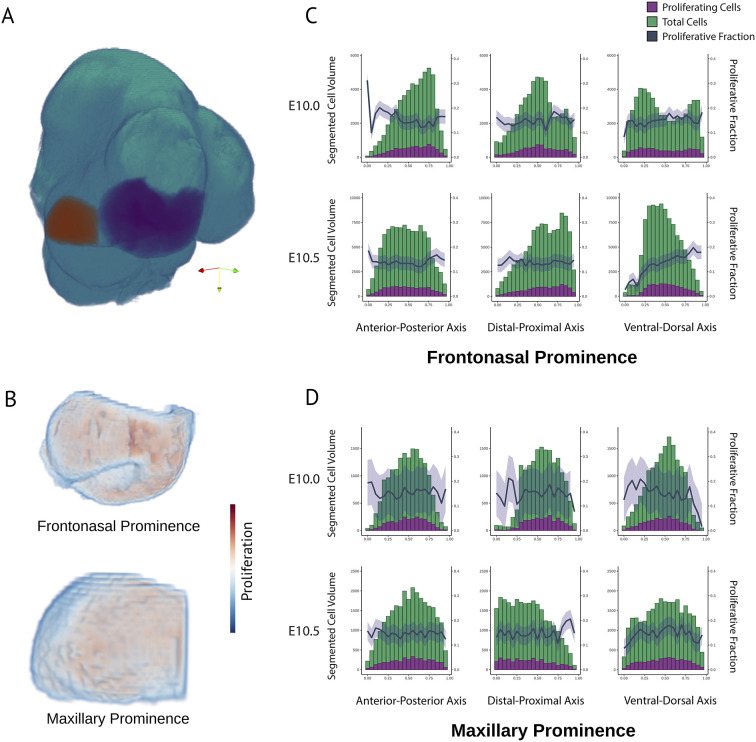
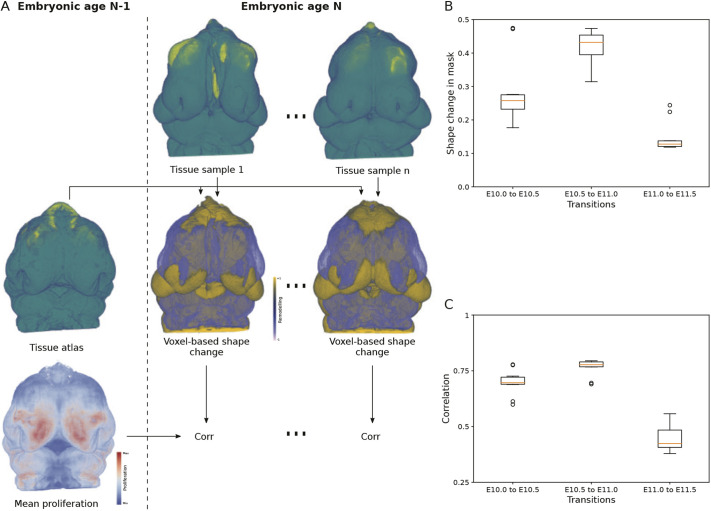
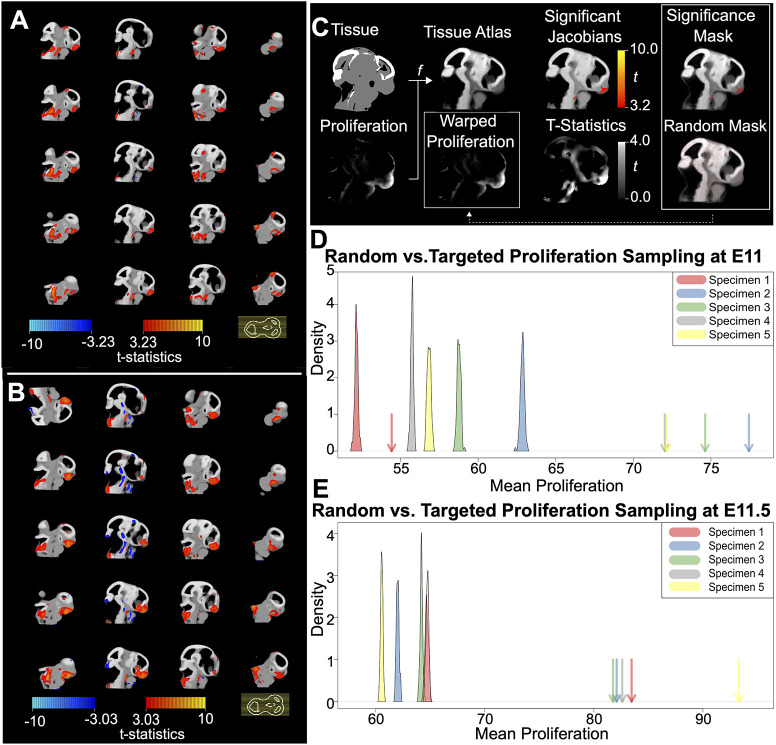
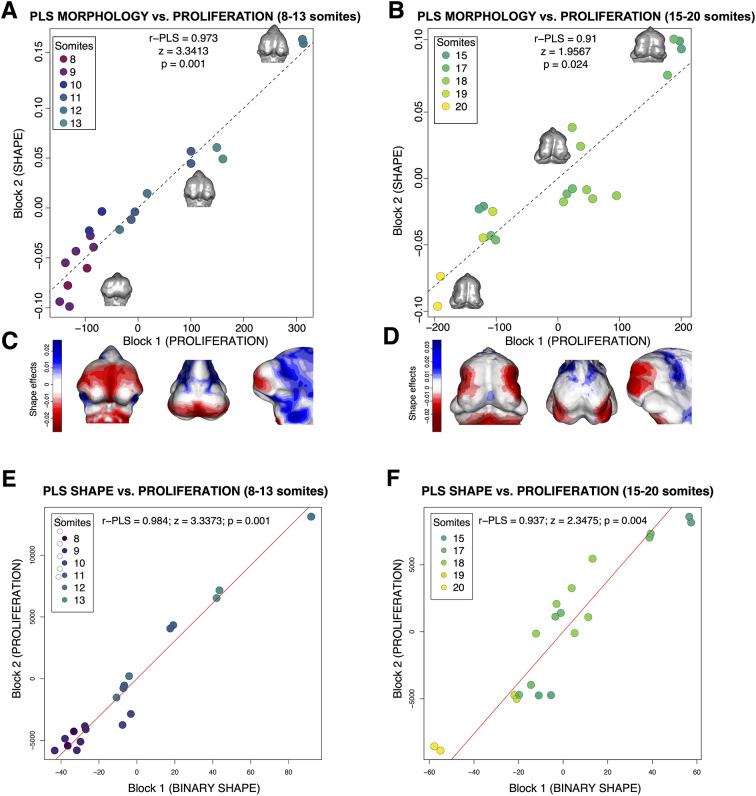
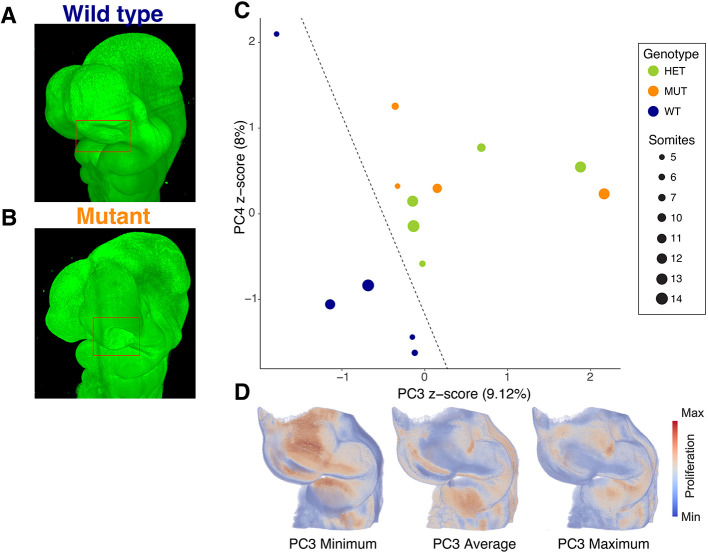
Morphogenesis requires highly coordinated, complex interactions between cellular processes: proliferation, migration and apoptosis, along with physical tissue interactions. How these cellular and tissue dynamics drive morphogenesis remains elusive. Three dimensional (3D) microscopic imaging holds great promise, and generates elegant images, but generating even moderate throughput for quantified images is challenging for many reasons. As a result, the association between morphogenesis and cellular processes in 3D developing tissues has not been fully explored. To address this gap, we have developed an imaging and image analysis pipeline to enable 3D quantification of cellular dynamics along with 3D morphology for the same individual embryo. Specifically, we focus on how 3D distribution of proliferation relates to morphogenesis during mouse facial development. Our method involves imaging with light-sheet microscopy, automated segmentation of cells and tissues using machine learning-based tools, and quantification of external morphology by geometric morphometrics. Applying this framework, we show that changes in proliferation are tightly correlated with changes in morphology over the course of facial morphogenesis. These analyses illustrate the potential of this pipeline to investigate mechanistic relationships between cellular dynamics and morphogenesis during embryonic development.

Keywords: Convolutional neural networks; Developmental biology; Image segmentation; Light-sheet imaging; Morphometrics; Mouse embryo.


Conflict of interest statement

Competing interests The authors declare no competing or financial interests.

Figures

Fig. 1.
Fig. 1.
Lightsheet visualization of mouse facial proliferation. (A) Maximum projection intensity images in which Nuclear Green has been used to stain nuclei; phospho-Histone H3 (pHH3) has been stained in magenta to mark cell proliferation. Embryos were harvested at E10-E11 from C57Bl/6J mice following timed matings. (B) Space-filling representation of the same embryos from A. Embryos were cleared and prepared following the CUBIC protocol, immunostained, and mounted in 1.5% low-melt agarose. Images were captured on a Zeiss Lightsheet Z1 microscope and analyzed in Arivis. Embryo staging was established by counting tail somites. Representative images of n=22 samples. Images are not to scale. FNP, frontonasal prominence; MdP, mandibular prominence; MxP, maxillary prominence. See Movies 1 and 2 for movie representations of the raw data.
Fig. 2.
Fig. 2.
Overview of the workflow for creating shape and proliferation atlases from LSFM scans. Twenty mouse embryos are stained for nuclei (Nuclear Green) and proliferating cells (pHH3). For each specimen, proliferating cell maps and tissues are automatically segmented using CNNs (mesenchyme in teal, neural ectoderm in yellow). For each age group (E10, E10.5, E11 and E11.5), groupwise affine-registration is performed using the tissue segmentation volume. Then, the resulting transformation for each sample is applied to its proliferating cell map. The shape atlas per age is obtained by majority voting in each voxel. The proliferation atlases are produced by smoothing and normalizing each proliferating cell map, and then averaging the resulting heat maps of the age group (minimum proliferation in blue, maximum proliferation in red).
Fig. 3.
Fig. 3.
Tissues, proliferation and shape distribution of the dataset. (A) Tissue and proliferation atlases for C57Bl/6J embryos between E10.0 and E11.5 (n=20 samples; left and right sides were mirrored and analyzed independently). The top row presents the tissue atlases for embryonic ages E10.0, E10.5, E11.0 and E11.5, showing mesenchyme in teal and neural ectoderm in yellow. Voxels are displayed as slightly transparent for visualization purposes. The bottom row shows the proliferation map atlases for the same embryonic ages, only in the mesenchyme. (B,D) Principal component analysis of Procrustes shape coordinates (C) and facial proliferation (D) for the whole embryonic dataset. Specimens are colored by tail somite count, as a proxy for age. Dataset comprises embryos from 8 to 20 somites. (C) Representative shapes moving across PC1 and PC2.
Fig. 4.
Fig. 4.
Segmented cell volume and proliferative fraction along each tissue axis at E10.0 and E10.5 in key tissues. (A) Segmentation of the maxillary prominence (orange) and frontonasal prominence (purple) on the average tissue atlas. Colored arrows denote anatomical directions: posterior (red), anterior (green), inferior (yellow). (B) Proliferative heatmaps within segmented tissues in the same view as in A. (C,D) Cell volumes and proliferative cell volumes are compared along each axis and reveal largely homogeneous proliferation in these averaged volumes. The blue line represents the proliferative fraction, or the proportion of proliferating nuclei to total nuclei, and the blue shaded area represents the s.e.m. between specimens. n=5 per age group.
Fig. 5.
Fig. 5.
Voxel-based analysis of relation between proliferation and shape change in the face. (A) Workflow to relate the shape and proliferation atlases of the previous embryonic age N−1 to the shape of each of the samples belonging to the present embryonic age N. All embryos were subject to Procrustes superimposition to remove size difference (not shown). A differential volume (−1, 0, +1) for each sample at age N is obtained by comparing to the mesenchyme of the age N−1 atlas (middle row; −1 in purple, +1 in gold; n=15 samples). Then, each voxel of the differential volume at age N was associated with the corresponding voxel of the proliferation atlas of age N−1. Finally, Pearson's linear correlation coefficient is computed only in a mask corresponding to the mesenchyme of the face. (B) Following size removal, box plots showing the proportion of voxels in the fixed mask of the face that presents outward (+1) or inward (−1) shape change between the consecutive ages studied in this work (E10.0-E11.5). (C) Box plots presenting the absolute value of the correlation coefficient between the proliferation at age N−1 with the shape change from N−1 to N, in consecutive ages. Box plots represent a standard box plot, where the middle line (red) represents the median, the box represents the 1st-3rd interquartile range, the whiskers represent 1.5× the interquartile range and dots represent outlying data points.
Fig. 6.
Fig. 6.
Voxel-based morphometry for whole embryo heads. (A,B) Statistical parametric map showing sagittal slices of craniofacial regions that undergo significant shape change from E10.5 to E11 (A) and from E11 to E11.5 (B). The slice legend is displayed on the bottom right, with each yellow line corresponding to an individual slice in the volume. Hot colors (red-yellow scale) indicate voxel expansion, whereas cold colors (blue-teal scale) represent voxel shrinkage. Shape change between time points is displayed on an average shape space. (C-E) Localizing the relationship between cell proliferation and shape change in anatomical context. (C) Overview of the image analysis workflow. We non-linearly registered each tissue volume to a novel tissue atlas, and used the corresponding transformation to warp the proliferation volume into the atlas space. Next, we calculated the Jacobian determinants of the tissue registration field and visualized significant stage-related shape deviations (t-values) with a parametric map. The red-yellow t-value scale indicates levels of increasingly large shape change. Next, we exported a volume of t-statistics to generate a shape significance mask (i.e. voxels with a t-value above the significance threshold), as well as a set of randomly sampled masks (i.e. voxels with randomly sampled t-values). The atlas masks are then overlaid (dashed line) onto each warped proliferation volume to relate proliferation to shape change in the anatomical context. (D,E) Density plots comparing the mean proliferation of n=100 randomly sampled masks (bell curves) against the mean proliferation of the significance mask (arrows) for each specimen. E11 and E11.5 are displayed separately.
Fig. 7.
Fig. 7.
Quantitative relationship between morphology and spatial patterning of proliferation. (A,B) Two-block partial least squares (PLS) analysis of Procrustes shape coordinates and proliferation in younger embryos (8-13 somites; A) and in older embryos (15-20 somites; B). Morphs within the scatterplot were constructed from Procrustes coordinates for each specimen. (C,D) Morphs were constructed from Procrustes coordinates for each specimen, and heatmaps depict shape changes associated with changes in proliferation along the first axis (latent variable of shape block), which moves more toward the maxilla with increasing age. (E,F) Two-block PLS analysis using binarized shape data. Note that the binary shape and landmark based shape results are highly similar. n=10 per age group set; left and right sides were mirrored and analyzed independently.
Fig. 8.
Fig. 8.
Separation of genetic mutant lines using SVM. (A,B) Wild-type (A) and age-matched Unicorn (B) embryos stained for total nuclei (Nuclear Green). Note the subtle difference in shape of the nasal processes in the boxed area. (C) The 14 samples for the Unicorn dataset shown in the PC3 and PC4 from the PCA of the proliferation dataset. These two PCs are the most discriminating PCs according to the coefficients obtained by the linear support vector machine (SVM). The dashed line shows the hyperplane separating the wild-type samples from the other classes (P=0.0219 for the permutation test). n=4-5 specimens per genotype, 14 total. One side was selected for analysis and no mirroring was used. P-value from the SVM model (permutation), P=0.02. HET, heterozygotes; MUT, homozygous mutants; WT, wild type. (D) Transformation of the PC3 values to highlight how proliferation is changed across PC3. PC3 maximum: 2.1657; PC3 minimum: −1.7886.

Update of

Similar articles

References

    1. Alladin, A., Chaible, L., Garcia del Valle, L., Sabine, R., Loeschinger, M., Wachsmuth, M., Hériché, J.-K., Tischer, C. and and Jechlinger, M. (2020). Tracking cells in epithelial acini by light sheet microscopy reveals proximity effects in breast cancer initiation. eLife 9, e54066. 10.7554/eLife.54066 - DOI - PMC - PubMed
    1. Baken, E., Collyer, M., Kaliontzopoulou, A. and Adams, D. (2021). geomorph v4.0 and gmShiny: enhanced analytics and a new graphical interface for a comprehensive morphometric experience. Methods Ecol. Evol. 12, 2355-2363. 10.1111/2041-210X.13723 - DOI
    1. Boehm, B., Westerberg, H., Lesnicar-Pucko, G., Raja, S., Rautschka, M., Cotterell, J., Swoger, J. and Sharpe, J. (2010). The role of spatially controlled cell proliferation in limb bud morphogenesis. PLoS Biol. 8, 1-21. 10.1371/journal.pbio.1000420 - DOI - PMC - PubMed
    1. Boughner, J. C., Wat, S., Diewert, V. M., Young, N. M., Browder, L. W. and Hallgrímsson, B. (2008). Short-faced mice and developmental interactions between the brain and the face. J. Anat. 213, 646-662. 10.1111/j.1469-7580.2008.00999.x - DOI - PMC - PubMed
    1. Bronner-Fraser, M. (1993). Mechanisms of neural crest cell migration. BioEssays 15, 221-230. 10.1002/bies.950150402 - DOI - PubMed