. 2025 Jan 27:27:585-594.
doi: 10.1016/j.csbj.2025.01.014. eCollection 2025.

Molecular dynamics simulations reveal key roles of the LIF receptor in the assembly of human LIF signaling complex

Affiliations

Molecular dynamics simulations reveal key roles of the LIF receptor in the assembly of human LIF signaling complex

Bo Gao et al. Comput Struct Biotechnol J. .

Abstract

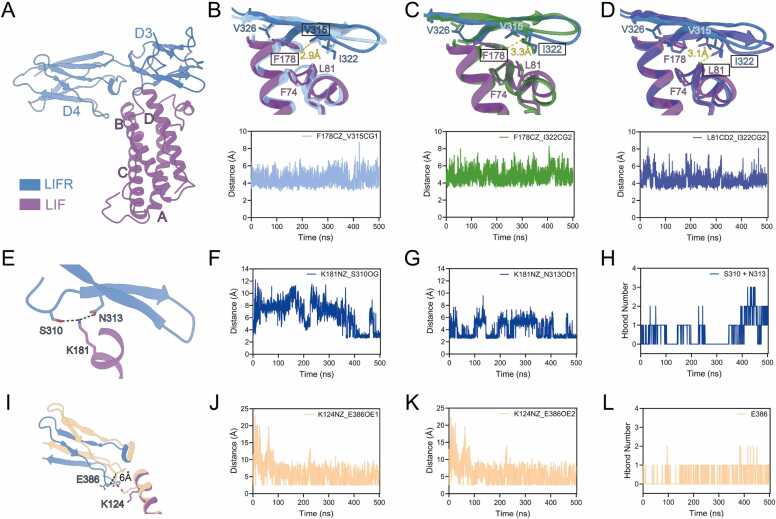
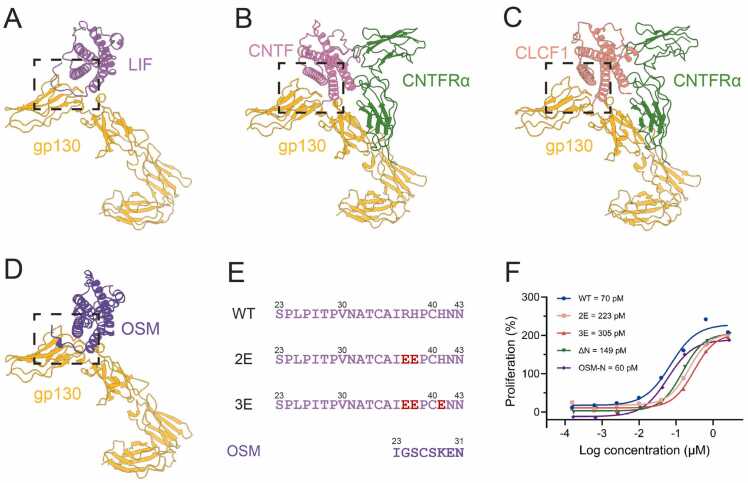
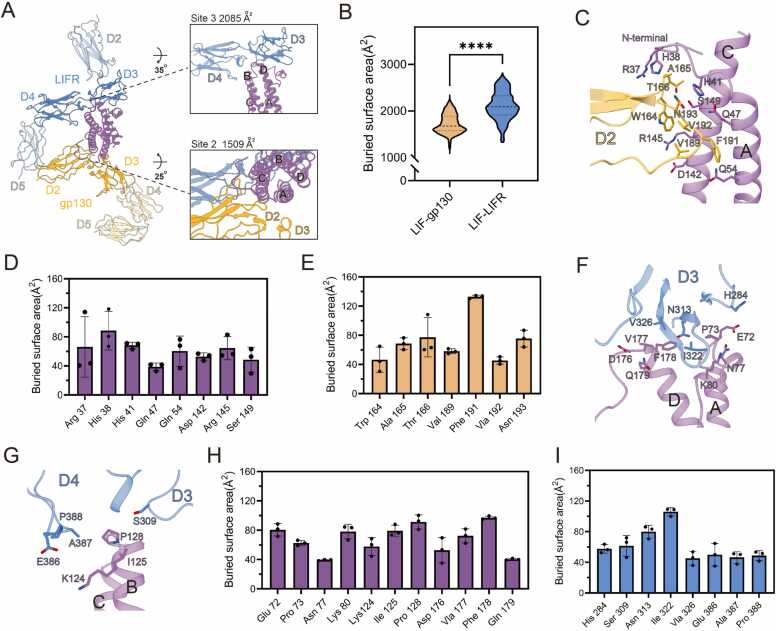
Leukemia inhibitory factor (LIF) is a critical cytokine involved in various biological processes, including stem cell self-renewal, inflammation, and cancer progression. Structural studies have revealed how LIF forms a functional signaling complex. However, the dynamic binding pattern of the complex remains inadequately clarified. In this study, we employed molecular dynamics (MD) simulations to investigate the recognition and binding mechanisms of LIF, revealing a preferential affinity for LIF Receptor (LIFR) over gp130, attributable to a larger buried surface area at the LIF-LIFR interface. Key residues F178 and K181 in FXXK motif, along with K124 in LIF helix B, mediate hydrophobic interactions, hydrogen bonding and allosteric regulation, collectively stabilizing the LIF-LIFR interaction. We propose that the unique N-terminal extension of LIF enables signaling without requiring the additional receptor subunit beyond gp130 and LIFR, as verified by cell proliferation assays, distinguishing it from other cytokines in the LIF family. Additionally, analysis of domain fluctuations revealed that the LIF-LIFR interface undergoes less angular displacement compared to the LIF-gp130 interface, indicating a more stable interaction with LIFR. Together, these findings provide valuable insights into the molecular basis of LIF recognition and binding, offering a dynamic foundation for cytokine engineering.

Keywords: Gp130; LIF; LIFR; Molecular Dynamics.


Conflict of interest statement

The authors declare that they have no known competing financial interests or personal relationships that could have appeared to influence the work reported in this paper.

Figures

None
Graphical abstract
Fig. 1
Fig. 1
Overall the LIF core complex MD simulation. (A) Snapshot of molecular dynamics simulation of the LIF core complex solution system. Water molecules are shown as red and white sticks, and the LIF structure is depicted in cartoon style with a purple color, gp130 is colored in goldenrod, and LIFR is displayed in blue. (B) RMSF of LIF in the LIF and LIF core complex MD simulations. The green line represents the apo system, and the blue line represents the complex system, (C) The LIF core complex structure are colored according to the B-factor during MD simulation. Higher B-factor values correspond to larger fluctuations. (D) Correlation map of the MD simulation for the LIF core complex. The blue box represents the gp130 residue range, the red box labels the LIF residue range, and the gray box represents the LIFR residue range.
Fig. 2
Fig. 2
Interaction dynamic Features of LIF-LIFR. (A) The overall cartoon view of LIF binding to LIFR. LIF is shown in purple, LIFR is displayed in blue. (B) The representative structure of the F178-V315 hydrophobic interaction is shown in sky-blue color, and the cryo-EM structure colored as in A. The chart below shows the distance between the CZ atom of F178 in LIF and the CG1 atom of V315 in LIFR during the MD simulation. (C) The representative structure of the F178-I322 hydrophobic interaction is shown in forest green color, and the cryo-EM structure colored as in A. The chart below shows the distance between the CZ atom of F178 in LIF and the CG2 atom of I322 in LIFR during the MD simulation. (D) The representative structure of the L81-I322 hydrophobic interaction is shown in royal blue color, and the cryo-EM structure colored as in A. The chart below shows the distance between the CD2 atom of L81 in LIF and the CG2 atom of I322 in LIFR during the MD simulation. (E) The representative structure showing K181 forming hydrogen bonds with S310 and N313. Colors as in A. (F) The distance between the NZ atom of K181 in LIF and the OG atom of S310 in LIFR during the MD simulation. (G) The distance between the NZ atom of K181 in LIF and the OD1 atom of N313 in LIFR during the MD simulation. (H) K181 forms hydrogen bonds with S310 and N313 during the MD simulation. (I) Zoom structural view showing K124 undergoing an upward flip, positioned to interaction with E386. The loop in the D4 domain displays a 6 Å inward displacement relative to LIF. The representative structure of the K124-E386 electrostatic interaction and hydrogen bond formation is shown in vanilla-colored cartoon style, while the cryo-EM structure colored as A. (J) The distance between the NZ atom of K124 in LIF and the OE1 atom of E386 in LIFR during the MD simulation. (K) The distance between the NZ atom of K124 in LIF and the OE2 atom of E386 in LIFR during the MD simulation. (L) K124 forms hydrogen bonds with E386 during the MD simulation.
Fig. 3
Fig. 3
Interaction dynamic Features of LIF-gp130. (A) The overall view of LIF binding to gp130. LIF is shown in purple cartoon style, gp130 surface is colored according to the electrostatic surface potential (blue, +5 kT; red, −5 kT). (B) RMSF of the N-terminal extension in the LIF and LIF core complex MD simulation. The green line represents the apo system, and the blue line represents the complex system. Error bars represent mean ± SD of n = 3 experiments. (C) A patch of positively charged residues of LIF are positioned to make electrostatic interactions with negatively charged region in the gp130 subunit. Contact residues are shown as sticks. gp130 surface is colored according to the electrostatic surface potential (blue, +5 kT; red, −5 kT). (D-G) Distances monitored during the MD simulation between key LIF residues and their corresponding gp130 residues. (D) R37 (NH1) in LIF and E163 (OE2) in gp130. (E) H38 (ND1) in LIF and E163 (OE1) in gp130. (F) H38 (NE2) in LIF and E195 (OE1) in gp130. (G) H41 (NE2) in LIF and D215 (OD2) in gp130. (H) H38 inserts into the negatively charged pocket of gp130. Contact residues are shown as sticks. Colors as in C. (I) The representative residues forming the negatively charged pocket of gp130 that interacts with H38 during the MD simulation. Error bars represent mean ± SD of n = 3 experiments.
Fig. 4
Fig. 4
N-terminal extension is critical for complex binding in LIF cytokine family. (A) The cartoon representation of LIF–gp130, with LIF in purple and gp130 in goldenrod. The dotted box highlights the N-terminal extension of LIF. (B) The cartoon representation of CNTF-gp130-CNTFRα (PDB: 8D74), with CNTF in hot pink, gp130 in goldenrod and CNTFRα in forest green. The dotted box highlights the N-terminus of CNTF. (C) The cartoon representation of CLCF1-gp130-CNTFRα (PDB: 8D7R), with CLCF1 in light coral, gp130 in goldenrod and CNTFRα in forest green. The dotted box highlights the N-terminus of CLCF1. (D) The cartoon representation of OSM-gp130, with OSM in blue violet and gp130 in goldenrod. The dotted box highlights the N-terminal region of OSM. The structure is predicted by AlphaFold. (E) The sequences of the N-terminal for LIF and its variants: wild-type (WT), 2E (R37E and H38E), 3E (R37E, H38E and H41E), and the chimeric OSM N-terminal. (F) TF-1 cell proliferation activity induced by LIF and its variants.
Fig. 5
Fig. 5
Comparison of LIF-LIFR and LIF-gp130 Interfaces. (A) The overall and zoom cartoon view of the LIF complex. LIF is shown in purple, LIFR is displayed in blue, and gp130 is colored in goldenrod. The rest of the structure, outside the core complex, is displayed as transparent. Above the zoom structural view, the average buried surface area corresponding to this interface is displayed. (B) The representative buried surface area of LIF-LIFR and LIF-gp130 Interfaces. **** , p < 0.0001. (C) The structural view of LIF-gp130 Interfaces. Contact residues during the MD simulation are shown as sticks. (D) Histograms of buried surface area for LIF residues at Site 2. Error bars represent mean ± SD of n = 3 experiments. (E) Histograms of buried surface area for gp130 residues at Site 2. Error bars represent mean ± SD of n = 3 experiments. (F) The structural view of the interaction between helices A and D of LIF and the D3 domain of LIFR. Contact residues during the MD simulation are shown as sticks. (G) The structural view of the interaction between helices B and C of LIF and the D3 and D4 domains of LIFR. Contact residues during the MD simulation are shown as sticks. (H) Histograms of buried surface area for LIF residues at Site 3. Error bars represent mean ± SD of n = 3 experiments. (I) Histograms of buried surface area for LIFR residues at Site 3. Error bars represent mean ± SD of n = 3 experiments.
Fig. 6
Fig. 6
Dynamics analysis of gp130- LIF -LIFR core complex. (A) Principal component analysis (PCA) scores of the dataset. Cluster 0 is shown in purple, Cluster 1 in teal, and Cluster 2 in yellow. (B) Percentage of variance explained by each principal component in the PCA. The individual percentage is represented by the black line and spheres, indicating the variance explained by each individual principal component. The cumulative percentage is shown by the sky-blue columns, representing the total variance explained by the combined principal components. (C) Angles between gp130 and LIFR relative to LIF in the representative structures of each cluster. Colors as in A. (D) The three-dimensional Gibbs energy landscape of MD domain fluctuation angles. Angle1 represents the angle between LIF and the COM (center of mass) of the gp130 D2 and D3, Angle2 represents the angle between LIF and the COM of the LIFR D3 and D4. The structure of Gibbs free energy landscape minimum is colored as gray-blue. (E) Superposition of the representative structures of Cluster 1 and Cluster 2, the cryo-EM structure, and the structure corresponding to the minimum of the Gibbs free energy landscape. Cluster 1 and Cluster 2 are colored as in A, the cryo-EM structure is shown in gray, and the structure corresponding to the minimum of the Gibbs free energy landscape is displayed in gray-blue.

Similar articles

Cited by

References

    1. Metcalf D. The leukemia inhibitory factor (LIF) Int J Cell Cloning. 1991;9:95–108. - PubMed
    1. Nicola N.A., Babon J.J. Leukemia inhibitory factor (LIF) Cytokine Growth Factor Rev. 2015;26:533–544. - PMC - PubMed
    1. Metcalf D., Nicola N.A., Gearing D.P. Effects of injected leukemia inhibitory factor on hematopoietic and other tissues in mice. Blood. 1990;76:50–56. - PubMed
    1. Bauer S., Patterson P.H. Leukemia inhibitory factor promotes neural stem cell self-renewal in the adult brain. J Neurosci. 2006;26:12089–12099. - PMC - PubMed
    1. Hirai H., Karian P., Kikyo N. Regulation of embryonic stem cell self-renewal and pluripotency by leukaemia inhibitory factor. Biochem J. 2011;438:11–23. - PMC - PubMed

LinkOut - more resources