. 2025 Feb 4;11(1):veaf007.
doi: 10.1093/ve/veaf007. eCollection 2025.

Genomic surveillance and evolution of Getah virus

Affiliations

Genomic surveillance and evolution of Getah virus

Jiaqi Shen et al. Virus Evol. .

Abstract

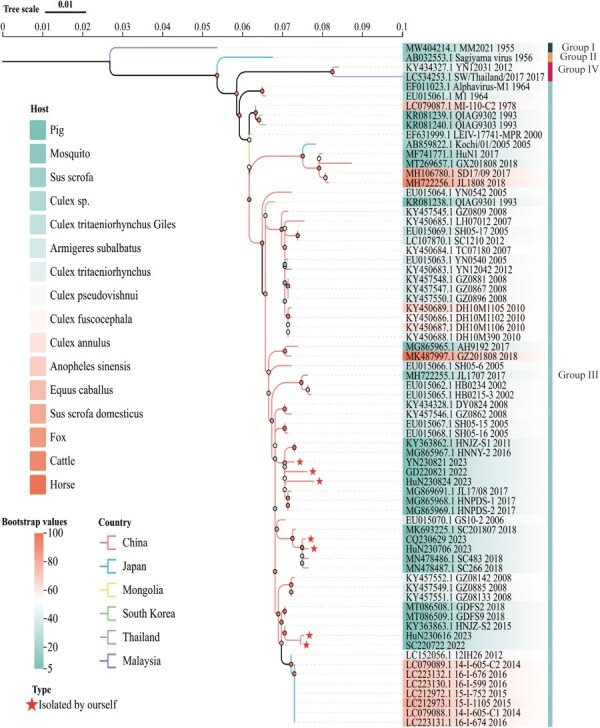
Getah virus (GETV), a member of the Alphaviruses, has spread widely and is expanding its host range worldwide, posing a serious threat to public health safety and the farming industry. However, genetic monitoring of GETV is inadequate, and its evolution and transmission remain unclear. This study employed reverse transcription-polymerase chain reaction to screen pig tissue samples for the presence of GETV. Subsequent steps included DNA sequencing, phylogenetic analysis, and selection pressure assessments to elucidate the evolutionary history and transmission patterns of the virus. A total of 1382 samples were examined, with a positivity rate of 4.12% (95% confidence interval: 3.07%-5.17%) from 2022 to 2023. Subsequently, seven GETV strains were isolated and identified. A phylogenetic tree was constructed, which showed that all seven strains belonged to Group III. Phylodynamic analysis revealed that GETV evolved rapidly. Additionally, eight amino acid sites within the GETV E2 protein were identified as being under positive selection. These data provide insight into the epidemiology and evolution of GETV.

Keywords: Getah virus; alphavirus; epidemiology; evolution; phylogenetic dynamics.


Conflict of interest statement

This manuscript has been reviewed and approved by all authors. There are no commercial or financial relationships that would lead to a potential conflict of interest.

Figures

Figure 1.
Figure 1.
GETV positivity rate in selected provinces of China. The number following the name of the provinces in the map represents the ratio of the number of positive samples to the total number of samples collected.
Figure 2.
Figure 2.
Isolation and identification of GETV. (a) PK15 cells were infected with YN230821 and HuN230706 at an MOI of 0.1. Cytopathic changes were observed at 12, 24, 36, 48, 60, and 72 h postinfection (hpi). (b) Immunofluorescence was used to illustrate the presence of GETV-E2 in PK15 cells. The fluorescence images were acquired at a 20-time magnification. (c) YN230821 and HuN230706 were inoculated into PK-15 cells, and the growth curves of the viruses were observed from 12 to 72 h after inoculation. Viral particles of GD220722 were observed in extracellular (d) and intracellular (e) matrix of PK-15 cells using a 100-kV transmission electron microscope. The scale bar was set at 100 nm for (d) and 200 nm for (e).
Figure 3.
Figure 3.
A ML tree for complete ORFs was obtained using the IQ-Tree (version 2.2.2.6) (Nguyen et al. 2015). The tree was estimated with 10 000 bootstraps and a minimum correlation coefficient of 0.9, employing the TIM3 + F + G4 distribution model.
Figure 4.
Figure 4.
A ML tree for E2 gene was obtained using the IQ-Tree (version 2.2.2.6) (Nguyen et al. 2015). The tree was estimated with 10 000 bootstraps and a minimum correlation coefficient of 0.9, employing the GTR + F + G4 distribution model.
Figure 5.
Figure 5.
Demographic history of GETV. (a) GMRF skygrid reconstruction. The 95% HPD interval region was inferred using the GMRF skyline method by analysing only the sequence data. (b) A Bayesian MCC tree for E2 gene was obtained using the BEAST package (version 1.10.4) (Suchard et al. 2018). The GTR + Γ nucleotide substitution model and the coalescent GMRF Bayesian skyride were used with a total chain length of 2 × 108 and sampled every 5 × 104 times.
Figure 6.
Figure 6.
Positively selected sites in the E2 protein. E2 (Domains A, B, C, and D, β-ribbon, TM helix, and C-terminal helix).
Figure 7.
Figure 7.
Positive selection of sites in the E1E2 complex. The E1E2 complex is depicted in a cartoon, where positive selection for the site is shown in sticks.

Similar articles

Cited by

References

    1. Ayres DL, Cummings MP, Baele G et al. BEAGLE 3: improved performance, scaling, and usability for a high-performance computing library for statistical phylogenetics. Syst Biol 2019;68:1052–61. doi: 10.1093/sysbio/syz020 - DOI - PMC - PubMed
    1. Bannai H, Nemoto M, Niwa H et al. Geospatial and temporal associations of Getah virus circulation among pigs and horses around the perimeter of outbreaks in Japanese racehorses in 2014 and 2015. BMC Vet Res 2017;13:187. doi: 10.1186/s12917-017-1112-6 - DOI - PMC - PubMed
    1. Bannai H, Nemoto M, Ochi A et al. Epizootiological investigation of Getah virus infection among racehorses in Japan in 2014. J Clin Microbiol 2015;53:2286–91. doi: 10.1128/JCM.00550-15 - DOI - PMC - PubMed
    1. Boni MF, Posada D, Feldman MW. An exact nonparametric method for inferring mosaic structure in sequence triplets. Genetics 2007;176:1035–47. doi: 10.1534/genetics.106.068874 - DOI - PMC - PubMed
    1. Drummond AJ, Ho SYW, Phillips MJ et al. Relaxed phylogenetics and dating with confidence. PLoS Biol 2006;4:e88. doi: 10.1371/journal.pbio.0040088 - DOI - PMC - PubMed

LinkOut - more resources