[Preprint]. 2025 Feb 13:rs.3.rs-5968391.
doi: 10.21203/rs.3.rs-5968391/v1.

Cross-Ancestry Comparison of Aptamer and Antibody Proteomics Measures

Affiliations

Cross-Ancestry Comparison of Aptamer and Antibody Proteomics Measures

Jayna C Nicholas et al. Res Sq. .

Abstract

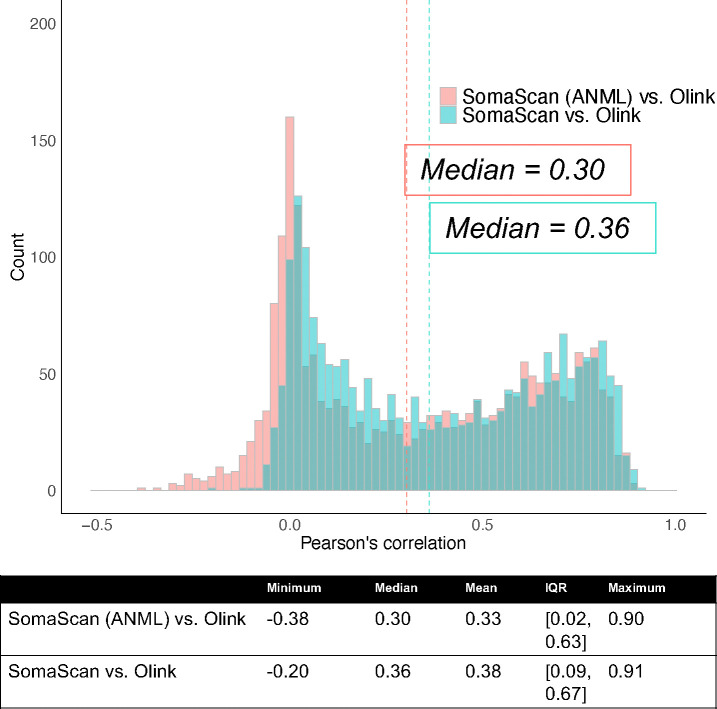
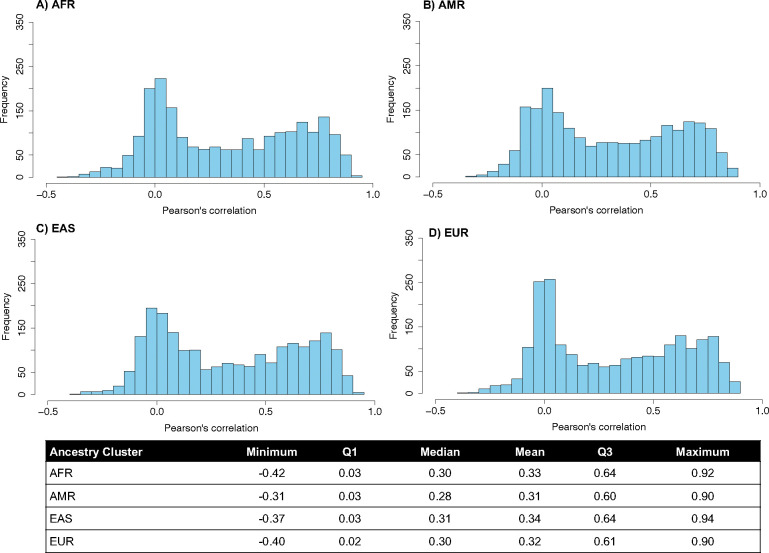
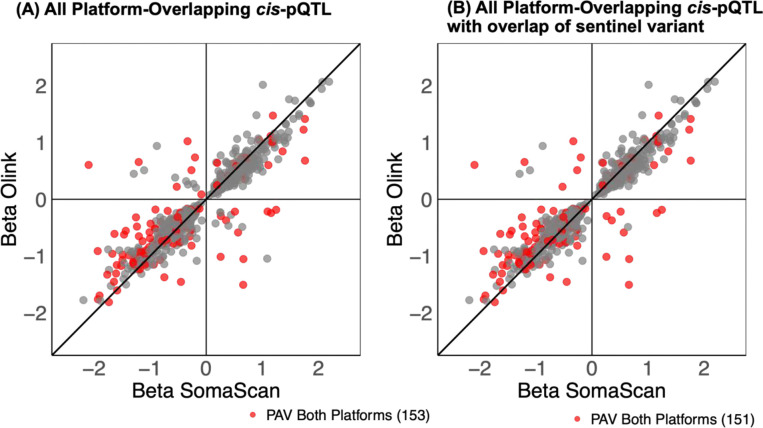
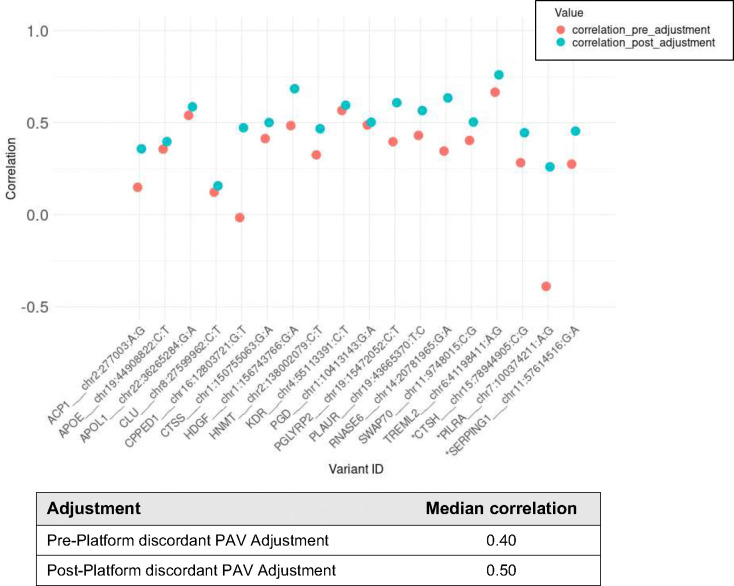
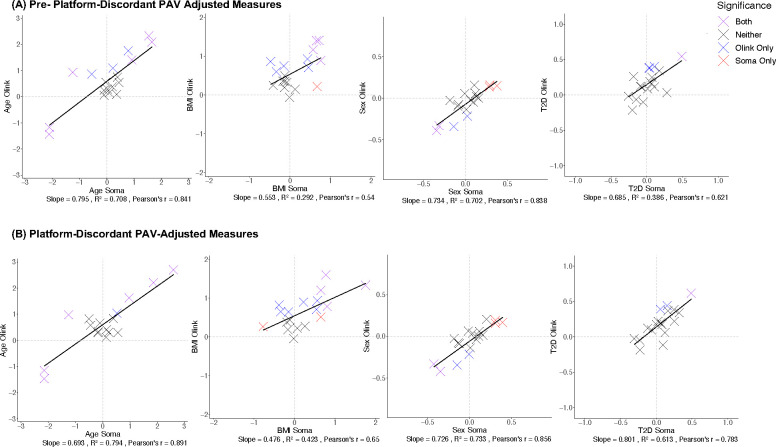
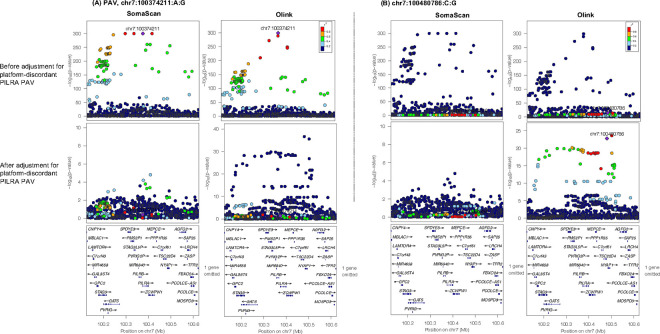
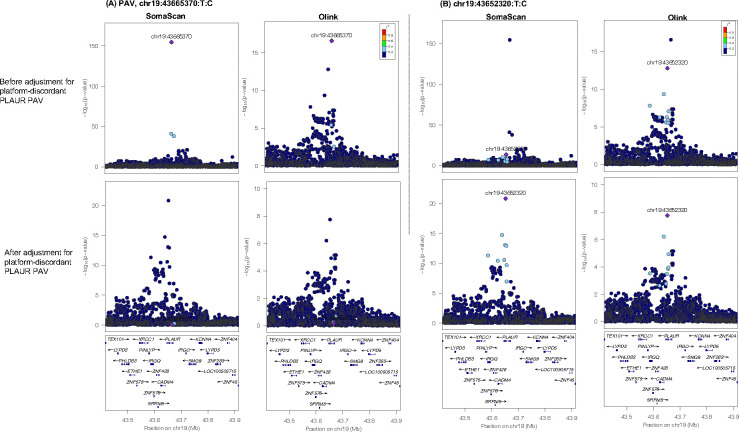
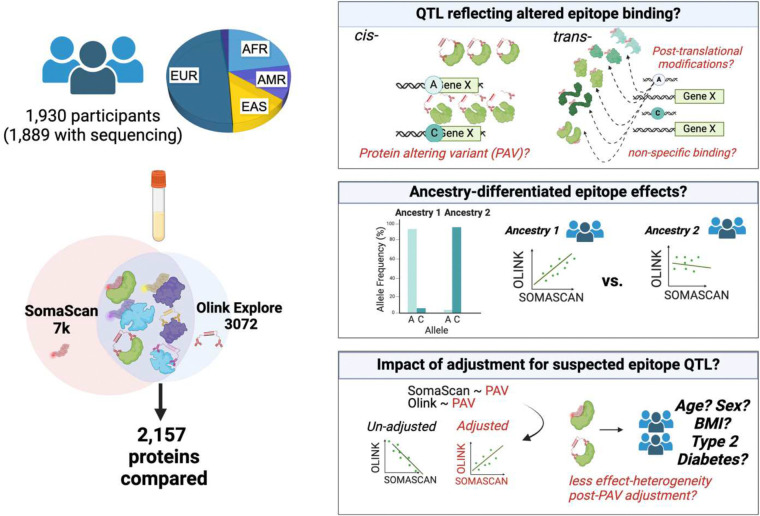
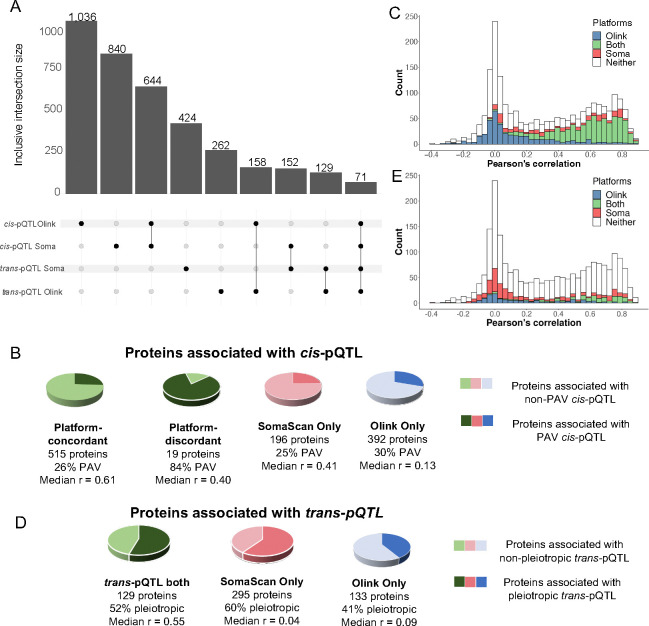
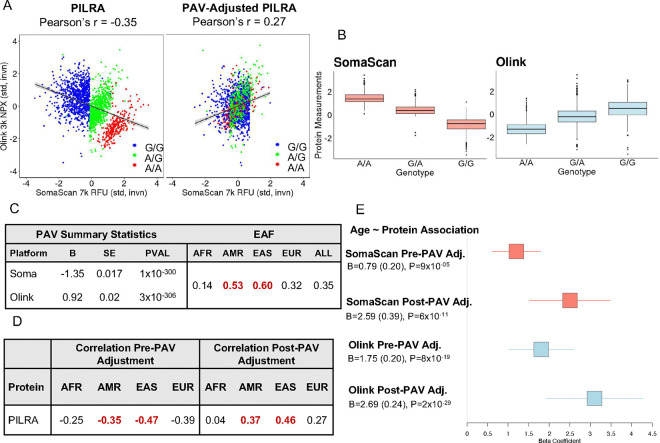
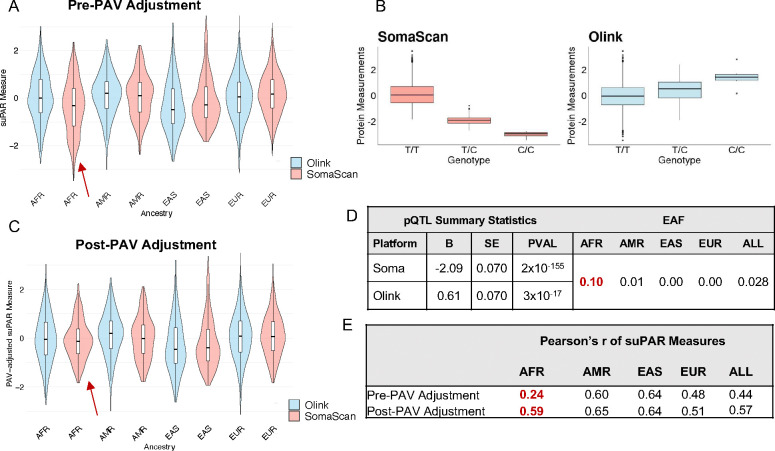
Measures from affinity-proteomics platforms often correlate poorly, challenging interpretation of protein associations with genetic variants (pQTL) and phenotypes. Here, we examined 2,157 proteins measured on both SomaScan 7k and Olink Explore 3072 across 1,930 participants with genetic similarity to European, African, East Asian, and Admixed American ancestry references. Inter-platform correlation coefficients for these 2,157 proteins followed a bimodal distribution (median r=0.30). Protein measures from each platform were associated with genetic variants (pQTLs), and one-third of the pQTL signals were driven by protein-altering variants (PAVs). We highlight 80 proteins that correlate differently across ancestry groups likely due to differing PAV frequencies by ancestry. Furthermore, adjustment for PAVs with opposite directions of effect by platform improved inter-platform protein measure correlation and resulted in more concordant genetic and phenotypic associations. Hence, PAVs need to be accounted for across ancestries to facilitate platform-concordant and accurate protein measurement.


Conflict of interest statement

Conflicts of interest LMR is a consultant for the TOPMed Administrative Coordinating Center (through Westat). DG is the Chief Executive Officer of Sequoia Genetics, a private company that works with investors, pharma, biotech, and academia by performing research that leverages genetic data to help inform drug discovery and development. DG has interests in several biotech companies.

Figures

Extended Data Figure 1.
Extended Data Figure 1.. Inter-platform Pearson’s correlation estimates for 2,157 proteins measured with both SomaScan 7k aptamer and Olink Explore 3072 antibodies.
Results from the comparison of one probe pair per UniProt ID are depicted in this figure. Correlation coefficients between base-normalized SomaScan and Olink Explore measures are plotted in blue. Correlation coefficients obtained by comparison of SomaScan measures with adaptive-normalization by maximum likelihood (ANML) performed on all samples (ANML-SMP) vs. Olink Explore measures plotted in pink.
Extended Data Figure 2.
Extended Data Figure 2.. Inter-platform Pearson correlation estimates by ancestry for 2,157 SomaScan SeqIDs and 2,157 Olink IDs targeting the 2,157 UniProt IDs measured on both platforms.
Table displays values of the minimum, first quartile (Q1), median, mean, third quartile (Q3), and maximum Pearson’s r value observed within individuals of each ancestry cluster.
Extended Data Figure 3.
Extended Data Figure 3.. Sentinel variant cis-pQTL effect-size comparison for platform-overlapping cis-pQTL identified in one-probe-per-UniProt analysis, with points colored according to whether a PAV for the protein-encoding gene was present in one or both platform’s credible set.
(A) Effect-size comparison across all platform-overlapping credible sets. (B) Effect-size comparison across platform-overlapping credible sets for which at least one platform’s sentinel variant shared.
Extended Data Figure 4.
Extended Data Figure 4.. Sentinel variant trans-pQTL effect-size comparison for overlapping trans-pQTL signals (defined by credible sets) identified in analysis of one probe per platform, per protein, with points colored according to whether a credible set was located in a pleiotropic region on both platfoms, SomaScan only, Olink only, or neither platorm.
(A) Effect-size comparison across all platform-overlapping credible sets. (B) Effect-size comparison across platform-overlapping credible sets for which at least one platform’s sentinel variant shared.
Extended Data Figure 5.
Extended Data Figure 5.. Effect size comparison of SomaScan and Olink phenotype~protein associations, for age, sex, body mass index (BMI), and type 2 diabetes (T2D)
colored by (A) inter-platform correlation and (B) Bonferroni (p<0.05/2,708) significance of association on both platforms (purple), SomaScan only (red), Olink only (blue), or neither platform.
Extended Data Figure 6.
Extended Data Figure 6.. Inter-platform correlation pre- and post-adjustment for platform-discordant PAV.
15/18 proteins with a platform-discordant PAV correspond to probes included in main analysis. Protein/PAV pairs marked with asterisk correspond to probes not included in main analysis.
Extended Data Figure 7.
Extended Data Figure 7.. Effect-sizes from phenotypic regressions of protein abundance with age, sex, body mass index (BMI), and type 2 diabetes (T2D) for the 18 proteins with a platform-discordant PAV association in the full analysis of all probe pairs per overlapping protein target
(A) Pre-PAV adjustment and (B) Post-PAV adjustment with points colored according to Bonferroni significance (p<0.05/2,708) of protein-phenotype association on both platforms (purple), SomaScan only (red), Olink only (blue), or neither platform.
Extended Data Figure 8.
Extended Data Figure 8.. Locus Zoom plot displaying the 250KB window around the platform-discordant PILRA PAV before (top) and after (bottom) adjustment for the platform-discordant PAV (chr7:100374211:A:G) on SomaScan vs. Olink, with r2 values derived in MESA study participants.
(A, Top) Platform-discordant PAV signal before adjustment on SomaScan and Olink (A, Bottom) Platform-discordant PAV signal after adjustment. As expected, this signal is attenuated to non-significance following adjustment. (B, Top) Prior to adjustment for the PAV, a second, non-coding signal in the region, led by chr7:100480786:C:G, is significantly associated with Olink PILRA measures. (B, Bottom) Following adjustment for the platform-discordant PAV, this signal becomes more significant on Olink. The Y-axes differ in scale between plots.
Extended Data Figure 9.
Extended Data Figure 9.. Locus Zoom plot displaying the 250KB window around the platform-discordant PLAUR PAV pre- (top) and post-(bottom) adjustment for the platform-discordant PAV (chr19:43665370:T:C) on SomaScan vs. Olink, with r2 values derived in MESA study participants.
(A, Top) Platform-discordant PAV signal before adjustment on SomaScan and Olink (A, Bottom) Platform-discordant PAV signal after adjustment. As expected, this signal is attenuated to non-significance following adjustment. (B, Top) Prior to adjustment for the PAV, a second, non-coding signal in the region, led by chr19:43652320:T:C, is significantly associated with Olink PILRA measures. (B, Bottom) Following adjustment for the platform-discordant PAV, this signal becomes more significant on Olink. The Y-axes differ in scale between plots.
Figure 1.
Figure 1.. Graphical summary of main analyses
with (Left) depiction of relative numbers of participants clustering with each ancestry-reference (>0.5 similarity to 1000G ancestry cluster). A small portion of participants (n=44, 2%) did not cluster with any ancestry reference population. 2,157 proteins measured on both SomaScan 7k and Olink Explore 3072 were compared in present analyses. (Right, top panel) Examples illustrating how cis- and trans- pQTL associations may capture differences in epitope binding rather than differences in protein abundance. (Right, middle panel) Genetic variants which alter epitope binding efficiency and differ in frequency across ancestries may systematically bias affinity-probe measurements in one or more ancestry groups, resulting in systematic differences in measurements, and subsequently, differences in cross-platform correlation in at least one ancestry. (Right, bottom panel) A central hypothesis of this study is that adjusting an individual’s protein measures for variants which likely impact affinity probe binding, rather than abundance, may strengthen accuracy of protein measures on the impacted platform, resulting in stronger inter-platform agreement of protein measures and more concordant downstream epidemiological and genetic associations.
Figure 2.
Figure 2.. Comparison of genetic signals detected for 2,157 proteins measured on both SomaScan and Olink Explore.
(A) UpSet plot depicting total counts of proteins with cis- and trans-pQTL on each platform. (B) Pie charts depicting the percentage of proteins associated with a platform-concordant, platform-discordant, SomaScan specific, or Olink specific cis-pQTL which were also associated with a PAV. (C) Histogram of Pearson’s correlation coefficients (r values), with bars colored to indicate which proteins in bin had a significant cis-pQTL detected on SomaScan, Olink, both, or neither platform. (D) Pie charts depicting the percentage of proteins associated with a pleiotropic trans-pQTL (signal associated with >=5 protein measures) among the proteins with a trans-pQTL on both platforms or one platform only. (E) Histogram of Pearson’s correlation coefficients (r values), with bars according to whether proteins in bin had a significant trans-pQTL detected on SomaScan, Olink, both, or neither platform.
Figure 3.
Figure 3.. Adjustment for PILRA-associated PAV improves inter-platform correlation of measures and strengthens association with age.
(A) Olink vs. SomaScan standardized and inverse normal transformed normalized protein expression (NPX) and relative fluorescence units (RFU), respectively, pre adjustment for PAV rs1859788 (chr7:100374211:A:G; p.Arg78Gly) (left) and post-PAV adjustment (right). (B) SomaScan and Olink PILRA measures by genotype. (C) pQTL summary statistics and effect allele frequencies per MESA ancestry-group. Red EAF values denote ancestries among which variant is most common (here, AMR and EAS). (D) Inter-platform protein measure correlation per ancestry pre- and post-PAV adjustment. Values highlighted in red indicate which ancestry groups experienced the largest improvement in correlation post-PAV adjustment. (E) Forest plot of age association statistics for SomaScan and Olink pre- and post-PAV adjustment.
Figure 4.
Figure 4.. Adjustment for suPAR-associated, ancestry-differentiated PAV improves correlation of suPAR measures across all participants, with improvement driven by individuals of African ancestry.
(A) suPAR measures per platform, per-ancestry, pre-adjustment for PAV rs399145 (chr19:43665370:T:C; p.Thr86Ala). (B) SomaScan and Olink suPAR measures by genotype. (C) suPAR measurements per-platform, per-ancestry, post-PAV adjustment. (D) suPAR pQTL summary statistics per platform and effect allele frequencies per ancestry group in MESA. Red EAF values denote ancestries among which variant is most common (here, AFR). (E) Inter-platform correlation of suPAR measures before and after PAV adjustment. Values highlighted in red indicate which ancestry groups experienced the largest improvement in correlation post-PAV adjustment (here, AFR).

References

    1. Ferkingstad E. et al. Large-scale integration of the plasma proteome with genetics and disease. Nat. Genet. 53, 1712–1721 (2021). - PubMed
    1. Folkersen L. et al. Genomic and drug target evaluation of 90 cardiovascular proteins in 30,931 individuals. Nat. Metab. 2, 1135–1148 (2020). - PMC - PubMed
    1. Said S. et al. Ancestry diversity in the genetic determinants of the human plasma proteome and associated new drug targets. medRxiv (2023) doi:10.1101/2023.11.13.23298365. - DOI
    1. Sun B. B. et al. Genomic atlas of the human plasma proteome. Nature 558, 73–79 (2018). - PMC - PubMed
    1. Sun B. B. et al. Plasma proteomic associations with genetics and health in the UK Biobank. Nature 622, 329–338 (2023). - PMC - PubMed

Publication types

Grants and funding

LinkOut - more resources